D3js
D3js is a JavaScript library that can manipulate documents based on data. It can help you use HTML, CSS, SVG and Canvas to display data. D3 follows the existing Web standards and can run independently in modern browsers without any other framework. It combines powerful visualization components to drive DOM operation.
append data
The enter() method finds that there is no h2 element in the page, but the data needs to be pushed (one data in each corresponding dataset). The new h2 element is append ed to the body with the text New item.
<body>
  <script>
    const dataset = [12, 31, 22, 17, 25, 18, 29, 14, 9];
    d3.select("body").selectAll("h2")
      .data(dataset)
      .enter()
      .append("h2")
      .text("New item");
  </script>
</body>
Use dynamic data in D3
<body>
  <script>
    const dataset = [12, 31, 22, 17, 25, 18, 29, 14, 9];
    d3.select("body").selectAll("h2")
      .data(dataset)
      .enter()
      .append("h2")
      .text("New Title");
  </script>
</body>
Change style based on data
<body>
  <script>
    const dataset = [12, 31, 22, 17, 25, 18, 29, 14, 9];
    d3.select("body").selectAll("h2")
      .data(dataset)
      .enter()
      .append("h2")
      .text((d) => (d + " USD"))
      .style("color", (d) => {
        if(d<20){
          return 'red';
        }else{
          return 'green';
        }
      });
  </script>
</body>
Add Class
- Syntax: attr(‘class’,‘className’)
- The attr() method in D3 can add any HTML attribute to the element, including the class name.
Dynamically update element height
Syntax: style(“cssProperty”, (d) => d)
<style>
  .bar {
    width: 25px;
    height: 100px;
    display: inline-block;
    background-color: blue;
  }
</style>
<body>
  <script>
    const dataset = [12, 31, 22, 17, 25, 18, 29, 14, 9];
    d3.select("body").selectAll("div")
      .data(dataset)
      .enter()
      .append("div")
      .attr("class", "bar")
      .style("height", (d) => d)
  </script>
</body>
Dynamically set the coordinates of each Bar
<body>
  <script>
    const dataset = [12, 31, 22, 17, 25, 18, 29, 14, 9];

    const w = 500;
    const h = 100;

    const svg = d3.select("body")
                  .append("svg")
                  .attr("width", w)
                  .attr("height", h);

    svg.selectAll("rect")
       .data(dataset)
       .enter()
       .append("rect")
       .attr("x", (d, i) => {
          return i*30;
       })
       .attr("y", 0)
       .attr("width", 25)
       .attr("height", 100);
  </script>
</body>
Add style to D3 label
D3 you can add styles to bar labels. The fill property sets the text color for the text node, and the style() method sets CSS rules for other styles, such as font family or font size.
.attr("fill","red")
.style("font-size","25px")
Add hover effect to D3 element
<style>
  .bar:hover {
    fill: brown;
  }
</style>
<body>
  <script>
    const dataset = [12, 31, 22, 17, 25, 18, 29, 14, 9];
    const w = 500;
    const h = 100;
    const svg = d3.select("body")
                  .append("svg")
                  .attr("width", w)
                  .attr("height", h);
    svg.selectAll("rect")
       .data(dataset)
       .enter()
       .append("rect")
       .attr("x", (d, i) => i * 30)
       .attr("y", (d, i) => h - 3 * d)
       .attr("width", 25)
       .attr("height", (d, i) => 3 * d)
       .attr("fill", "navy")
       .attr("class", "bar")

    svg.selectAll("text")
       .data(dataset)
       .enter()
       .append("text")
       .text((d) => d)
       .attr("x", (d, i) => i * 30)
       .attr("y", (d, i) => h - (3 * d) - 3);

  </script>
</body>
Add cx, cy, r attributes to the circle element
<body>
  <script>
    const dataset = [
                  [ 34,    78 ],
                  [ 109,   280 ],
                  [ 310,   120 ],
                  [ 79,    411 ],
                  [ 420,   220 ],
                  [ 233,   145 ],
                  [ 333,   96 ],
                  [ 222,   333 ],
                  [ 78,    320 ],
                  [ 21,    123 ]
                ];


    const w = 500;
    const h = 500;

    const svg = d3.select("body")
                  .append("svg")
                  .attr("width", w)
                  .attr("height", h);

    svg.selectAll("circle")
       .data(dataset)
       .enter()
       .append("circle")
       .attr("cx",(d)=>d[0])
       .attr("cy",(d)=>h-d[1]) // h-d[1] is positive display
       .attr("r",5)

  </script>
</body>
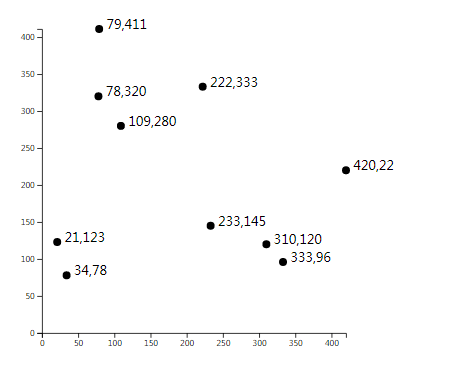
Add labels to the Circles of the scatter chart
 svg.selectAll("text")
    .data(dataset)
    .enter()
    .append("text")
    .attr("x", (d, i) => d[0]+5)
    .attr("y", (d, i) => d[1])
    .text((d) => (d[0] + ", " + d[1]))
Create linetype scale
Suppose you have a 100x500 size SVG canvas, and you want to chart gross domestic product (GDP) for many countries. This set of data will be in the range of one billion dollars or trillions of dollars. You provide D3 with a scaling method and tell it how to place a large GDP value in an area of 100x500.
Syntax:
 const scale = d3.scaleLinear(); // Create the axis here
 const output = scale(50); // Call scale and pass in a parameter
Set fields and ranges proportionally:
scale.domain([50, 480]); //Domain of dataset
scale.range([10, 500]);  //Range of data
Use D3 Max and D3 The Min function finds the minimum and maximum values in the dataset
const exampleData = [34, 234, 73, 90, 6, 52];
d3.min(exampleData)
d3.max(exampleData)

// How to find the maximum and minimum values of a two-dimensional array
const locationData = [[1, 7],[6, 3],[8, 3]];
const minX = d3.min(locationData, (d) => d[0]);
Add axis to view
Another way to improve the scatter chart is to add x and y axes. D3 has two methods to render the y-axis and x-axis: axisLeft() and axisBottom().
 const xAxis = d3.axisBottom(xScale);
 const yAxis = d3.axisLeft(yScale);
design sketch
<body>
  <script>
    const dataset = [
                  [ 34,     78 ],
                  [ 109,   280 ],
                  [ 310,   120 ],
                  [ 79,   411 ],
                  [ 420,   220 ],
                  [ 233,   145 ],
                  [ 333,   96 ],
                  [ 222,    333 ],
                  [ 78,    320 ],
                  [ 21,   123 ]
                ];

    const w = 500;
    const h = 500;
    const padding = 60;

    const xScale = d3.scaleLinear()
                     .domain([0, d3.max(dataset, (d) => d[0])])
                     .range([padding, w - padding]);

    const yScale = d3.scaleLinear()
                     .domain([0, d3.max(dataset, (d) => d[1])])
                     .range([h - padding, padding]);

    const svg = d3.select("body")
                  .append("svg")
                  .attr("width", w)
                  .attr("height", h);

    svg.selectAll("circle")
       .data(dataset)
       .enter()
       .append("circle")
       .attr("cx", (d) => xScale(d[0]))
       .attr("cy",(d) => yScale(d[1]))
       .attr("r", (d) => 5);

    svg.selectAll("text")
       .data(dataset)
       .enter()
       .append("text")
       .text((d) =>  (d[0] + "," + d[1]))
       .attr("x", (d) => xScale(d[0] + 10))
       .attr("y", (d) => yScale(d[1]))

    const xAxis = d3.axisBottom(xScale);
    const yAxis = d3.axisLeft(yScale);


svg.append("g")
   .attr("transform", "translate(0, " + (h - padding) + ")")
   .call(xAxis);
svg.append("g")
   .attr("transform", "translate(" + padding + ",0)")
   .call(yAxis);

  </script>
</body>