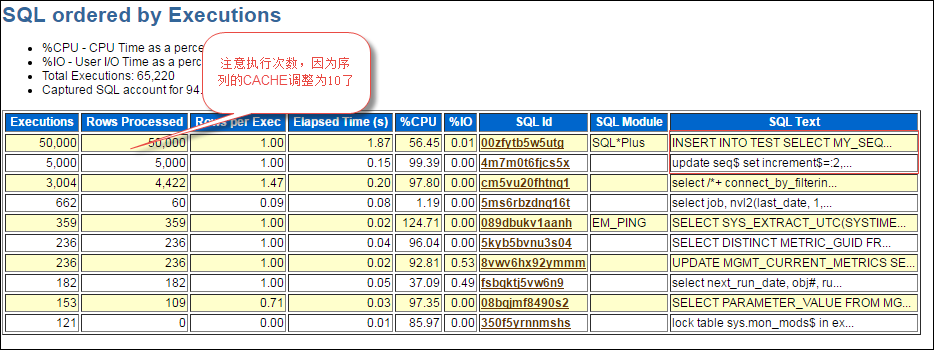
When analyzing the AWR report of ORACLE, we found that the SQL ordered by Executions (recorded TOP SQL sorted by the number of executions of SQL). This sort shows the number of executions of SQL within the scope of monitoring.) There is a very frequent execution of SQL statements, executing tens of thousands of times in an hour:
update seq$ set increment$=:2, minvalue=:3, maxvalue=:4, cycle#=:5, order$=:6, cache=:7, highwater=:8, audit$=:9, flags=:10 where obj#=:1
So what does seq $do with this data dictionary table? In fact, this data dictionary table saves information about SEQUENCE under the database, and it is used to maintain sequence changes. As shown below, we validate it experimentally by enabling 10046 events, tracking sessions (level=4 means enabling SQL_TRACE and capturing binding variables in the trace file), and tracking the process of session creation sequence. The following test environment is Oracle 11g
SQL> show user;USER is "TEST"SQL> alter session set events '10046 trace name context forever, level 4';Session altered.SQL> create sequence my_sequence_test2 start with 13 increment by 14 maxvalue 9999999995 nocache;Sequence created.SQL> alter session set events '10046 trace name context off';Session altered.SQL> SELECT a.VALUE2 || b.symbol3 || LOWER(c.instance_name)4 || '_ora_'5 || d.spid6 || '.trc' trace_file7 FROM (SELECT VALUE8 FROM v$parameter9 WHERE NAME = 'user_dump_dest') a,10 (SELECT SUBSTR (VALUE, -6, 1) symbol11 FROM v$parameter12 WHERE NAME = 'user_dump_dest') b,13 (SELECT instance_name14 FROM v$instance) c,15 (SELECT spid16 FROM v$session s, v$process p, v$mystat m17 WHERE s.paddr = p.addr AND s.SID = m.SID AND m.statistic# = 0) d18 /TRACE_FILE--------------------------------------------------------------------------------/u01/app/oracle/diag/rdbms/gsp/gsp/trace/gsp_ora_28201.trc
[oracle@DB-Server trace]$ tkprof gsp_ora_28201.trc anay_out_28201.txt aggreage=yes;LRM-00101: unknown parameter name 'aggreage'error during command line parsing, cannot continue.[oracle@DB-Server trace]$ tkprof gsp_ora_28201.trc anay_out_28201.txt aggregate=yes;TKPROF: Release 11.2.0.1.0 - Development on Tue Aug 29 22:52:08 2017Copyright (c) 1982, 2009, Oracle and/or its affiliates. All rights reserved.
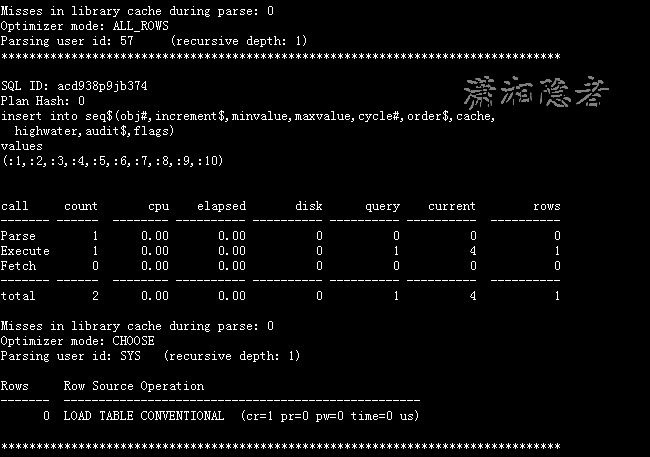
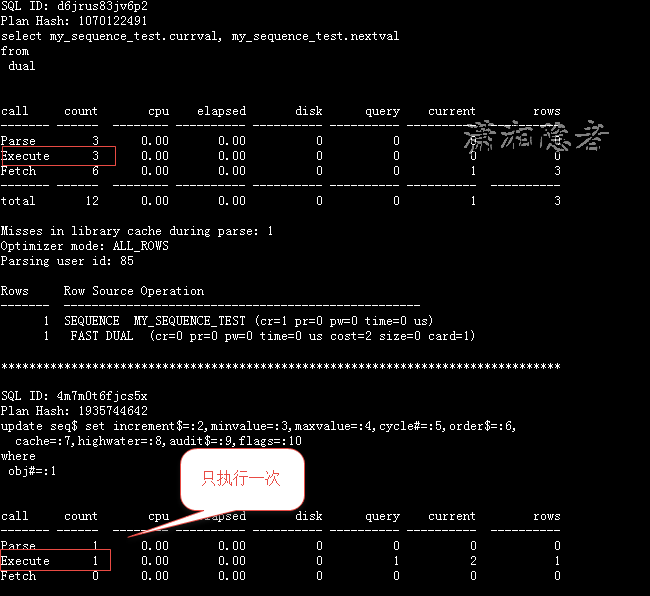
After using tkprof to convert trace files into readable formats, you will notice that when you create a sequence, you insert a record into the data dictionary table seq$(in fact, the essence of creating a sequence is to insert a record into seq$and obj$), as shown in the following screenshot:
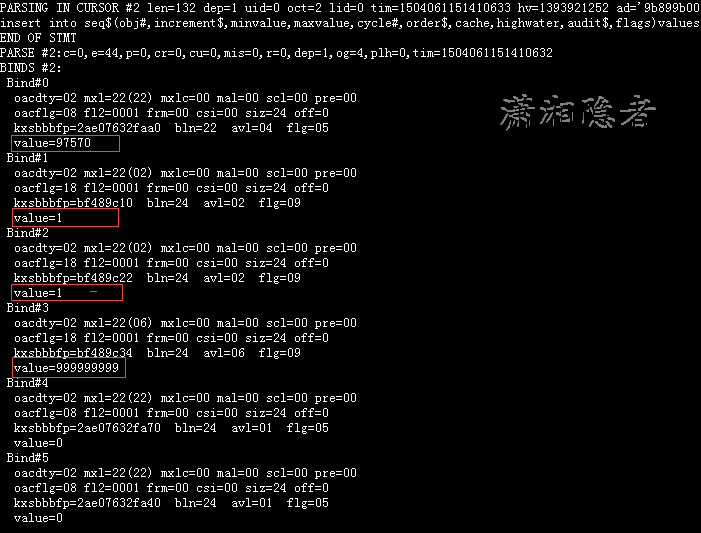
There are no bound variables in the output file formatted by tkprof. In the original trace file gsp_ora_28201.trc, you can see the values of the corresponding bound variables.
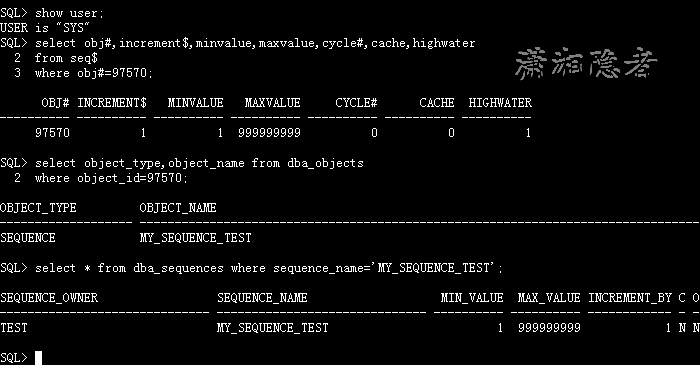
Using the following script, you will find that this is some information about the corresponding sequence object (OBJECT_ID, MINVALUE, MAXVALUE, CACHE, etc.)
SQL> show user;USER is "SYS"SQL> select obj#,increment$,minvalue,maxvalue,cycle#,cache,highwater2 from seq$3 where obj#=97570;OBJ# INCREMENT$ MINVALUE MAXVALUE CYCLE# CACHE HIGHWATER---------- ---------- ---------- ---------- ---------- ---------- ----------97570 1 1 999999999 0 0 1SQL> select object_type,object_name from dba_objects2 where object_id=97570;OBJECT_TYPE OBJECT_NAME------------------- -----------------------------------------------SEQUENCE MY_SEQUENCE_TESTSQL> select * from dba_sequences where sequence_name='MY_SEQUENCE_TEST';SEQUENCE_OWNER SEQUENCE_NAME MIN_VALUE MAX_VALUE INCREMENT_BY C O CACHE_SIZE LAST_NUMBER-------------- ---------------- ---------- ---------- ------------ - - ---------- -----------TEST MY_SEQUENCE_TEST 1 999999999 1 N N 0 1SQL>
Now let's use SQL TRACE to see what happens to the seq $table when we use SEQUENCE. As shown below, we execute the SQL statement three times after enabling SQL_TRACE
SQL> show user;USER is "TEST"SQL> select my_sequence_test.currval, my_sequence_test.nextval from dual;CURRVAL NEXTVAL---------- ----------1 1SQL> alter session set sql_trace=true;Session altered.SQL> select my_sequence_test.currval, my_sequence_test.nextval from dual;CURRVAL NEXTVAL---------- ----------2 2SQL> select my_sequence_test.currval, my_sequence_test.nextval from dual;CURRVAL NEXTVAL---------- ----------3 3SQL> select my_sequence_test.currval, my_sequence_test.nextval from dual;CURRVAL NEXTVAL---------- ----------4 4SQL> alter session set sql_trace=false;Session altered.SQL>
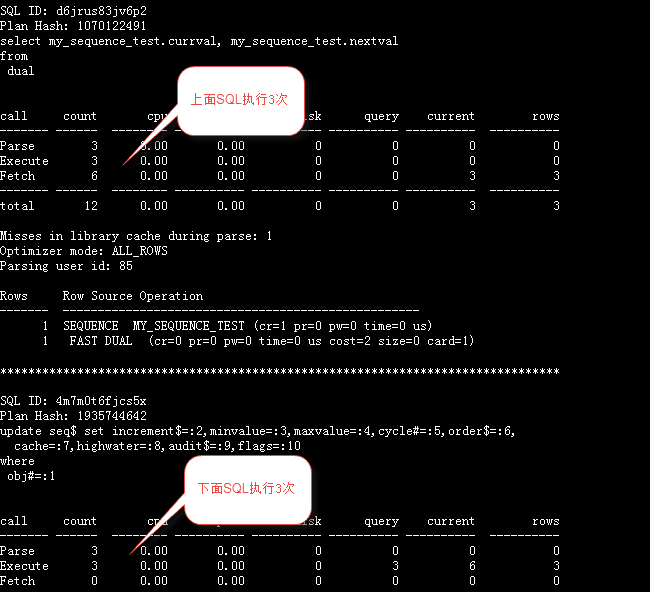
In the trace file (which is similar to looking at the trace file above and ignoring the specific process here), you will see that the seq $has also been updated three times to update the value of HIGHWATER.
update seq$ set increment$=:2,minvalue=:3,maxvalue=:4,cycle#=:5,order$=:6,
cache=:7,highwater=:8,audit$=:9,flags=:10
where
obj#=:1
Next, we modify the value of the sequence CACHE attribute and repeat the above operation. As shown below, in the trace file, you will see that only seq $is updated once. In fact, the number of updates of seq $is related to the value of CACHE. So the proper use of CACHE can reduce the number of updates to the seq $data dictionary table.
SQL> alter sequence my_sequence_test cache 10;Sequence altered.SQL> alter session set sql_trace=true;Session altered.SQL> select my_sequence_test.currval, my_sequence_test.nextval from dual;CURRVAL NEXTVAL---------- ----------5 5SQL> select my_sequence_test.currval, my_sequence_test.nextval from dual;CURRVAL NEXTVAL---------- ----------6 6SQL> select my_sequence_test.currval, my_sequence_test.nextval from dual;CURRVAL NEXTVAL---------- ----------7 7SQL> alter session set sql_trace=false;Session altered.SQL>
So let's create a table, then recursively call the sequence, and then generate the AWR report for the corresponding time period. Let's recreate the problems encountered in the production environment.
SQL> create table test(id number);Table created.beginfor row_num in 1 .. 50000loopinsert into testselect my_sequence_test.nextval from dual;commit;end loop;end;/
As shown below, you can see that the INSERT statement was executed 50,000 times, and the update seq $was executed 5,000 times, because the above test set the sequence's CACHE to 10. If CACHE was not set, the sequence would be called 50,000 times, and the update seq $object would also be updated 50,000 times.
In addition, the call sequence also has some redo log overhead. As shown in the following test, we first set the sequence to NOCACHE, and then the test process found that each execution had more than 900 redo log generated.
SQL> alter sequence my_sequence_test nocache;Sequence altered.SQL> set autotrace on;SQL> select my_sequence_test.nextval from dual;NEXTVAL----------50015Execution Plan----------------------------------------------------------Plan hash value: 1070122491-----------------------------------------------------------------------------| Id | Operation | Name | Rows | Cost (%CPU)| Time |-----------------------------------------------------------------------------| 0 | SELECT STATEMENT | | 1 | 2 (0)| 00:00:01 || 1 | SEQUENCE | MY_SEQUENCE_TEST | | | || 2 | FAST DUAL | | 1 | 2 (0)| 00:00:01 |-----------------------------------------------------------------------------Statistics----------------------------------------------------------30 recursive calls3 db block gets3 consistent gets0 physical reads908 redo size527 bytes sent via SQL*Net to client523 bytes received via SQL*Net from client2 SQL*Net roundtrips to/from client0 sorts (memory)0 sorts (disk)1 rows processedSQL> select my_sequence_test.nextval from dual;NEXTVAL----------50016Execution Plan----------------------------------------------------------Plan hash value: 1070122491-----------------------------------------------------------------------------| Id | Operation | Name | Rows | Cost (%CPU)| Time |-----------------------------------------------------------------------------| 0 | SELECT STATEMENT | | 1 | 2 (0)| 00:00:01 || 1 | SEQUENCE | MY_SEQUENCE_TEST | | | || 2 | FAST DUAL | | 1 | 2 (0)| 00:00:01 |-----------------------------------------------------------------------------Statistics----------------------------------------------------------14 recursive calls4 db block gets1 consistent gets0 physical reads908 redo size527 bytes sent via SQL*Net to client523 bytes received via SQL*Net from client2 SQL*Net roundtrips to/from client0 sorts (memory)0 sorts (disk)1 rows processedSQL>
If you use the sequence object of CACHE, the frequency of redo size generation is obviously much lower. As shown below, only redo log is generated for the first time in three tests, which is related to the sequence's CACHE value. When the cached sequence value is used up and a new sequence value cache is generated, redo log will also be generated.
SQL> alter sequence my_sequence_test cache 10;Sequence altered.SQL> set autotrace on;SQL> select my_sequence_test.nextval from dual;NEXTVAL----------50017Execution Plan----------------------------------------------------------Plan hash value: 1070122491-----------------------------------------------------------------------------| Id | Operation | Name | Rows | Cost (%CPU)| Time |-----------------------------------------------------------------------------| 0 | SELECT STATEMENT | | 1 | 2 (0)| 00:00:01 || 1 | SEQUENCE | MY_SEQUENCE_TEST | | | || 2 | FAST DUAL | | 1 | 2 (0)| 00:00:01 |-----------------------------------------------------------------------------Statistics----------------------------------------------------------30 recursive calls3 db block gets3 consistent gets0 physical reads908 redo size527 bytes sent via SQL*Net to client523 bytes received via SQL*Net from client2 SQL*Net roundtrips to/from client0 sorts (memory)0 sorts (disk)1 rows processedSQL> select my_sequence_test.nextval from dual;NEXTVAL----------50018Execution Plan----------------------------------------------------------Plan hash value: 1070122491-----------------------------------------------------------------------------| Id | Operation | Name | Rows | Cost (%CPU)| Time |-----------------------------------------------------------------------------| 0 | SELECT STATEMENT | | 1 | 2 (0)| 00:00:01 || 1 | SEQUENCE | MY_SEQUENCE_TEST | | | || 2 | FAST DUAL | | 1 | 2 (0)| 00:00:01 |-----------------------------------------------------------------------------Statistics----------------------------------------------------------0 recursive calls0 db block gets0 consistent gets0 physical reads0 redo size527 bytes sent via SQL*Net to client523 bytes received via SQL*Net from client2 SQL*Net roundtrips to/from client0 sorts (memory)0 sorts (disk)1 rows processedSQL> select my_sequence_test.nextval from dual;NEXTVAL----------50019Execution Plan----------------------------------------------------------Plan hash value: 1070122491-----------------------------------------------------------------------------| Id | Operation | Name | Rows | Cost (%CPU)| Time |-----------------------------------------------------------------------------| 0 | SELECT STATEMENT | | 1 | 2 (0)| 00:00:01 || 1 | SEQUENCE | MY_SEQUENCE_TEST | | | || 2 | FAST DUAL | | 1 | 2 (0)| 00:00:01 |-----------------------------------------------------------------------------Statistics----------------------------------------------------------0 recursive calls0 db block gets0 consistent gets0 physical reads0 redo size527 bytes sent via SQL*Net to client523 bytes received via SQL*Net from client2 SQL*Net roundtrips to/from client0 sorts (memory)0 sorts (disk)1 rows processed
Another problem is that if the sequence is NOCACHE, row lock contention will also occur when the sequence is called concurrently, so setting an appropriate CACHE value for the sequence is of great benefit, both reducing redo log generation and avoiding row lock contention (and updating seq $the same row record concurrently). However, when CACHE is set in the sequence, it may also encounter the problem of jumping marks. Then this needs to be considered and dealt with according to the actual situation.
Reference material:
https://asktom.oracle.com/pls/asktom/f?p=100:11:451611870226342::::P11_QUESTION_ID:2985886242221
