User portrait is the most important link in the top-level application of big data. It is particularly important to build a set of user portrait suitable for the company's system. However, the data of user portraits are often mostly theoretical, less practical, and less engineering practical cases.
This document combines the common user portrait architecture and uses Elasticsearch as the underlying storage support. The retrieval and visualization efficiency of user portrait has been greatly improved. The document involves both the theory and practice of user portrait. You can refer to this document to complete the construction of user portrait system from 0 to 1.
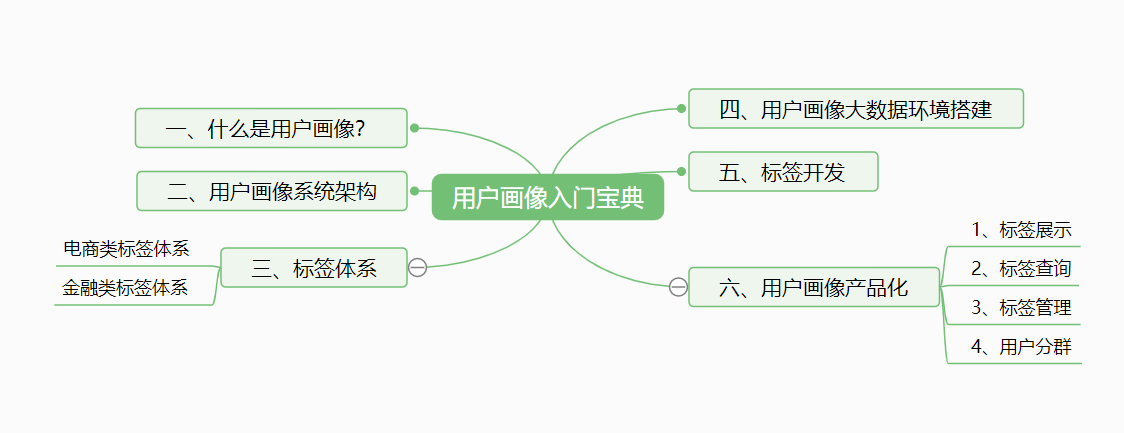
This document is divided into 6 parts, and the hierarchical structure is shown in the figure below.

Document copyright is for official account. Relevant technical problems and installation packages can be obtained by contacting the author Dugu Feng and joining the relevant technical exchange group.
1, What is a user portrait?
User profile
User portrait, as an effective tool for outlining target users and contacting user demands and design directions, has been widely used in various fields.
User portrait was initially applied in the field of e-commerce. In the context of the big data era, user information is flooded in the network, abstracting each specific information of users into labels, and using these labels to concretize the user image, so as to provide targeted services for users.
Do you remember the annual consumption bill of Alipay received at the end of the year? Help customers review the consumption details of a year, including consumption capacity, consumption destination, credit limit, etc., and then customize the commodity recommendation list according to each customer's consumption habits... This activity pushes the quantitative word data to the public in a vivid way.
This is an application of user portrait in the field of e-commerce. With the rapid development of e-commerce in China, more and more people pay attention to the role of data information in promoting the e-commerce market. Precision marketing based on data analysis can maximize the mining and retention of potential customers. The breakthrough brought by data statistics and analysis to the e-commerce market is immeasurable. In the era of big data, everything can be "quantified". Behind the seemingly ordinary small numbers, there are infinite business opportunities, which are being understood by more and more enterprises.

How to mine business opportunities from big data? Establishing user portrait and accurate analysis is the key.
User portrait can make the service object of the product more focused and focused. In the industry, we often see such a phenomenon: to make a product, we expect the target users to cover everyone, men and women, the elderly and children, expert Xiaobai, Wenqing loser Usually, such products will die out, because each product serves the common standard of a specific target group. The larger the base of the target group, the lower the standard. In other words, if this product is suitable for everyone, it actually serves the lowest standard. Such a product is either featureless or too simple.

Looking at successful product cases, the target users they serve are usually very clear and have obvious characteristics. They are focused and extreme in products and can solve core problems. For example, Apple's products have always served people with attitude, pursuit of quality and independence, and won a good user reputation and market share. Another example is Douban, which has focused on the cause of literature and art for more than ten years and only serves the youth of literature and art. The user stickiness is very high. The youth of literature and art can find a bosom friend and a home here. Therefore, providing dedicated services to specific groups is far closer to success than providing low-standard services to a wide range of people. Secondly, user portrait can avoid product designers representing users hastily to a certain extent. It is a common phenomenon in product design to speak in place of users. Product designers often unconsciously think that users' expectations are consistent with them, and always under the banner of "serving users". Such consequences are often: our well-designed services, users do not buy, or even feel very bad.
In the process of product R & D and marketing, identifying target users is the primary task. Different types of users often have different or even conflicting needs. It is impossible for enterprises to make a product and marketing to meet all users. Therefore, it is essential to establish user portrait through big data.
Imperceptibly, the user portrait has been infiltrated into all fields. In the most popular areas such as voice, live broadcast, etc., the tiktok system can be traced back to the future when the recommendation system comes to the big data era.
User portrait implementation steps
What is a user portrait? User portraits are fictional representations of ideal customers created based on Market Research and data. Create user portraits, which will help to understand the target audience in real life. The personas created by enterprises are specific to their goals and needs, and solve their problems. At the same time, it will help enterprises transform customers more intuitively.
The most important step of user portrait is to label users. We should clearly analyze various dimensions of users in order to determine how to portrait users.
There are many steps in creating a user portrait:
- First, basic data collection. The e-commerce field is roughly divided into behavior data, content preference data and transaction data, such as browsing volume, visit duration, furniture preference, return rate, etc. In the financial field, there are loan information, credit card, all kinds of credit information and so on.
- Then, after we collect the basic data needed for user portrait, we need to analyze and process these data, refine the key elements and build a visual model. Conduct behavior modeling on the collected data and abstract the user's label. In the field of e-commerce, users' basic attributes, purchasing power, behavioral characteristics, interests, psychological characteristics and social networks may be roughly labeled, while in the field of financial risk control, users' basic information, risk information, financial information and so on are more concerned.
- Then, we should use the overall architecture of big data to develop and implement the labeling process, process the data and manage the label. At the same time, calculate the label calculation results. In this process, we need to rely on Hive, Hbase and other big data technologies. In order to improve the real-time performance of data, we also need to use Flink, Kafka and other real-time computing technologies.
- Finally, the most critical step is to form our calculation results, data, interfaces, etc. into services. For example, chart display, visual display,

In fact, in the process of building user portraits, we pay attention to the diversity of extracted data rather than singleness, such as extracting different data for different types of customers, or analyzing the differences between online and offline customers. In short, ensuring the richness, diversity and scientificity of data is the premise of establishing accurate user portraits.
After the user portrait is basically formed, it can be visualized and accurately analyzed. At this time, it is generally an analysis for groups. For example, we can subdivide the core users according to the user value and evaluate the potential value space of a group, so as to make targeted adjustments to the product structure, business strategy and customer guidance. Therefore, highlight the research and development and display of this type of products, and carry out relevant theme design in the overall matching display of furniture, so as to attract the attention and purchase of the target population.
There is no doubt that the application effect of big data in the commercial market has been highlighted. In various industries with fierce competition, who can seize the advantages brought by big data will have more opportunities to lead the future of the industry.
Real time performance of user portrait
At present, big data applications are popular. For example, the recommendation system is limited by technology at the beginning of practice. It may take one minute, one hour or even longer to recommend users, which is far from meeting the needs. We need to complete the data processing faster rather than offline batch processing.
Now enterprises have higher and higher requirements for real-time data, and are no longer satisfied with the T+1 method. In some scenarios, it is impossible to feed back the results every one day. Especially in the fields of recommendation and risk control, real-time data response at the level of hours, minutes and even seconds is required. Moreover, this second level response is not only a simple data stream, but also the result of complex aggregation analysis, which is the same as offline calculation. In fact, it is very difficult.
Fortunately, the rise of real-time computing frameworks is enough for us to solve these problems. In recent years, the frameworks and technologies of Flink, Kafka and other real-time computing technologies have become more and more stable, which is enough for us to support these use scenarios.
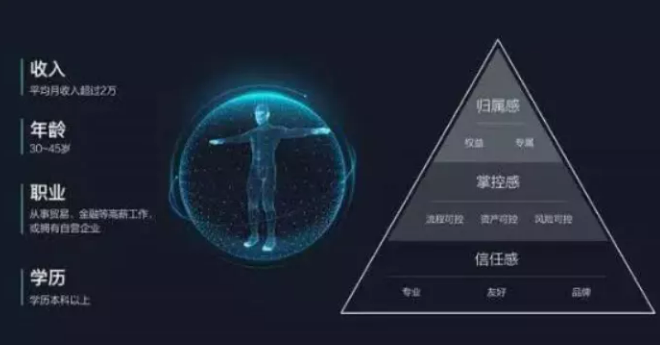
In the construction of real-time user portrait, through the continuous iterative calculation of real-time data, the overall picture of user portrait is gradually improved, which is also in line with the essence of data transmission. In the overall architecture, the special role of offline computing is weakened, only reserved for archiving and historical query, and more data is output through real-time computing, Finally achieve the purpose of user portrait.
In the process of real-time computing, it is necessary to aggregate data in real time, and complex tags also need real-time machine learning, which is very difficult, but it is of great significance to the real-time performance of portraits.

2, User portrait system architecture
In the previous article, we already know the great significance of user portrait for enterprises. Of course, it is also very difficult in real time. So what are the difficulties and key issues to be considered in the system architecture of user portrait?
Challenge
Challenge (I) - big data
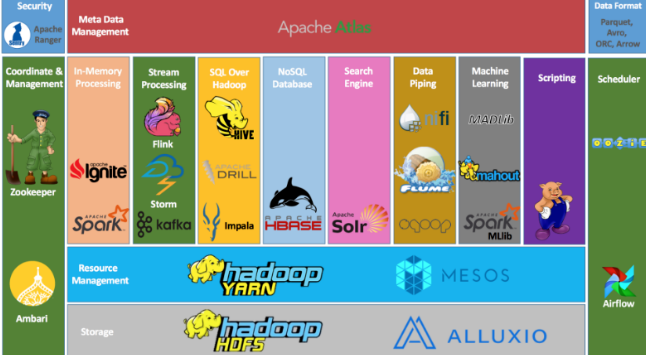
With the rise of the Internet, the rise of smart phones and various wearable devices brought by the Internet of things, the amount of data we can obtain from each user is very huge, and the number of users itself is huge. We are facing terabyte and petabyte data, so we must have a set of high availability that can support a large amount of data, High scalability system architecture to support the implementation of user portrait analysis. There is no doubt that the arrival of the era of big data makes all this possible. In recent years, big data technology represented by Hadoop has mushroomed and developed rapidly. Every once in a while, a new technology will be born to drive the business forward, which makes it possible for us to make simple statistics, complex analysis and machine learning of user portraits. Therefore, the overall user portrait system must be based on the big data architecture.
Challenge (II) - real time
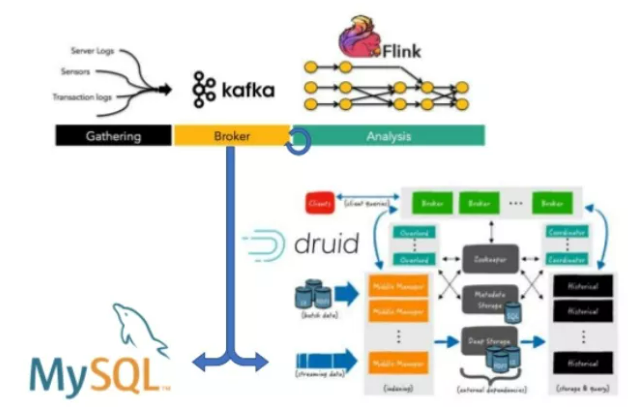
In the early days of the rise of Hadoop, most of the calculations were completed through batch processing, that is, the T+1 processing mode. You have to wait one day to know the results of the previous day. However, in the field of user portrait, we need more and more real-time consideration. We need to get the results of various dimensions at the first time. In the early stage of real-time computing, Storm is the only one, and Storm does not have good support for time window, watermark and trigger, and it will pay a very high performance price to ensure data consistency. However, the emergence of real-time streaming computing frameworks such as Kafka and Flink has changed all this. Data consistency, event time window, watermark and trigger have become very easy to implement. The real-time OLAP framework Druid makes interactive real-time query possible. These high-performance real-time frameworks have become the most powerful support for us to establish real-time user portraits.
Challenge (III) -- combination with digital warehouse
-
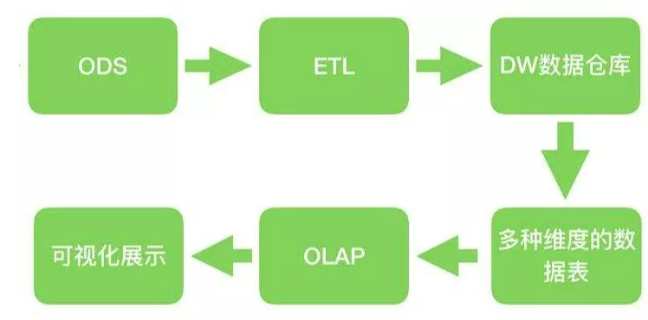
The concept of data warehouse has a long history. After we get a large amount of data, how to turn the data into what we want requires ETL, that is, the process of extract ing, transforming and load ing the data, transforming the data into what we want and storing it on the target. There is no doubt that hive is the best choice for offline data warehouse, and the new engine tez used by hive also has very good query performance, and the latest version of Flink also supports hive, with very good performance. However, in the real-time user portrait architecture, hive exists as a day-to-day archive warehouse, as the final storage place for the formation of historical data, and also provides the ability of historical data query. Druid, as a real-time data warehouse with good performance, will jointly provide query and analysis support for the data warehouse. Druid and Flink cooperate to jointly provide real-time processing results. Real time computing is no longer just a part of real-time data access, but a real girder.
Therefore, the difference between the two only lies in the data processing process. Real time streaming processing is the repeated processing of one stream to form one stream table after another, while other concepts of data warehouse are basically the same.
The basic concept of data warehouse is as follows:
-
- Extract, data extraction, is to read the data from the data source.
- Transform, data conversion, converts the original data into the desired format and dimension. If it is used in the scenario of data warehouse, transform also includes data cleaning to clean noise data.
- Load data loading, which loads the processed data to the target, such as data warehouse.
- DB is the existing data source (also known as the metadata of each system). It can be mysql, SQLserver, file log, etc. it generally exists in the existing business system to provide data source for data warehouse.
- ETL is the abbreviation of extract transform load, which is used to describe several processes of data migration from source to target:
- ODS(Operational Data Store) operational data is a transition from database to data warehouse. The data structure of ODS is generally consistent with the data source, which is convenient to reduce the complexity of ETL, and the data cycle of ODS is generally short. ODS data will eventually flow into DW
- DW (Data Warehouse) is the destination of data. All the data coming from ODS are kept here and stored for a long time, and these data will not be modified.
- DM(Data Mart) data mart is a part of data independent from the data warehouse for specific application purpose or application scope, which can also be called Department data or subject data. Application oriented.
-
In the whole data processing process, we also need automated scheduling tasks to avoid our repeated work and realize the automatic operation of the system. Airflow is a very good scheduling tool. Compared with the old Azkaban and Oozie, Python based workflow DAG ensures that it can be easily maintained, versioned and tested, Of course, the final services provided are not only visual display, but also the provision of real-time data, and finally form the real-time service of user portrait and product.
-
So far, we have very good solutions to the problems we face. Next, we design the overall architecture of our system, and analyze the technologies we need to master and the main work we need to do.
-
architecture design
-
According to the above analysis and the functions we want to achieve, we will rely on Hive and druid to establish our data warehouse, use Kafka for data access, and use Flink as our stream processing engine. For tag metadata management, we still rely on Mysql for tag management, and use Airflow as our scheduling task framework, And finally output the results to Mysql and Hbase. For the front-end management of tags, visualization and other functions depend on springboot + Vue JS, and the visual query functions of Hive and Druid are integrated into our system with powerful Superset. The final system architecture is designed as follows:
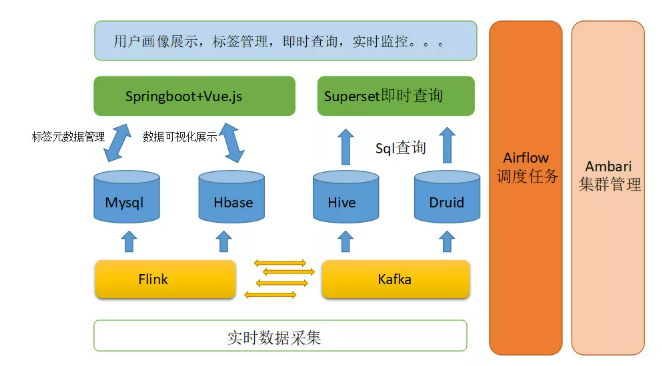
Compared with the traditional technology architecture, the real-time technology architecture will greatly rely on Flink's real-time computing power. Of course, most of the aggregation operations can still be done through Sql, but complex machine learning operations need to be implemented by coding. The storage details of tags are still in Mysql. Hive and Druid jointly establish a data warehouse. Compared with the original technical architecture, we just changed the computing engine from spark to Flink. Of course, we can choose Spark's structured streaming to meet our needs. The choice between the two is still analyzed according to the specific situation.
The traditional architecture is as follows:
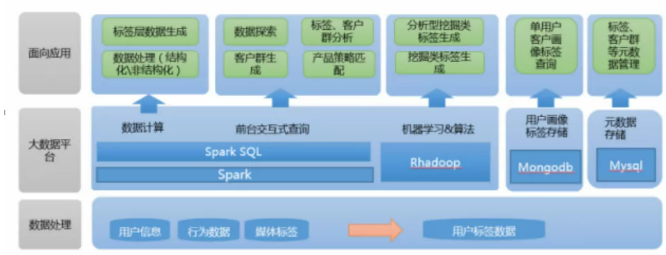
In this way, we form a strong support for data storage, computing, services and control. Can we start building big data clusters? In fact, it's not urgent. Before construction, it's very important to clarify the needs. There are different needs for different businesses, e-commerce, risk control and other industries, and there are different requirements for user portraits. So how to clarify these needs? The most important thing is to define the label system of user portraits, which involves technicians and products, The result of joint discussion between operation and other posts is also the core of user portrait.
3, Label system
What is a label?
The core of user portraits is to "tag" users. Each tag is usually a man-made feature identification, which describes a class of people with highly refined features, such as age, gender, interest preferences, etc. different tags can be combined with different user portraits through the integration of structured data system.
Sorting out the label system is the most basic and core work in the process of realizing user portrait. Subsequent modeling and data warehouse construction will depend on the label system.
Why do we need to sort out the label system? Because different enterprises have different strategic purposes for user portraits. Advertising companies do user portraits to serve accurate advertising, e-commerce do user portraits to buy more goods for users, and content platforms do user portraits to recommend content that users are more interested in, improve traffic and realize it, The purpose of user portrait in the financial industry is to find target customers and control risks at the same time.
Therefore, the first step is to analyze the purpose of our user portrait in combination with our industry and business. This is actually strategy. We should guide our final direction through strategy.
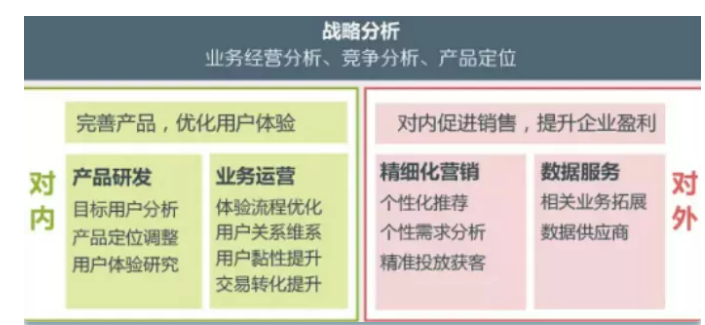
For e-commerce enterprises, the two most important issues are:
Existing users - who are my existing users? Why buy my products? What are their preferences? Which users have the highest value?
Leads - where are my leads? What do they like? Which channels can find them? What is the cost of getting customers?
For financial enterprises, another article should be added:
User risk - how about the revenue capacity of users? Have they ever overdue loans or credit cards? Is there a problem with their credit investigation?
The purpose of our user portrait is to finally solve these problems according to our designated strategic direction.
In the process of sorting labels, we should also closely combine our data and can't imagine without the data. Of course, if it is the data we need, we may need to find ways to obtain these data. This is the problem of data collection, which will be discussed in depth later.
First show two common label systems, and then we will establish our label system step by step.
E-commerce label system
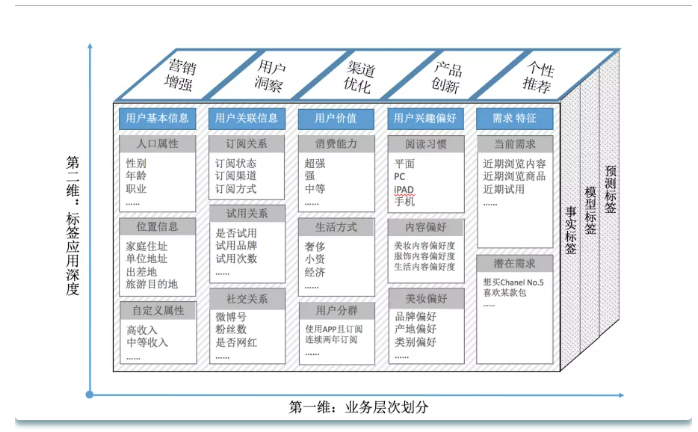
You can see the e-commerce label system, paying more attention to the user's attributes, behavior and other information. Then the data we need comes from the basic information that users can provide and the user's behavior information, which we can obtain through embedding points, and the user's order is also a very important label.
Financial label system
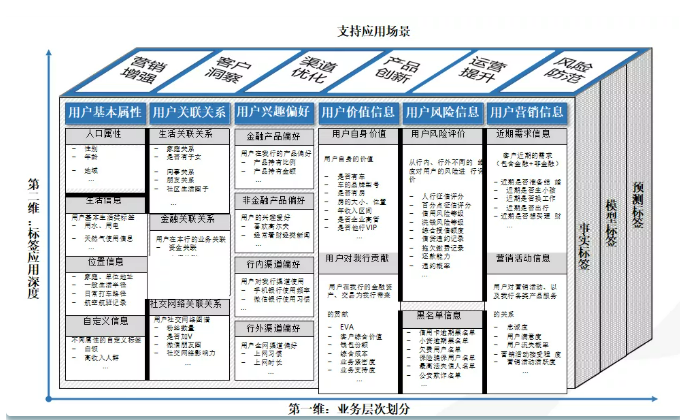
For the financial industry, the most obvious difference is the information that increases the user's value and user risk. These information can generally be provided when users apply for loans, and there is still a lot of information to be obtained through credit investigation.
In the end, no matter in e-commerce, finance or other fields, we can portrait users through data, finally establish a labeling system, affect our business and finally achieve strategic objectives.
Let's take a look at how to analyze and establish the overall label system step by step.
Dimensions and types of labels
When we create user labels, we must first clarify which dimension to create labels based on.
Generally, in addition to establishing the user label system based on the user ID, the corresponding label system is also established based on the device ID. this dimension is required when the user does not log in to the device. Of course, these two dimensions can also be associated.
The association between the two requires ID mapping algorithm, which is also a very complex algorithm. More often, we still use the user's unique ID to create a user portrait.
Labels are also divided into many types. Here, refer to the common classification methods,
From the perspective of user tagging methods, they are generally divided into three types: 1. Tags based on statistics; 2. Label based on rule class, 3. Label based on mining class. Let's introduce the differences between the three types of labels:
- Statistical Tags: these tags are the most basic and common tag types. For example, for a user, his gender, age, city, constellation, active duration in recent 7 days, active days in recent 7 days, active times in recent 7 days and other fields can be obtained from user registration data, user access and consumption data. Such labels form the basis of user portrait;
- Rule label: this type of label is generated based on user behavior and determined rules. For example, the definition of "active consumption" users on the platform is that the number of transactions in recent 30 days > = 2. In the actual development process, since the operators are more familiar with the business and the data personnel are more familiar with the structure, distribution and characteristics of the data, the rules of the rule label shall be determined by the operators and data personnel through consultation;
- Machine learning mining class label: this class label is generated through data mining and applied to predict and judge some attributes or behaviors of users. For example, judge whether a user is male or female according to his behavior habits, and judge his preference for a commodity according to his consumption habits. Such tags need to be generated by algorithm mining.
The type of label is a distinction between labels, which is convenient for us to understand which stage of data processing the label is generated, and it is also more convenient for us to manage.
Label classification
Labels need to be managed by classification. On the one hand, it makes labels more clear and conditional. On the other hand, it is also convenient for us to store and query labels, that is, manage labels.
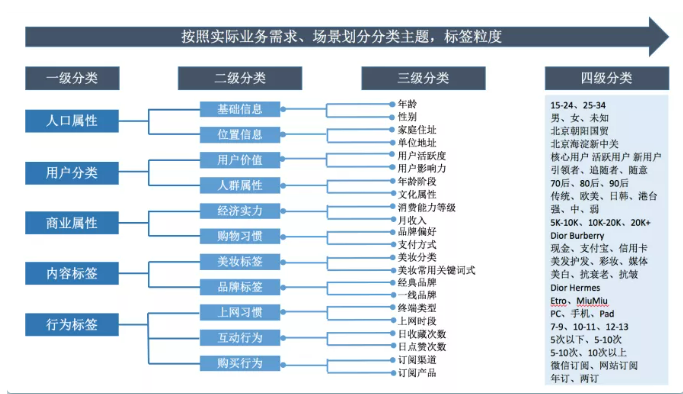
User portrait system and label classification comb labels from two different angles. User portrait system is biased towards strategy and application, and label classification is biased towards management and technology implementation.
The labels are divided into different levels and categories. First, it is convenient to manage thousands of labels and systematize scattered labels; Second, dimensions are not isolated, and labels are related to each other; Third, it can provide label subsets for label modeling.
When sorting out the subcategories of a category, follow the MECE principle as much as possible (independent and completely exhaustive). In particular, some user classifications should cover all users without crossing. For example, user activity is divided into core users, active users, new users, old users and lost users. User consumption ability is divided into super, strong, medium and weak. In this way, each user is divided into different groups according to the given rules.
Label naming
The naming of labels is also for us to manage labels uniformly and better identify what labels are.

This is a very good naming method, which is explained as follows:
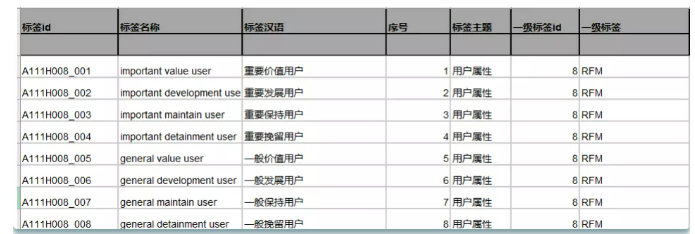
Tag topic: used to describe the type of tag, such as user attribute, user behavior, user consumption, risk control and other types. Each tag topic can be represented by letters A, B, C, D and so on; tag type: the tag type can be divided into two types: type and statistical type. The sub type is used to describe the type of user, such as male or female, whether he is A member, whether he has lost, etc. the statistical label is used to describe and count the number of behaviors of the user, such as historical purchase amount, coupon usage times, login times in recent 30 days, etc, Such labels need to correspond to the weight times of A user's corresponding behavior; development mode: the development mode can be divided into statistical development and algorithm development. Statistical development can be directly modeled and processed from each topic table in the data warehouse, and algorithmic development needs to process the data by machine learning algorithm to get the corresponding label; mutually exclusive labels: whether the relationship between labels is mutually exclusive under the same level category (such as level 1 labels and level 2 labels). Labels can be divided into mutually exclusive relationships and non mutually exclusive relationships. For example, male and female tags are mutually exclusive, the same user is either labeled male or female, and high activity, medium activity and low activity tags are also mutually exclusive; user dimension: used to describe whether the tag is printed on the user's unique ID (userid) or on the device used by the user (cookie ID). The userid and cookieid dimensions can be identified with letters such as U and C respectively.
Example of final label:
For the tag of whether the user is male or female, the tag subject is user attribute, the tag type belongs to sub type, the development method is statistical, it is mutually exclusive, and the user dimension is userid. In this way, male users are labeled "A111U001_001" and female users are labeled "A111U001002", in which "A111U" is the naming method described above, "001" is the id of the first level label, and other first level labels of the user attribute dimension can be named by "002", "003" and so on, "001" and "002" after "" are the label details under this level 1 label. If it is divided into high, medium and low active users, the details under the corresponding level 1 label can be divided into "001", "002" and "003".
Label storage and management
Hive and Druid data warehouse store label calculation result set
Because the data is very large, the results of running labels must be completed through hive and druid warehouse engines.
In the process of data warehouse modeling, it is mainly the development of fact table and dimension table.
The fact table is developed according to the business and describes the business process. It can be understood as the business fact after ETL sorting of the original data.
The dimension table is the user dimension we finally formed. The dimension table changes in real time and gradually establishes the user's portrait.
For example, the user dimension label:
First, according to the user index system discussed earlier, we will establish relevant intermediate tables for users according to population, behavior, consumption, etc., and pay attention to the naming of the tables.
Similarly, others are stored in this way, and the calculation of this attribute class is easy to filter out.
Then, we query the user's tags and summarize them to the user:
End user labels are formed
Of course, for complex rule and algorithm labels, we need to do more complex calculations when calculating the intermediate table. We need to solve these complex calculations in Flink. We will discuss them in detail in future development. This part first designs the corresponding table structure according to the label system.
Mysql store tag metadata
Mysql is faster for reading and writing small amounts of data, and is more suitable for our label definition and management. We can also develop the tag management page at the front end.
The fields stored in mysql provide editing and other functions on the page. In the process of developing tags, we can control the use of tags.
In this way, our label system has been established according to the actual business situation. After clarifying the label system, we will also clarify our business support. From the next chapter, we will officially start to build big data clusters, access data and carry out label development.
4, User portrait big data environment construction
In this chapter, we begin to formally build a big data environment, with the goal of building a stable big data environment that can be operated and monitored. We will use Ambari to build the underlying Hadoop environment, and use the native way to build Flink, Druid, Superset and other real-time computing environments. Use the big data construction tool and native installation to jointly complete the installation of big data environment.
Ambari builds the underlying big data environment
Apache Ambari is a Web-based tool that supports provisioning, management, and monitoring of Apache Hadoop clusters. Ambari already supports most Hadoop components, including HDFS, MapReduce, Hive, Pig, Hbase, Zookeeper, Sqoop and Hcatalog.
Apache Ambari supports centralized management of HDFS, MapReduce, Hive, Pig, Hbase, zookeeper, Sqoop and Hcatalog. It is also one of the top hadoop management tools.
The version of Ambari used in this article is 2.7, and the supported components are more and more abundant.

There are many release versions of Hadoop, including Huawei release, Intel release, Cloudera release (CDH), MapR version, HortonWorks version, etc. All distributions are derived from Apache Hadoop. The reason for these versions is determined by the open source agreement of Apache Hadoop: anyone can modify them and publish and sell them as open source or commercial products.
Charging version: charging versions are generally composed of new features. Most domestic companies charge for the version issued, such as Intel version, Huawei version, etc.
Free version: there are three free versions (all foreign manufacturers). Cloudera's Distribution Including Apache Hadoop is referred to as "CDH" for short, and the Hadoop Hortonworks Data Platform of Apache foundation is referred to as "HDP" for short. It represents the domestic utilization rate in order. Although CDH and HDP are paid versions, they are open source and only charge service fees. Strictly speaking, they are not paid versions.
Ambari is installed based on HDP, but they have different correspondence between different versions.
That is, the latest version is HDP 3.1.5, and HDP contains the following basic components of big data:
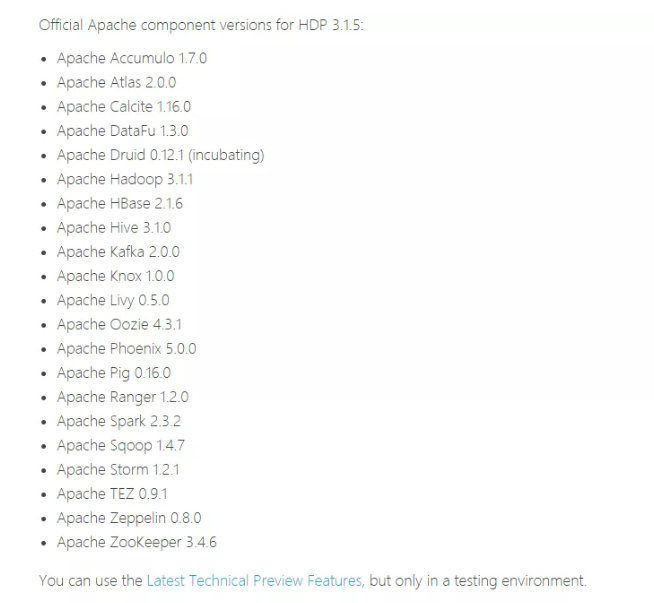
It has been very rich. Let's start the installation of Ambari.
preparation in advance
The preliminary preparation is divided into four parts
Host, database, browser, JDK
host
Please prepare the host for installing Ambari first. The development environment can be three. Other environments are determined according to the size of the company's machines.
Suppose the three machines in the development environment are:
192.168.12.101 master 192.168.12.102 slave1 192.168.12.103 slave2
The minimum requirements for the host are as follows:
Software requirements
On each host:
- yum and rpm (RHEL / CentOS / Oracle / Amazon Linux)
- zypper and php_curl(SLES)
- apt (Debian / Ubuntu)
- scp, curl, unzip, tar, wget and gcc*
- OpenSSL (v1.01, build 16 or later)
- Python (with Python devel *)
Ambari host shall have at least 1 GB RAM and 500 MB Free space.
To check the available memory on any host, run:
free -m
Local warehouse
If the network speed is not fast enough, we can download the package and establish a local warehouse. The network speed is fast enough to ignore this step.
Download the installation package first
Install httpd service
yum install yum-utils createrepo
[root@master ~]# yum -y install httpd
[root@master ~]# service httpd restart
Redirecting to /bin/systemctl restart httpd.service
[root@master ~]# chkconfig httpd on
Then establish a local yum source
mkdir -p /var/www/html/
Unzip the package you just downloaded into this directory.
Then access through the browser is successful
createrepo  ./
Make a local source and modify the source address in the file
vi  ambari.repo
vi hdp.repo


#VERSION_NUMBER=2.7.5.0-72
[ambari-2.7.5.0]
#json.url = http://public-repo-1.hortonworks.com/HDP/hdp_urlinfo.json
name=ambari Version - ambari-2.7.5.0
baseurl=https://username:password@archive.cloudera.com/p/ambari/centos7/2.x/updates/2.7.5.0
gpgcheck=1
gpgkey=https://username:password@archive.cloudera.com/p/ambari/centos7/2.x/updates/2.7.5.0/RPM-GPG-KEY/RPM-GPG-KEY-Jenkins
enabled=1
priority=1

[root@master ambari]# yum clean all
[root@master ambari]# yum makecache
[root@master ambari]# yum repolist
Software preparation
In order to facilitate future management, we need to configure the machine
install JDK
 Download address: http://www.oracle.com/technetwork/java/javase/downloads/jdk8-downloads-2133151.html

rpm -ivh jdk-8u161-linux-x64.rpm
java -version
 adopt vi /etc/hostname Modify the machine name here mainly to find the corresponding server by name

  Modify each node to the corresponding name, which is master,slave1.slave2
  vi /etc/hosts
192.168.12.101 master
192.168.12.102 slave1
192.168.12.103 slave2

 vi /etc/sysconfig/network
 NETWORKING=yes
HOSTNAME=master(Other nodes are also modified accordingly)
Turn off firewall
[root@master~]#systemctl disable firewalld
[root@master~]#systemctl stop firewalld
ssh No secret
ssh-keygen

ssh-copy-id -i ~/.ssh/id_rsa.pub remote-host
Different environments have different problems. You can refer to the official website manual for corresponding installation.
Install ambari server
ambariserver will eventually lead us to complete the installation of big data clusters
yum install ambari-server

Installing : postgresql-libs-9.2.18-1.el7.x86_64         1/4
Installing : postgresql-9.2.18-1.el7.x86_64              2/4
Installing : postgresql-server-9.2.18-1.el7.x86_64       3/4
Installing : ambari-server-2.7.5.0-124.x86_64           4/4
Verifying  : ambari-server-2.7.5.0-124.x86_64           1/4
Verifying  : postgresql-9.2.18-1.el7.x86_64              2/4
Verifying  : postgresql-server-9.2.18-1.el7.x86_64       3/4
Verifying  : postgresql-libs-9.2.18-1.el7.x86_64         4/4

Installed:
  ambari-server.x86_64 0:2.7.5.0-72
Dependency Installed:
 postgresql.x86_64 0:9.2.18-1.el7
 postgresql-libs.x86_64 0:9.2.18-1.el7
 postgresql-server.x86_64 0:9.2.18-1.el7
Complete!
Startup and setup
set up
ambari-server setup
It is not recommended to directly use the embedded postgresql, because other services also use mysql
Installation configuration MySql

yum install -y wget

wget -i -c http://dev.mysql.com/get/mysql57-community-release-el7-10.noarch.rpm

rpm -ivh mysql57-community-release-el7-10.noarch.rpm

yum -y install mysql-community-server

systemctl enable mysqld

systemctl start mysqld.service

systemctl status mysqld.service

grep "password" /var/log/mysqld.log

mysql -uroot -p

set global validate_password_policy=0;

set global validate_password_length=1;

set global validate_password_special_char_count=0;

set global validate_password_mixed_case_count=0;

set global validate_password_number_count=0;

select @@validate_password_number_count,@@validate_password_mixed_case_count,@@validate_password_number_count,@@validate_password_length;


ALTER USER 'root'@'localhost' IDENTIFIED BY 'password';

grant all privileges on . to 'root'@'%' identified by 'password' with grant option;

flush privileges;

exit
yum -y remove mysql57-community-release-el7-10.noarch

download mysql Drive, put it on three sets

/opt/ambari/mysql-connector-java-5.1.48.jar


Initialize database

mysql -uroot -p
create database ambari;

use ambari

source /var/lib/ambari-server/resources/Ambari-DDL-MySQL-CREATE.sql


CREATE USER 'ambari'@'localhost' IDENTIFIED BY 'bigdata';

CREATE USER 'ambari'@'%' IDENTIFIED BY 'bigdata';

GRANT ALL PRIVILEGES ON ambari.* TO 'ambari'@'localhost';

GRANT ALL PRIVILEGES ON ambari.* TO 'ambari'@'%';

FLUSH PRIVILEGES;
Complete the configuration of ambari
[root@localhost download]# ambari-server setup
Using python  /usr/bin/python
Setup ambari-server
Checking SELinux...
SELinux status is 'enabled'
SELinux mode is 'permissive'
WARNING: SELinux is set to 'permissive' mode and temporarily disabled.
OK to continue [y/n] (y)? y
Customize user account for ambari-server daemon [y/n] (n)? y
Enter user account for ambari-server daemon (root):
Adjusting ambari-server permissions and ownership...
Checking firewall status...
Checking JDK...
[1] Oracle JDK 1.8 + Java Cryptography Extension (JCE) Policy Files 8
[2] Custom JDK
==============================================================================
Enter choice (1): 2
WARNING: JDK must be installed on all hosts and JAVA_HOME must be valid on all hosts.
WARNING: JCE Policy files are required for configuring Kerberos security. If you plan to use Kerberos,please make sure JCE Unlimited Strength Jurisdiction Policy Files are valid on all hosts.
Path to JAVA_HOME: /usr/lib/jvm/java-1.8.0-openjdk-1.8.0.242.b08-0.el7_7.x86_64/jre
Validating JDK on Ambari Server...done.
Check JDK version for Ambari Server...
JDK version found: 8
Minimum JDK version is 8 for Ambari. Skipping to setup different JDK for Ambari Server.
Checking GPL software agreement...
GPL License for LZO: https://www.gnu.org/licenses/old-licenses/gpl-2.0.en.html
Enable Ambari Server to download and install GPL Licensed LZO packages [y/n] (n)? y
Completing setup...
Configuring database...
Enter advanced database configuration [y/n] (n)? y
Configuring database...
==============================================================================
Choose one of the following options:
[1] - PostgreSQL (Embedded)
[2] - Oracle
[3] - MySQL / MariaDB
[4] - PostgreSQL
[5] - Microsoft SQL Server (Tech Preview)
[6] - SQL Anywhere
[7] - BDB
==============================================================================
Enter choice (1): 3
Hostname (localhost):
Port (3306):
Database name (ambari):
Username (ambari):
Enter Database Password (bigdata):
Configuring ambari database...
Enter full path to custom jdbc driver: /opt/ambari/mysql-connector-java-5.1.48.jar
Copying /opt/ambari/mysql-connector-java-5.1.48.jar to /usr/share/java
Configuring remote database connection properties...
WARNING: Before starting Ambari Server, you must run the following DDL directly from the database shell to create the schema: /var/lib/ambari-server/resources/Ambari-DDL-MySQL-CREATE.sql
Proceed with configuring remote database connection properties [y/n] (y)? y
Extracting system views...
.....
Ambari repo file contains latest json url http://public-repo-1.hortonworks.com/HDP/hdp_urlinfo.json, updating stacks repoinfos with it...
Adjusting ambari-server permissions and ownership...
Ambari Server 'setup' completed successfully.
Then you can start
ambari-server start

ambari-server status

ambari-server stop
Visit the following address
http://<your.ambari.server>:8080
Cluster installation
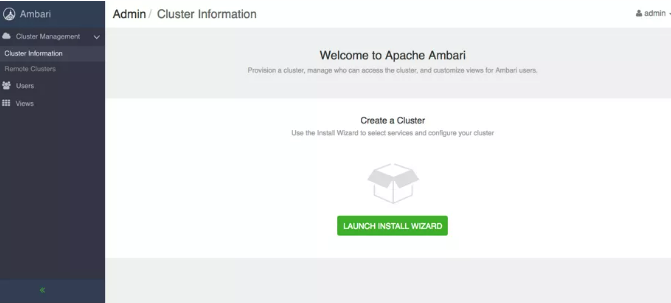
Next, install the cluster, including naming, ssh password free, selecting the version, and planning the cluster
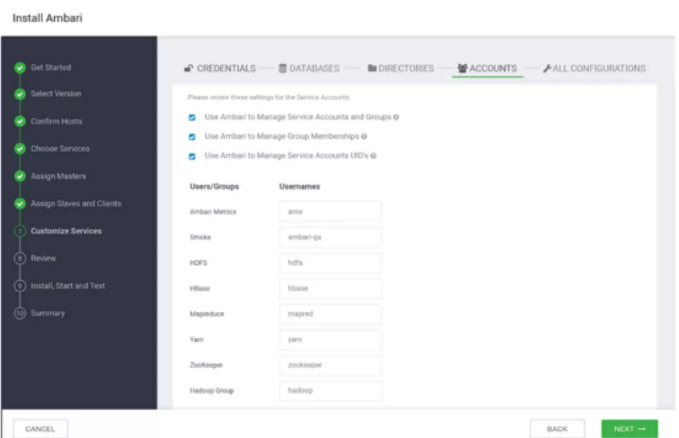
After completing the cluster installation, we can manage our cluster on the page.
Please reply to ambari in the background of "real-time streaming computing" for detailed official website installation document pdf
Construction of real-time computing environment
Because ambari supports a lower druid version, and currently does not support flick, real-time computing components other than kafka need to be installed manually to facilitate future upgrades.
Installing flink on Linux systems
Cluster installation
Cluster installation is divided into the following steps:
1. Copy the extracted flink directory on each machine.
2. Select one as the master node, and then modify all machines conf/flink-conf.yaml
jobmanager.rpc.address = master host name
3. Modify conf / slave and write all work nodes to
work01
work02
4. Start the cluster on the master
bin/start-cluster.sh
Installed in Hadoop
We can choose to let Flink run on the Yan cluster.
Download the package for Flink for Hadoop
Guarantee HADOOP_HOME has been set correctly
Start bin / yarn session sh
Run the flink sample program
Batch example:
Batch examples program submitted to flex:
bin/flink run examples/batch/WordCount.jar
This is a batch example program under examples provided by flex to count the number of words.
$ bin/flink run examples/batch/WordCount.jar
Starting execution of program
Executing WordCount example with default input data set.
Use --input to specify file input.
Printing result to stdout. Use --output to specify output path.
(a,5)
(action,1)
(after,1)
(against,1)
(all,2)
(and,12)
(arms,1)
(arrows,1)
(awry,1)
(ay,1)
Druid cluster deployment
Deployment recommendations
The allocation adopted for cluster deployment is as follows:
- The master node deploys the Coordinator and Overlord processes
- Two data nodes run the Historical and MiddleManager processes
- A query node deploys Broker and Router processes
In the future, we can add more master nodes and query nodes
The master node recommends 8vCPU 32GB memory
The configuration file is located at
conf/druid/cluster/master
Data node recommendations
16 vCPU 122GB memory 2 * 1.9TB SSD
The configuration file is located at
conf/druid/cluster/data
Query server recommended 8vCPU 32GB memory
The configuration file is located at
conf/druid/cluster/query
Start deployment
Download the 0.17.0 release
decompression
tar -xzf apache-druid-0.17.0-bin.tar.gz
cd apache-druid-0.17.0
The main configuration files for cluster mode are located in:
conf/druid/cluster
Configure metadata store
conf/druid/cluster/_common/common.runtime.properties
replace
druid.metadata.storage.connector.connectURI
druid.metadata.storage.connector.host
For example, configure mysql as a metadata store
Configure access permissions in mysql:
-- create a druid database, make sure to use utf8mb4 as encoding
CREATE DATABASE druid DEFAULT CHARACTER SET utf8mb4;

-- create a druid user
CREATE USER 'druid'@'localhost' IDENTIFIED BY 'druid';

-- grant the user all the permissions on the database we just created
GRANT ALL PRIVILEGES ON druid.* TO 'druid'@'localhost';
Configure in druid
druid.extensions.loadList=["mysql-metadata-storage"]
druid.metadata.storage.type=mysql
druid.metadata.storage.connector.connectURI=jdbc:mysql://<host>/druid
druid.metadata.storage.connector.user=druid
druid.metadata.storage.connector.password=diurd
Configure deep storage
Configure the data store as S3 or HDFS
For example, configure HDFS and modify
conf/druid/cluster/_common/common.runtime.properties
druid.extensions.loadList=["druid-hdfs-storage"]

#druid.storage.type=local
#druid.storage.storageDirectory=var/druid/segments

druid.storage.type=hdfs
druid.storage.storageDirectory=/druid/segments

#druid.indexer.logs.type=file
#druid.indexer.logs.directory=var/druid/indexing-logs

druid.indexer.logs.type=hdfs
druid.indexer.logs.directory=/druid/indexing-logs
Put Hadoop configuration XML (core-site.xml, hdfs-site.xml, yen-site.xml, mapred-site.xml) in the drop
conf/druid/cluster/_common/
Configure zookeeper connection
Or modify
conf/druid/cluster/_common/
Lower
druid.zk.service.host
Just the zk server address
Start cluster
Pay attention to opening port restrictions before startup
Master node:
derby 1527
zk 2181
Coordinator 8081
Overlord 8090
Data node:
Historical 8083
Middle Manager 8091, 8100–8199
Query node:
Broker 8082
Router 8088
Remember to copy the druid just configured to each node
Start master node
Since we use external zk, we use no zk to start
bin/start-cluster-master-no-zk-server
Start data server
bin/start-cluster-data-server
Start query server
bin/start-cluster-query-server
In this way, the cluster will start successfully!
So far, our big data environment has been basically built. In the next chapter, we will access data and start label development.
5, Label development
Data access
Data can be accessed by writing data to Kafka in real time, either directly or through the real-time access methods of oracle and mysql, such as oracle's ogg and mysql's binlog
ogg
Golden Gate (OGG) provides real-time capture, transformation and delivery of transaction data in heterogeneous environment.
Through OGG, the data in oracle can be written to Kafka in real time.
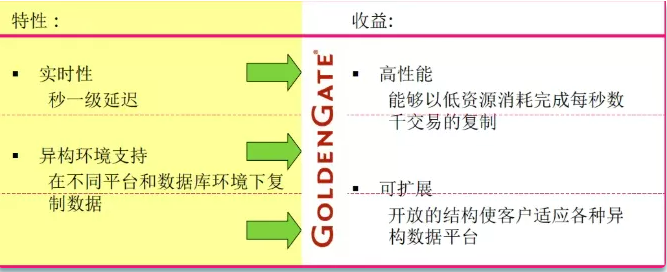
Little impact on the production system: read the transaction log in real time to realize real-time replication of large transaction volume data with low resource occupation
Copy by transaction to ensure transaction consistency: only the submitted data is synchronized
High performance
- Intelligent transaction restructuring and operational consolidation
- Access using database local interface
- Parallel processing architecture
binlog
The binary log binlog of MySQL can be said to be the most important log of MySQL. It records all DDL and DML statements (except data query statements select, show, etc.) in the form of events, as well as the time consumed by the execution of statements. The binary log of MySQL is transaction safe. The main purpose of binlog is replication and recovery.
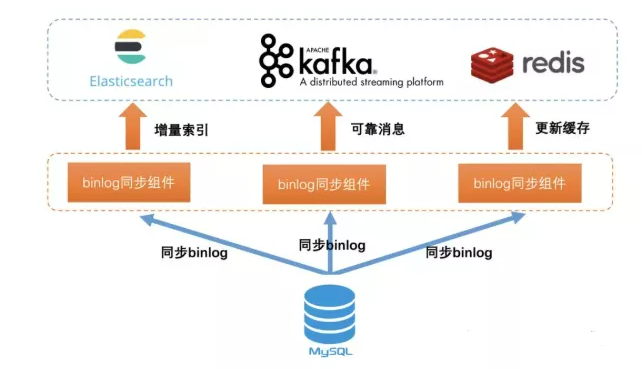
Through these means, the data can be synchronized to kafka, that is, our real-time system.
Flink accessing Kafka data
Apache Kafka Connector can facilitate access to kafka data.
rely on
<dependency> <groupId>org.apache.flink</groupId> <artifactId>flink-connector-kafka_2.11</artifactId> <version>1.9.0</version></dependency>
Building FlinkKafkaConsumer
Mandatory:
1.topic name
2. Deserialization schema / kafkadeserialization schema for deserializing Kafka data
3. Configuration parameters: "bootstrap.servers" "group.id" (kafka0.8 also requires "zookeeper.connect")
val properties = new Properties()properties.setProperty("bootstrap.servers", "localhost:9092")// only required for Kafka 0.8properties.setProperty("zookeeper.connect", "localhost:2181")properties.setProperty("group.id", "test")stream = env .addSource(new FlinkKafkaConsumer[String]("topic", new SimpleStringSchema(), properties)) .print()
Timestamp and watermark
In many cases, the timestamp of the record (explicit or implicit) is embedded in the record itself. In addition, users may want to issue watermarks periodically or in an irregular manner.
We can define Timestamp Extractors / Watermark Emitters and pass them to consumers in the following ways
val env = StreamExecutionEnvironment.getExecutionEnvironment()val myConsumer = new FlinkKafkaConsumer[String](...)myConsumer.setStartFromEarliest() // start from the earliest record possiblemyConsumer. setStartFromLatest() // start from the latest recordmyConsumer. setStartFromTimestamp(...) // start from specified epoch timestamp (milliseconds)myConsumer. Setstartfromgroupoffsets() / / the default behavior / / specify the location / / Val specificstartoffsets = new Java util. HashMap[KafkaTopicPartition, java.lang.Long]()//specificStartOffsets. put(new KafkaTopicPartition("myTopic", 0), 23L)//myConsumer. setStartFromSpecificOffsets(specificStartOffsets)val stream = env. addSource(myConsumer)
Checkpoint
When Flink's checkpoints are enabled, Flink Kafka Consumer uses the records in the topic and periodically checks the status of all its Kafka offsets and other operations in a consistent manner. If the job fails, Flink will restore the streaming program to the state of the latest checkpoint and reuse Kafka's records from the offset stored in the checkpoint.
If checkpointing is disabled, Flink Kafka Consumer relies on the automatic periodic offset submission function of the internally used Kafka client.
If checkpointing is enabled, Flink Kafka Consumer commits the offset stored in the checkpoint state when the checkpoint completes.
val env = StreamExecutionEnvironment.getExecutionEnvironment()env.enableCheckpointing(5000) // checkpoint every 5000 msecs
Flink consumption Kafka complete code:
import org.apache.flink.api.common.serialization.SimpleStringSchema;
import org.apache.flink.streaming.api.datastream.DataStream;
import org.apache.flink.streaming.api.environment.StreamExecutionEnvironment;
import org.apache.flink.streaming.connectors.kafka.FlinkKafkaConsumer;
import java.util.Properties;
public class KafkaConsumer {
public static void main(String[] args) throws Exception {
final StreamExecutionEnvironment env = StreamExecutionEnvironment.getExecutionEnvironment();        Properties properties = new Properties();
properties.setProperty("bootstrap.servers", "localhost:9092");        properties.setProperty("group.id", "test");        //Build flinkkafkaconsumer flinkkafkaconsumer < string > myconsumer = new flinkkafkaconsumer < > ("topic", new simplestringschema(), properties)// Specify offset
myConsumer.setStartFromEarliest();
DataStream<String> stream = env
.addSource(myConsumer);
env.enableCheckpointing(5000);
stream.print();
env.execute("Flink Streaming Java API Skeleton");
}
In this way, the data has been connected to our system in real time and can be processed in Flink. How to calculate the tag? The calculation process of tags greatly depends on the ability of data warehouse, so with a good data warehouse, tags can be easily calculated.
Basic knowledge of data warehouse
Data warehouse is a collection of subject oriented, integrated, stable and time-varying data to support the process of management decision-making.
(1) The data in the subject oriented business database is mainly for transaction processing tasks, and each business system is separated from each other. The data in the data warehouse is organized according to a certain topic
(2) The data stored in the integrated data warehouse is extracted from the business database, but it is not a simple copy of the original data, but through extraction, cleaning and transformation (ETL). The business database records the daily account of each business process. These data are not suitable for analysis and processing. A series of calculations are required before entering the data warehouse, and some data not required for analysis and processing are discarded.
(3) Stable operation database system generally only stores short-term data, so its data is unstable and records the transient changes of data in the system. Most of the data in the data warehouse represents the data at a certain time in the past. It is mainly used for query and analysis. It is not often modified like the database in the business system. The general data warehouse is built, which is mainly used for accessing

OLTP online transaction processing OLTP is the main application of traditional relational database, which is mainly used for the processing of daily things and trading system. 1. The amount of data storage is relatively small. 2. The real-time requirements are high, and things need to be supported. 3. The data is generally stored in relational database (oracle or mysql)
OLAP online analytical processing OLAP is the main application of data warehouse, supporting complex analysis and query, focusing on decision support. 1. The real-time requirements are not very high, and ETL is generally T+1 data; 2. Large amount of data; 3. Mainly used for analysis and decision-making;
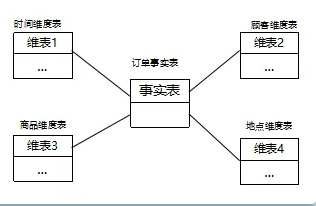
Star model is the most commonly used data warehouse design structure. It consists of a fact table and a group of dimension tables. Each dimension table has a dimension primary key. The core of the model is the fact table, which connects various dimension tables through the fact table. The objects in each dimension table are associated with the objects in another dimension table through the fact table, so as to establish the relationship between the objects in each dimension table. The dimension table is used to store dimension information, including dimension attributes and hierarchy; Fact table: a table used to record business facts and make corresponding indicator statistics. Compared with the dimension table, the fact table has a large number of records.
Snowflake model is an extension of star model. Each dimension table can connect multiple detailed category tables outward. In addition to the function of dimension table in star mode, it also connects the dimensions that describe the fact table in detail to further refine the granularity of viewing data. For example, the location dimension table contains attribute sets {location_id, street, city, province and country}. This pattern passes through the city of the location dimension table_ ID and city of city dimension table_ ID, such as {101, "No. 10 Jiefang Avenue", "Wuhan", "Hubei Province", "China"}, {255, "No. 85 Jiefang Avenue", "Wuhan", "Hubei Province", "China"}. Star model is the most basic model. A star model has multiple dimension tables and only one fact table. Based on the star pattern, multiple tables are used to describe a complex dimension, and the multi-layer structure of the dimension table is constructed to obtain the snowflake model.
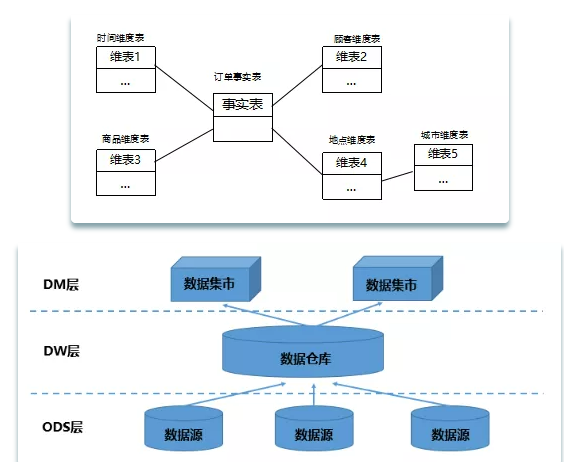
Clear data structure: each data layer has its scope, so that when using the table, we can more easily locate and understand dirty data cleaning: shield the abnormalities of the original data, shield the business impact: it is not necessary to change the business, so we need to re access the data. Data kinship tracking: in short, it can be understood as follows, What we finally present to the business is a business table that can be used directly, but it has many sources. If there is a problem with one source table, we hope to quickly and accurately locate the problem and understand its scope of harm. Reduce repeated development: standardizing data layering and developing some common middle tier data can greatly reduce repeated calculation. Simplify complex problems. A complex task is divided into multiple steps to complete. Each layer only deals with a single step, which is relatively simple and easy to understand. It is convenient to maintain the accuracy of the data. When there is a problem with the data, you don't need to repair all the data, just start from the steps with the problem.
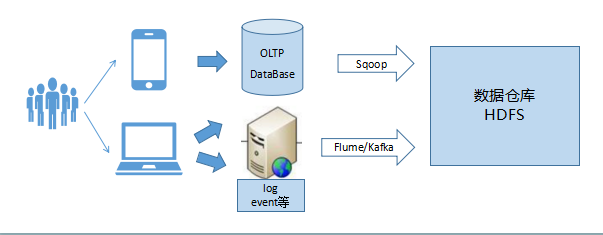
The data of the data warehouse is directly connected to OLAP or log data. The user portrait only makes further modeling and processing of the data warehouse data from the user's point of view. Therefore, the scheduling of data related to portrait labels depends on the execution of tasks related to the upstream data warehouse.
After knowing the data warehouse, we can calculate the label. After developing the tag logic, write the data into hive and druid to complete the real-time and offline tag development.
Flink integrates with Hive and Druid
Flink+Hive
Flink has supported Hive integration since 1.9. In Flink 1 Version 10 marks the completion of Blink integration. With the production level integration of Hive, Hive, as the absolute core of the data warehouse system, undertakes most of the offline data ETL calculation and data management. We look forward to Flink's perfect support for Hive in the future.
HiveCatalog will connect with an instance of Hive Metastore to provide metadata persistence. To interact with Hive using Flink, users need to configure a HiveCatalog and access the metadata in Hive through HiveCatalog.
Add dependency
To integrate with Hive, you need to add additional dependent jar packages in the Lib directory of Flink to make the integration work in the Table API program or SQL in the SQL Client. Alternatively, you can put these dependencies in a folder and add them to the classpath using the - C or - l options of the Table API program or SQL Client, respectively. This article uses the first method, which is to copy the jar package directly to $flow_ Home / lib directory. The Hive version used in this article is 2.3.4 (for different versions of Hive, you can select different jar packages by referring to the official website). A total of three jar packages are required, as follows:
- flink-connector-hive_2.11-1.10.0.jar
- flink-shaded-hadoop-2-uber-2.7.5-8.0.jar
- hive-exec-2.3.4.jar
Add Maven dependency
<!-- Flink Dependency -->
<dependency>
  <groupId>org.apache.flink</groupId>
  <artifactId>flink-connector-hive_2.11</artifactId>
  <version>1.10.0</version>
  <scope>provided</scope>
</dependency>

<dependency>
  <groupId>org.apache.flink</groupId>
  <artifactId>flink-table-api-java-bridge_2.11</artifactId>
  <version>1.10.0</version>
  <scope>provided</scope>
</dependency>

<!-- Hive Dependency -->
<dependency>
    <groupId>org.apache.hive</groupId>
    <artifactId>hive-exec</artifactId>
    <version>${hive.version}</version>
    <scope>provided</scope>
</dependency>
Example code
package com.flink.sql.hiveintegration;

import org.apache.flink.table.api.EnvironmentSettings;
import org.apache.flink.table.api.TableEnvironment;
import org.apache.flink.table.catalog.hive.HiveCatalog;


public class FlinkHiveIntegration {

    public static void main(String[] args) throws Exception {

        EnvironmentSettings settings = EnvironmentSettings
                .newInstance()
                .useBlinkPlanner() // Using the BlinkPlanner
                .inBatchMode() // Batch mode, the default is StreamingMode
                .build();

        //Using StreamingMode
       /* EnvironmentSettings settings = EnvironmentSettings
                .newInstance()
                .useBlinkPlanner() // Using the BlinkPlanner
                .inStreamingMode() // StreamingMode
                .build();*/

        TableEnvironment tableEnv = TableEnvironment.create(settings);

        String name = "myhive";      // Catalog name, which defines a unique name representation
        String defaultDatabase = "qfbap_ods";  // Default database name
        String hiveConfDir = "/opt/modules/apache-hive-2.3.4-bin/conf";  // hive-site.xml path
        String version = "2.3.4";       // Hive version number

        HiveCatalog hive = new HiveCatalog(name, defaultDatabase, hiveConfDir, version);

        tableEnv.registerCatalog("myhive", hive);
        tableEnv.useCatalog("myhive");
        // Create database. Creating hive table is not supported at present
        String createDbSql = "CREATE DATABASE IF NOT EXISTS myhive.test123";

        tableEnv.sqlUpdate(createDbSql);

    }
}
Flink+Druid
You can write the data analyzed by Flink back to kafka, and then access the data in druid, or write the data directly to druid. The following is an example code:
rely on
<?xml version="1.0" encoding="UTF-8"?>
<project xmlns:xsi="http://www.w3.org/2001/XMLSchema-instance" xmlns="http://maven.apache.org/POM/4.0.0"
         xsi:schemaLocation="http://maven.apache.org/POM/4.0.0 https://maven.apache.org/xsd/maven-4.0.0.xsd">
    <modelVersion>4.0.0</modelVersion>
    <parent>
        <groupId>org.springframework.boot</groupId>
        <artifactId>spring-boot-starter-parent</artifactId>
        <version>2.1.8.RELEASE</version>
        <relativePath/> <!-- lookup parent from repository -->
    </parent>
    <groupId>com.flinkdruid</groupId>
    <artifactId>FlinkDruid</artifactId>
    <version>0.0.1-SNAPSHOT</version>
    <name>FlinkDruid</name>
    <description>Flink Druid Connection</description>

    <properties>
        <java.version>1.8</java.version>
    </properties>

    <dependencies>

        <dependency>
            <groupId>org.springframework.boot</groupId>
            <artifactId>spring-boot-starter-web</artifactId>
        </dependency>

        <dependency>
            <groupId>org.springframework.boot</groupId>
            <artifactId>spring-boot-starter</artifactId>
        </dependency>

        <dependency>
            <groupId>org.apache.flink</groupId>
            <artifactId>flink-core</artifactId>
            <version>1.9.0</version>
        </dependency>

        <dependency>
            <groupId>org.apache.flink</groupId>
            <artifactId>flink-clients_2.12</artifactId>
            <version>1.9.0</version>
        </dependency>

    </dependencies>

    <build>
        <plugins>
            <plugin>
                <groupId>org.springframework.boot</groupId>
                <artifactId>spring-boot-maven-plugin</artifactId>
            </plugin>
        </plugins>
    </build>

</project>
Sample code
@SpringBootApplication
public class FlinkDruidApp {


    private static String url = "http://localhost:8200/v1/post/wikipedia";

    private static RestTemplate template;

    private static HttpHeaders headers;


    FlinkDruidApp() {

        template = new RestTemplate();
        headers = new HttpHeaders();
        headers.setAccept(Arrays.asList(MediaType.APPLICATION_JSON));
        headers.setContentType(MediaType.APPLICATION_JSON);

    }

    public static void main(String[] args) throws Exception {

        SpringApplication.run(FlinkDruidApp.class, args);

        // Creating Flink Execution Environment
        ExecutionEnvironment env = ExecutionEnvironment.getExecutionEnvironment();

        //Define data source
        DataSet<String> data = env.readTextFile("/wikiticker-2015-09-12-sampled.json");

        // Trasformation on the data
        data.map(x -> {

            return httpsPost(x).toString();
        }).print();


    }

    // http post method to post data in Druid
    private static ResponseEntity<String> httpsPost(String json) {

        HttpEntity<String> requestEntity =
                new HttpEntity<>(json, headers);
        ResponseEntity<String> response =
                template.exchange("http://localhost:8200/v1/post/wikipedia", HttpMethod.POST, requestEntity,
                        String.class);

        return response;
    }

    @Bean
    public RestTemplate restTemplate() {
        return new RestTemplate();
    }

}
The development of tags is cumbersome and needs continuous development and optimization, but how to provide good tags to produce real value? In the next chapter, we will introduce the commercialization of user portrait.
6, User portrait commercialization
After developing user tags, how to apply tags to practice is actually a very important problem. Only by doing a good job in product design can the label give full play to its real value. This paper will introduce the product process of user portrait.
1. Label display
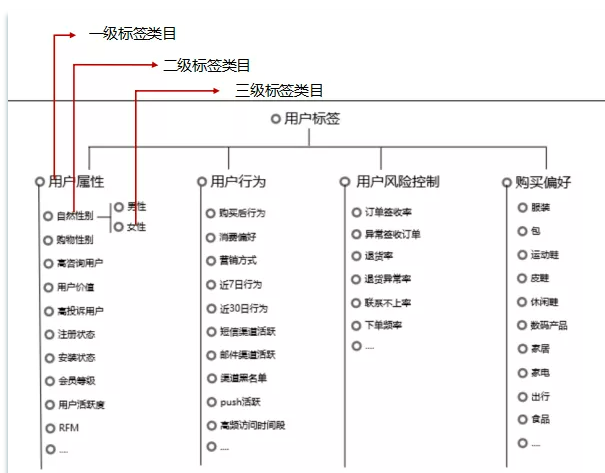
The first is the tag display function, which is mainly used by business personnel and R & D personnel to see the whole user tag system more intuitively.
Different tag systems have different levels, so the design of this page needs to be displayed in a tree structure for future expansion.
At the last level, such as natural gender, a statistics page can be designed. After entering the page, the corresponding data statistics can be displayed,
You can more intuitively see the value proportion in the label, and can also provide good suggestions for the business. In addition, you can display the specific description of the label to play a role of explanation. You can also display the daily fluctuation of the label and observe the change of the label.
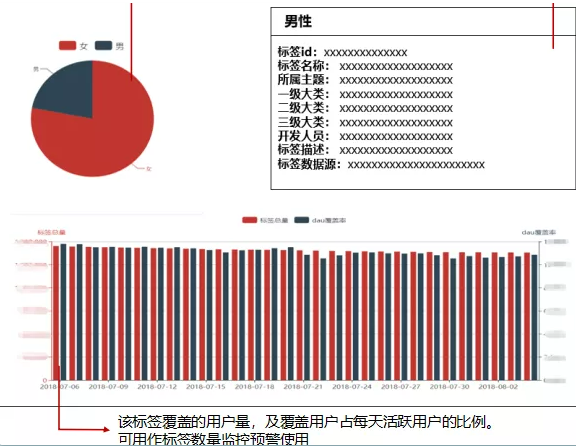
What is the data source of this part? As mentioned earlier, the metadata information of these tags is stored in mysql to facilitate our query.
Therefore, the tree view and label description information need to be obtained from mysql, while the chart data such as proportion are obtained from Hbase and Hive. Of course, they are also obtained directly through ES. However, the daily tag history fluctuation should be displayed in MySQL as a history after running the tag every day.
2. Tag query
This function can be provided to R & D personnel and business personnel.
The tag query function is actually the process of global portrait of users. We need to display the full amount of tag information of a user.
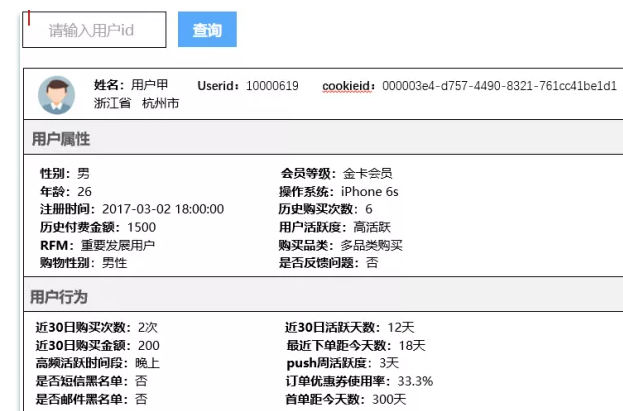
After entering the user id, you can view the user's attribute information, behavior information, risk control attribute and other information. Understand a specific user feature from multiple aspects.
These are the specific information of the tag. Since it is a search for a single id, obtaining it from hive will cause the problem of query speed. Therefore, we suggest to query it from Hbase or ES, so that the query efficiency and real-time performance can be greatly improved.
3. Label management
This function is provided for R & D personnel.
For labels, you can't make very big changes every time you add a label, which is very labor-intensive, so you must have the function of managing labels.
Here, the basic information, development method, developers, etc. of the label are defined. After completing the development of the label, you can directly enter the label on this page to complete the online work of the label, so that business personnel can use the label.
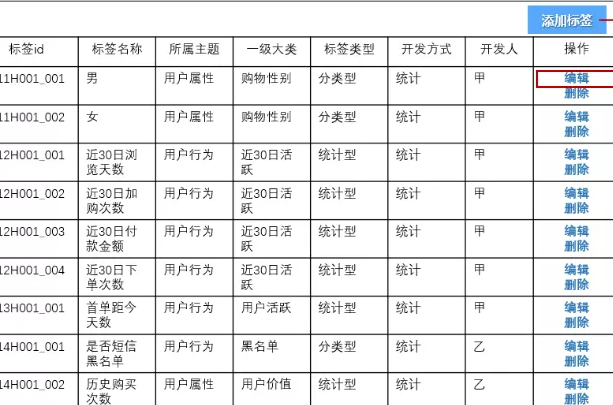
The page of adding and editing labels can provide drop-down boxes or input boxes to provide information entry functions.
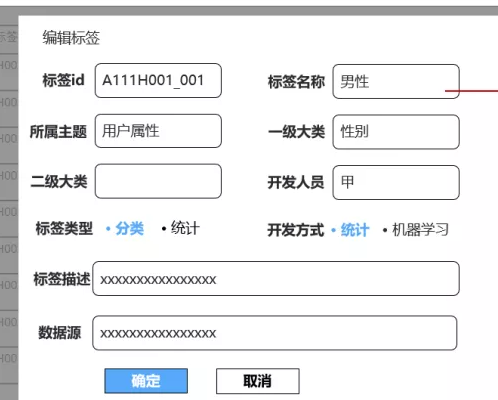
As mentioned earlier, the metadata information of these tags is saved in Mysql. Just add and modify them.
4. User clustering
As the core function of user portrait, user grouping function. It is not only the bridge between user portrait and business system, but also the value of user portrait.
This function is mainly used by business personnel.
This function allows users to customize the delineation of some personnel. The delineation rules are the conditional constraints on the label.
After the crowd is delineated, this part of the crowd can be provided with the interaction with the outbound call system, customer service system, advertising system and Push system of the business system, so as to achieve the purpose of real fine operation.
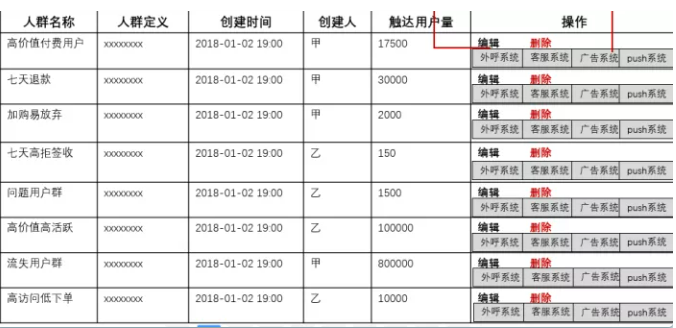
For the judgment of label rules, the recorded rules need to be stored in Mysql, and the rules need to be parsed into computable logic during crowd calculation. It is difficult to parse into Sql or other query languages, which is a great challenge for R & D.
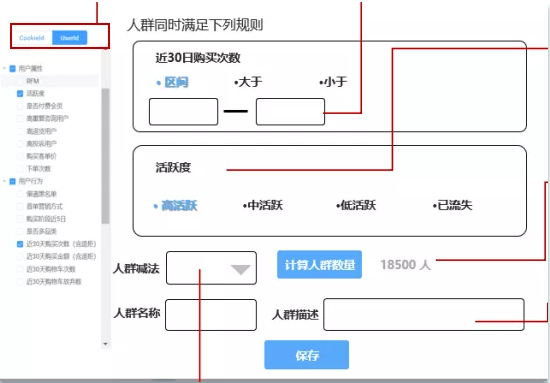
In this function, the function of population comparison can also be added to delineate and compare different labels of different populations. This is also a huge test for query performance.
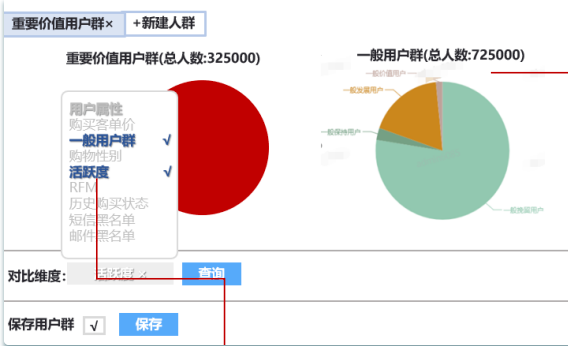
However, as the core of user portrait, user clustering function must be realized. For the technical architecture, Hbase is better at querying in the form of KV. For multi-dimensional queries, the performance is poor, so you can use es index to query the Rowkey of Hbase in ES, and then query Hbase. Many companies choose to migrate to es as a whole to complete this work.
This document is an introduction to user portrait, which introduces the theory and system construction of user portrait. Friends interested in big data and user portraits are also welcome to join the learning group for discussion and exchange~

For example, if the two-dimensional code expires, please contact the official account of big data flow.
