CSS is powerful in handling typesetting, not impossible but unexpected.Next, we'll work on a column chart.
Start with a specific framework.We use an unordered list as a whole, and what's inside we simply choose inline null span, strong, em to fill.
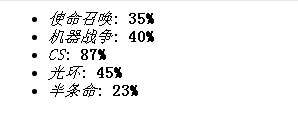
   <ul class="chart">
      <li><em>Call of Duty</em><span>: </span><strong>35%</strong></li>
      <li><em>Machine Warfare</em><span>: </span><strong>40%</strong></li>
      <li><em>CS</em><span>: </span><strong>87%</strong></li>
      <li><em>Halo</em><span>: </span><strong>45%</strong></li>
      <li><em>half-life</em><span>: </span><strong>23%</strong></li>
    </ul>
Explain that every li in ul represents what we want to count, span is the column, em is the name of the statistic, and strong is the statistic.We can add some background colors to distinguish them.
.chart {
     list-style: none;
     font-family: 'Song Style';
     font-size: 14px;
     border: 1px solid #ccc;
     margin: 0;
     padding: 5px;
     background:#F2F1D7;
   }

   .chart li {
     width:400px;
     background:#DDF3FF;
   }
Run Code:
 <style type="text/css">
      .chart {
        list-style: none;
        font-family: 'Song Style';
        font-size: 14px;
        border: 1px solid #ccc;
        margin: 0;
        padding: 5px;
        background:#F2F1D7;
      }

      .chart li {
        width:400px;
        background:#DDF3FF;
      }
    </style>

   <ul class="chart">
      <li><em>Call of Duty</em><span >: </span><strong>35%</strong></li>
      <li><em>Machine Warfare</em><span >: </span><strong>40%</strong></li>
      <li><em>CS</em><span >: </span><strong>87%</strong></li>
      <li><em>Halo</em><span >: </span><strong>45%</strong></li>
      <li><em>half-life</em><span >: </span><strong>23%</strong></li>
    </ul>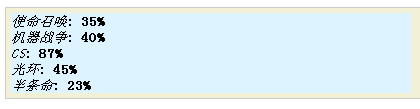
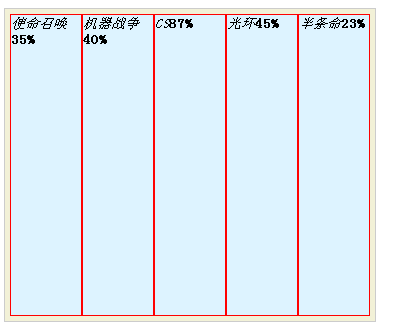
But how do you make Li columnar?First, we make the Li display side by side. To achieve this effect, we have two ways: 1, to make the Li display inline, 2, to make the Li floating element.The latter is chosen because the box model of the inline elements is difficult to control and the calculation of margin and padding becomes complex.Now that we choose the latter, we have to face a situation where floating overflows.The countermeasure is that the parent element also becomes a floating element.Floating containers shrink inward, adapting to the height and width of child elements.That is, we can concentrate on the design of li!To make Li behave like a post, we make it much taller than it is wider, and to make each li's range easily recognizable, I'll frame them first!
.chart {
  list-style: none;
  font-family: 'Song Style';
  font-size: 14px;
  border: 1px solid #ccc;
  margin: 0;
  padding: 5px;
  background:#F2F1D7;
  float:left;
}

.chart li {
  width:70px;
  height:300px;
  float:left;
  background:#DDF3FF;
  border:1px solid red;
}
Run Code:
    <style type="text/css">
      .chart {
        list-style: none;
        font-family: 'Song Style';
        font-size: 14px;
        border: 1px solid #ccc;
        margin: 0;
        padding: 5px;
        background:#F2F1D7;
        float:left;
      }

      .chart li {
        width:70px;
        height:300px;
        float:left;
        background:#DDF3FF;
        border:1px solid red;
      }
    </style>
    <script type="text/javascript">

    </script>
    <title>unauthorized modification button Of onclick Event</title>
  </head>
  <body>
    <ul class="chart">
      <li><em>Call of Duty</em><span ></span><strong>35%</strong></li>
      <li><em>Machine Warfare</em><span ></span><strong>40%</strong></li>
      <li><em>CS</em><span ></span><strong>87%</strong></li>
      <li><em>Halo</em><span ></span><strong>45%</strong></li>
      <li><em>half-life</em><span ></span><strong>23%</strong></li>
    </ul>
Next, we want to differentiate the contents of the li elements, because they are all inline elements, so it doesn't make sense to give them height and width. We have to disguise them as block elements.Then they will each have their own line.Because we deleted the colon from the space and it was empty, the space would appear as empty. We could stuff them in. I stuck, of course, you can't see it in the textarea. You can only use the view element function of Firefox.(You can check the difference between,,and_yourself!)
.chart {
  list-style: none;
  font-family: 'Song Style';
  font-size: 14px;
  border: 1px solid #ccc;
  margin: 0;
  padding: 5px;
  background:#F2F1D7;
  float:left;
}

.chart li {
  width:70px;
  height:300px;
  float:left;
  background:#DDF3FF;
  border:1px solid red;
}
.chart li em ,
.chart li span ,
.chart li strong {
   display:block;
}
Run Code:
 <style type="text/css">
      .chart {
        list-style: none;
        font-family: 'Song Style';
        font-size: 14px;
        border: 1px solid #ccc;
        margin: 0;
        padding: 5px;
        background:#F2F1D7;
        float:left;
      }

      .chart li {
        width:70px;
        height:300px;
        float:left;
        background:#DDF3FF;
        border:1px solid red;
      }
      .chart li em ,
      .chart li span ,
      .chart li strong {
        display:block;
      }
    </style>

    <ul class="chart">
      <li><em>Call of Duty</em><span></span><strong>35%</strong></li>
      <li><em>Machine Warfare</em><span></span><strong>40%</strong></li>
      <li><em>CS</em><span></span><strong>87%</strong></li>
      <li><em>Halo</em><span></span><strong>45%</strong></li>
      <li><em>half-life</em><span></span><strong>23%</strong></li>
    </ul>
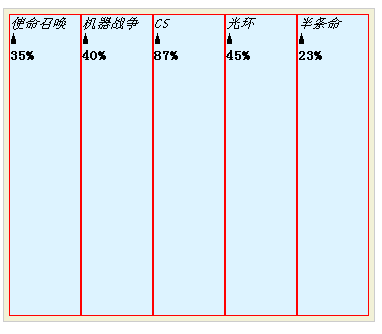
Then we'll pop out the space occupied by the columns and center things in relation.
.chart {
  list-style: none;
  font-family: 'Song Style';
  font-size: 14px;
  border: 1px solid #ccc;
  margin: 0;
  padding: 5px;
  background:#F2F1D7;
  float:left;
}

.chart li {
  width:70px;
  height:300px;
  float:left;
  background:#DDF3FF;
  border:1px solid red;
}
.chart li em {
  display:block;
  height:20px;
  text-align:center;
}
.chart li span {
  display:block;
  background:#F1FAFA;
  height:260px;
}
.chart li strong {
  display:block;
  height:20px;
  text-align:center;
}
Run Code:
  <style type="text/css">
      .chart {
        list-style: none;
        font-family: 'Song Style';
        font-size: 14px;
        border: 1px solid #ccc;
        margin: 0;
        padding: 5px;
        background:#F2F1D7;
        float:left;
      }

      .chart li {
        width:70px;
        height:300px;
        float:left;
        background:#DDF3FF;
        border:1px solid red;
      }
      .chart li em {
        display:block;
        height:20px;
        text-align:center;
      }
      .chart li span {
        display:block;
        background:#F1FAFA;
        height:260px;
      }
      .chart li strong {
        display:block;
        height:20px;
        text-align:center;
      }
    </style>

    <ul class="chart">
      <li><em>Call of Duty</em><span></span><strong>35%</strong></li>
      <li><em>Machine Warfare</em><span></span><strong>40%</strong></li>
      <li><em>CS</em><span></span><strong>87%</strong></li>
      <li><em>Halo</em><span></span><strong>45%</strong></li>
      <li><em>half-life</em><span></span><strong>23%</strong></li>
    </ul>
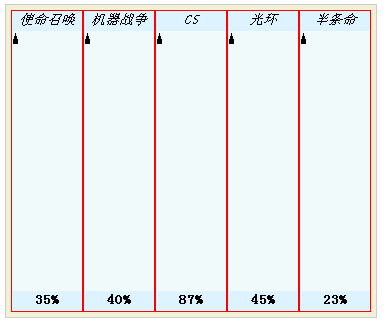
Then we add a picture of the Li element, which is the legendary cylinder. Then we use the space as a cover and the statistics of the Li item show us how much. For easy calculation, we reset the height of the space to 100px and the height of the Li to 140px.em and strong set the same background color as li, covering the top and bottom of the column.
.chart {
      list-style: none;
      font-family: 'Song Style';
      font-size: 14px;
      border: 1px solid #ccc;
      margin: 0;
      padding: 5px;
      background:#F2F1D7;
      float:left;
    }
    .chart li {
      width:70px;
      height:140px;
      float:left;
      border:1px solid red;
      background:#DDF3FF url(http://images.cnblogs.com/cnblogs_com/rubylouvre/202680/o_pillar.gif) center center repeat-y;
    }
    .chart li em,  .chart li span,.chart li strong {
      display:block;
      height:20px;
      text-align:center;
    }
    .chart li em,  .chart li strong{
      background: #DDF3FF;
    }
    .chart li span {
      height:100px;
    }
Run Code:
<style type="text/css">
       .chart {
        list-style: none;
        font-family: 'Song Style';
        font-size: 14px;
        border: 1px solid #ccc;
        margin: 0;
        padding: 5px;
        background:#F2F1D7;
        float:left;
      }
      .chart li {
        width:70px;
        height:140px;
        float:left;
        border:1px solid red;
        background:#DDF3FF url(http://images.cnblogs.com/cnblogs_com/rubylouvre/202680/o_pillar.gif) center center repeat-y;
      }
      .chart li em,  .chart li span,.chart li strong {
        display:block;
        height:20px;
        text-align:center;
      }
      .chart li em,  .chart li strong{
        background: #DDF3FF;
      }
      .chart li span {
        height:100px;
      }
    </style>

    <ul class="chart">
      <li><em>Call of Duty</em><span></span><strong>35%</strong></li>
      <li><em>Machine Warfare</em><span></span><strong>40%</strong></li>
      <li><em>CS</em><span></span><strong>87%</strong></li>
      <li><em>Halo</em><span></span><strong>45%</strong></li>
      <li><em>half-life</em><span></span><strong>23%</strong></li>
    </ul>
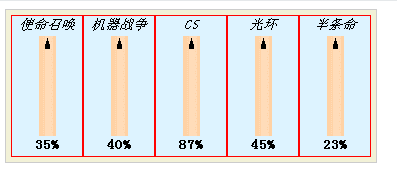
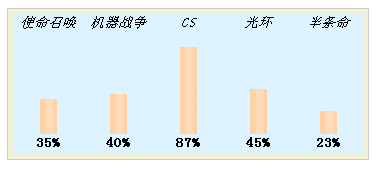
Next, we get a background picture in space with the same color as the li element, and we move up as much as the statistics are!For convenience, we set this backgroundPositionY value using an inline style.Finally, remove the border of the li element and you're done!
.chart {
  list-style: none;
  font-family: 'Song Style';
  font-size: 14px;
  border: 1px solid #ccc;
  margin: 0;
  padding: 5px;
  background:#F2F1D7;
  float:left;
}
.chart li {
  width:70px;
  height:140px;
  float:left;
  background:#DDF3FF url(http://images.cnblogs.com/cnblogs_com/rubylouvre/202680/o_pillar.gif) center center repeat-y;
}
.chart li em,  .chart li span,.chart li strong {
  display:block;
  height:20px;
  text-align:center;
  background: #DDF3FF;
}
.chart li span {
  height:100px;
  background:transparent url(http://images.cnblogs.com/cnblogs_com/rubylouvre/202680/o_mask.jpg)  no-repeat;
}
<ul class="chart">
   <li><em>Call of Duty</em><span style="background-position: center -35px"></span><strong>35%</strong></li>
   <li><em>Machine Warfare</em><span style="background-position: center -40px"></span><strong>40%</strong></li>
   <li><em>CS</em><span style="background-position: center -87px"></span><strong>87%</strong></li>
   <li><em>Halo</em><span style="background-position: center -45px"></span><strong>45%</strong></li>
   <li><em>half-life</em><span style="background-position: center -23px"></span><strong>23%</strong></li>
 </ul>
Run Code:
    <style type="text/css">
      .chart {
        list-style: none;
        font-family: 'Song Style';
        font-size: 14px;
        border: 1px solid #ccc;
        margin: 0;
        padding: 5px;
        background:#F2F1D7;
        float:left;
      }
      .chart li {
        width:70px;
        height:140px;
        float:left;
        background:#DDF3FF url(http://images.cnblogs.com/cnblogs_com/rubylouvre/202680/o_pillar.gif) center center repeat-y;
      }
      .chart li em,  .chart li span,.chart li strong {
        display:block;
        height:20px;
        text-align:center;
      }
      .chart li em,  .chart li strong{
        background: #DDF3FF;
      }
      .chart li span {
        height:100px;
        background:transparent url(http://images.cnblogs.com/cnblogs_com/rubylouvre/202680/o_mask.jpg)  no-repeat;
      }
    </style>

    <ul class="chart">
      <li><em>Call of Duty</em><span style="background-position: center -35px"></span><strong>35%</strong></li>
      <li><em>Machine Warfare</em><span style="background-position: center -40px"></span><strong>40%</strong></li>
      <li><em>CS</em><span style="background-position: center -87px"></span><strong>87%</strong></li>
      <li><em>Halo</em><span style="background-position: center -45px"></span><strong>45%</strong></li>
      <li><em>half-life</em><span style="background-position: center -23px"></span><strong>23%</strong></li>
    </ul>