What are the types of GC in Java?
parameter | describe |
|---|---|
UseSerialGC | The virtual machine runs in the default value of Client mode. After this switch parameter is turned on, Use the Serial+Serial Old collector combination for garbage collection. |
UseParNewGC | When this switch parameter is turned on, the ParNew+Serial Old collector combination is used for garbage collection. |
UseConcMarkSweepGC | When this switch parameter is turned on, the ParNew+CMS+Serial Old collector combination is used for garbage collection. Serial Old is a backup garbage collector for Concurrent Mode Failure as a CMS collector. |
UseParallelGC | The virtual machine runs in the default value of Server mode. After this switch parameter is turned on, the Parallel Scavenge+Serial Old collector combination is used for garbage collection. |
UseParallelOldGC | When this switch parameter is turned on, the Parallel Scavenge+Parallel Old collector combination is used for garbage collection. |
After the Java program is started, the current running process can be queried through jps observation process java Process, using
jinfo –flag UseSerialGC process
You can locate the gc policy it uses, because these parameters are boolean constants. If this gc policy is used, the + sign will appear, otherwise the minus sign will appear.
Use - XX: + the above GC policy to open the corresponding GC policy.
GC log view
You can specify the corresponding gc type by adding parameters to java commands, print gc log information and output it to files.
The log of GC is written in the form of replacement (>) instead of addition (> >). If it is written to the same file next time, the previous GC content will be cleared.
Corresponding parameter list
This code is by Java Architect must see network-Structure Sorting
-XX:+PrintGC output GC journal
-XX:+PrintGCDetails output GC Detailed log of
-XX:+PrintGCTimeStamps output GC Timestamp of (in the form of base time)
-XX:+PrintGCDateStamps output GC Timestamp of (in the form of date, such as 2013)-05-04T21:53:59.234+0800)
-XX:+PrintHeapAtGC In progress GC Print out the information of the heap before and after
-Xloggc:../logs/gc.log Output path of log file
For example: Eclipse The following code is configured in ini. After startup, gc.exe will be generated in the same directory log
-Xloggc:gc.log
-XX:+PrintGCTimeStamps
-XX:+PrintGCDetails
Here, the following parameters are used to print the log:
This code is by Java Architect must see network-Structure Sorting
-XX:+PrintGCDateStamps -XX:+PrintGCDetails -Xloggc:./gclogs
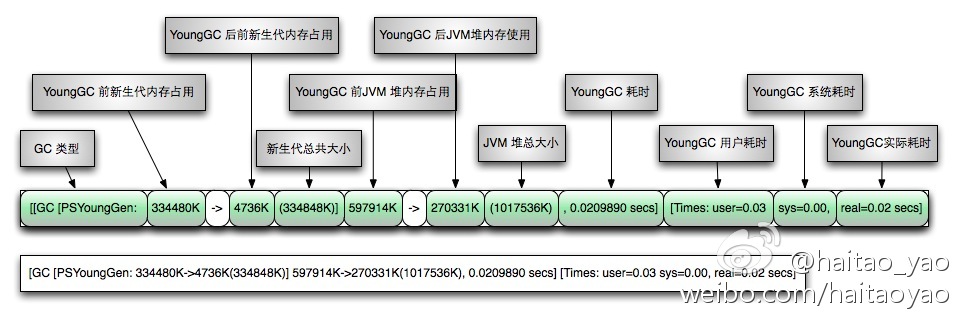
The basic contents of the one line log recovered by the Cenozoic generation are as follows:
2014-07-18T16:02:17.606+0800: 611.633: [GC 611.633: [DefNew: 843458K->2K(948864K), 0.0059180 secs] 2186589K->1343132K(3057292K), 0.0059490 secs] [Times: user=0.00 sys=0.00, real=0.00 secs]
Its meaning is as follows:
2014-07-18T16:02:17.606+0800(Current timestamp): 611.633(Time stamp): [GC(express Young GC) 611.633: [DefNew(Single thread Serial Young generation GC): 843458K(Size of the younger generation before garbage collection)->2K(Size of young generation after recycling)(948864K(Young generation (total size)), 0.0059180 secs(Time of this recovery)] 2186589K(Size of the entire heap before recycling)->1343132K(Size of the entire heap after recycling)(3057292K(Total heap size)), 0.0059490 secs(Recovery time)] [Times: user=0.00(User time) sys=0.00(System time consuming), real=0.00 secs(Actual time)]
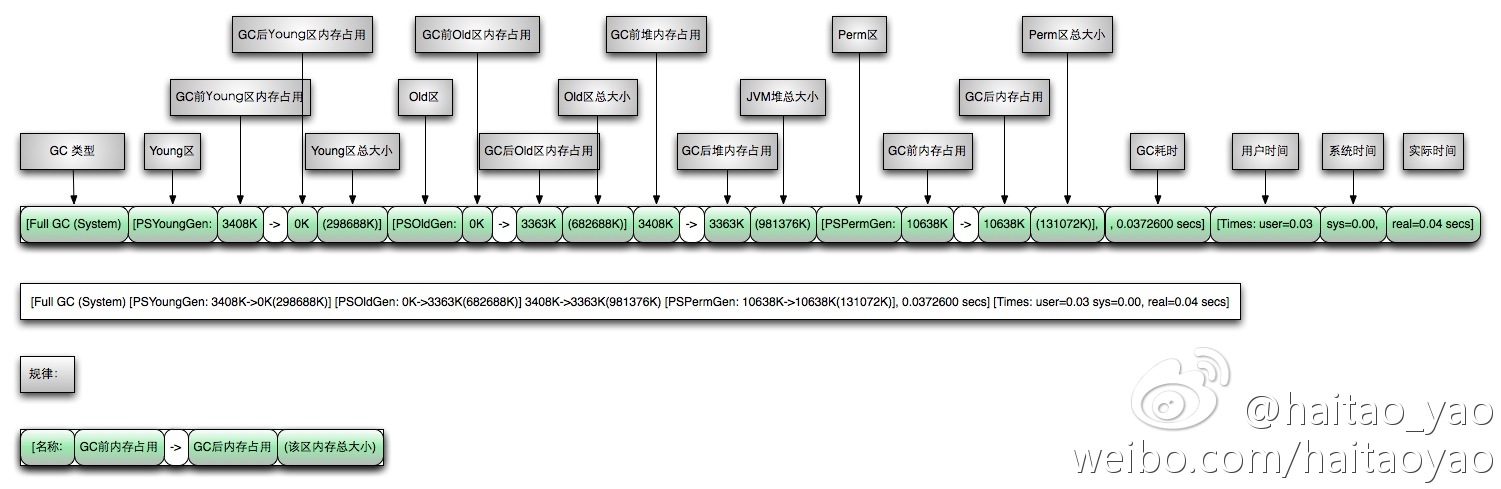
The logs of older generation recycling are as follows:
2014-07-18T16:19:16.794+0800: 1630.821: [GC 1630.821: [DefNew: 1005567K->111679K(1005568K), 0.9152360 secs]1631.736: [Tenured:
2573912K->1340650K(2574068K), 1.8511050 secs] 3122548K->1340650K(3579636K), [Perm : 17882K->17882K(21248K)], 2.7854350 secs] [Times: user=2.57 sys=0.22, real=2.79 secs]
The last in the gc log seems to be the snapshot before the system is completed:
Heap
 def new generation   total 1005568K, used 111158K [0x00000006fae00000, 0x000000073f110000, 0x0000000750350000)
  eden space 893888K,  12% used [0x00000006fae00000, 0x0000000701710e90, 0x00000007316f0000)
  from space 111680K,   3% used [0x0000000738400000, 0x000000073877c9b0, 0x000000073f110000)
  to   space 111680K,   0% used [0x00000007316f0000, 0x00000007316f0000, 0x0000000738400000)
 tenured generation   total 2234420K, used 1347671K [0x0000000750350000, 0x00000007d895d000, 0x00000007fae00000)
   the space 2234420K,  60% used [0x0000000750350000, 0x00000007a2765cb8, 0x00000007a2765e00, 0x00000007d895d000)
 compacting perm gen  total 21248K, used 17994K [0x00000007fae00000, 0x00000007fc2c0000, 0x0000000800000000)
   the space 21248K,  84% used [0x00000007fae00000, 0x00000007fbf92a50, 0x00000007fbf92c00, 0x00000007fc2c0000)
No shared spaces configured.
Offline of GC log analysis
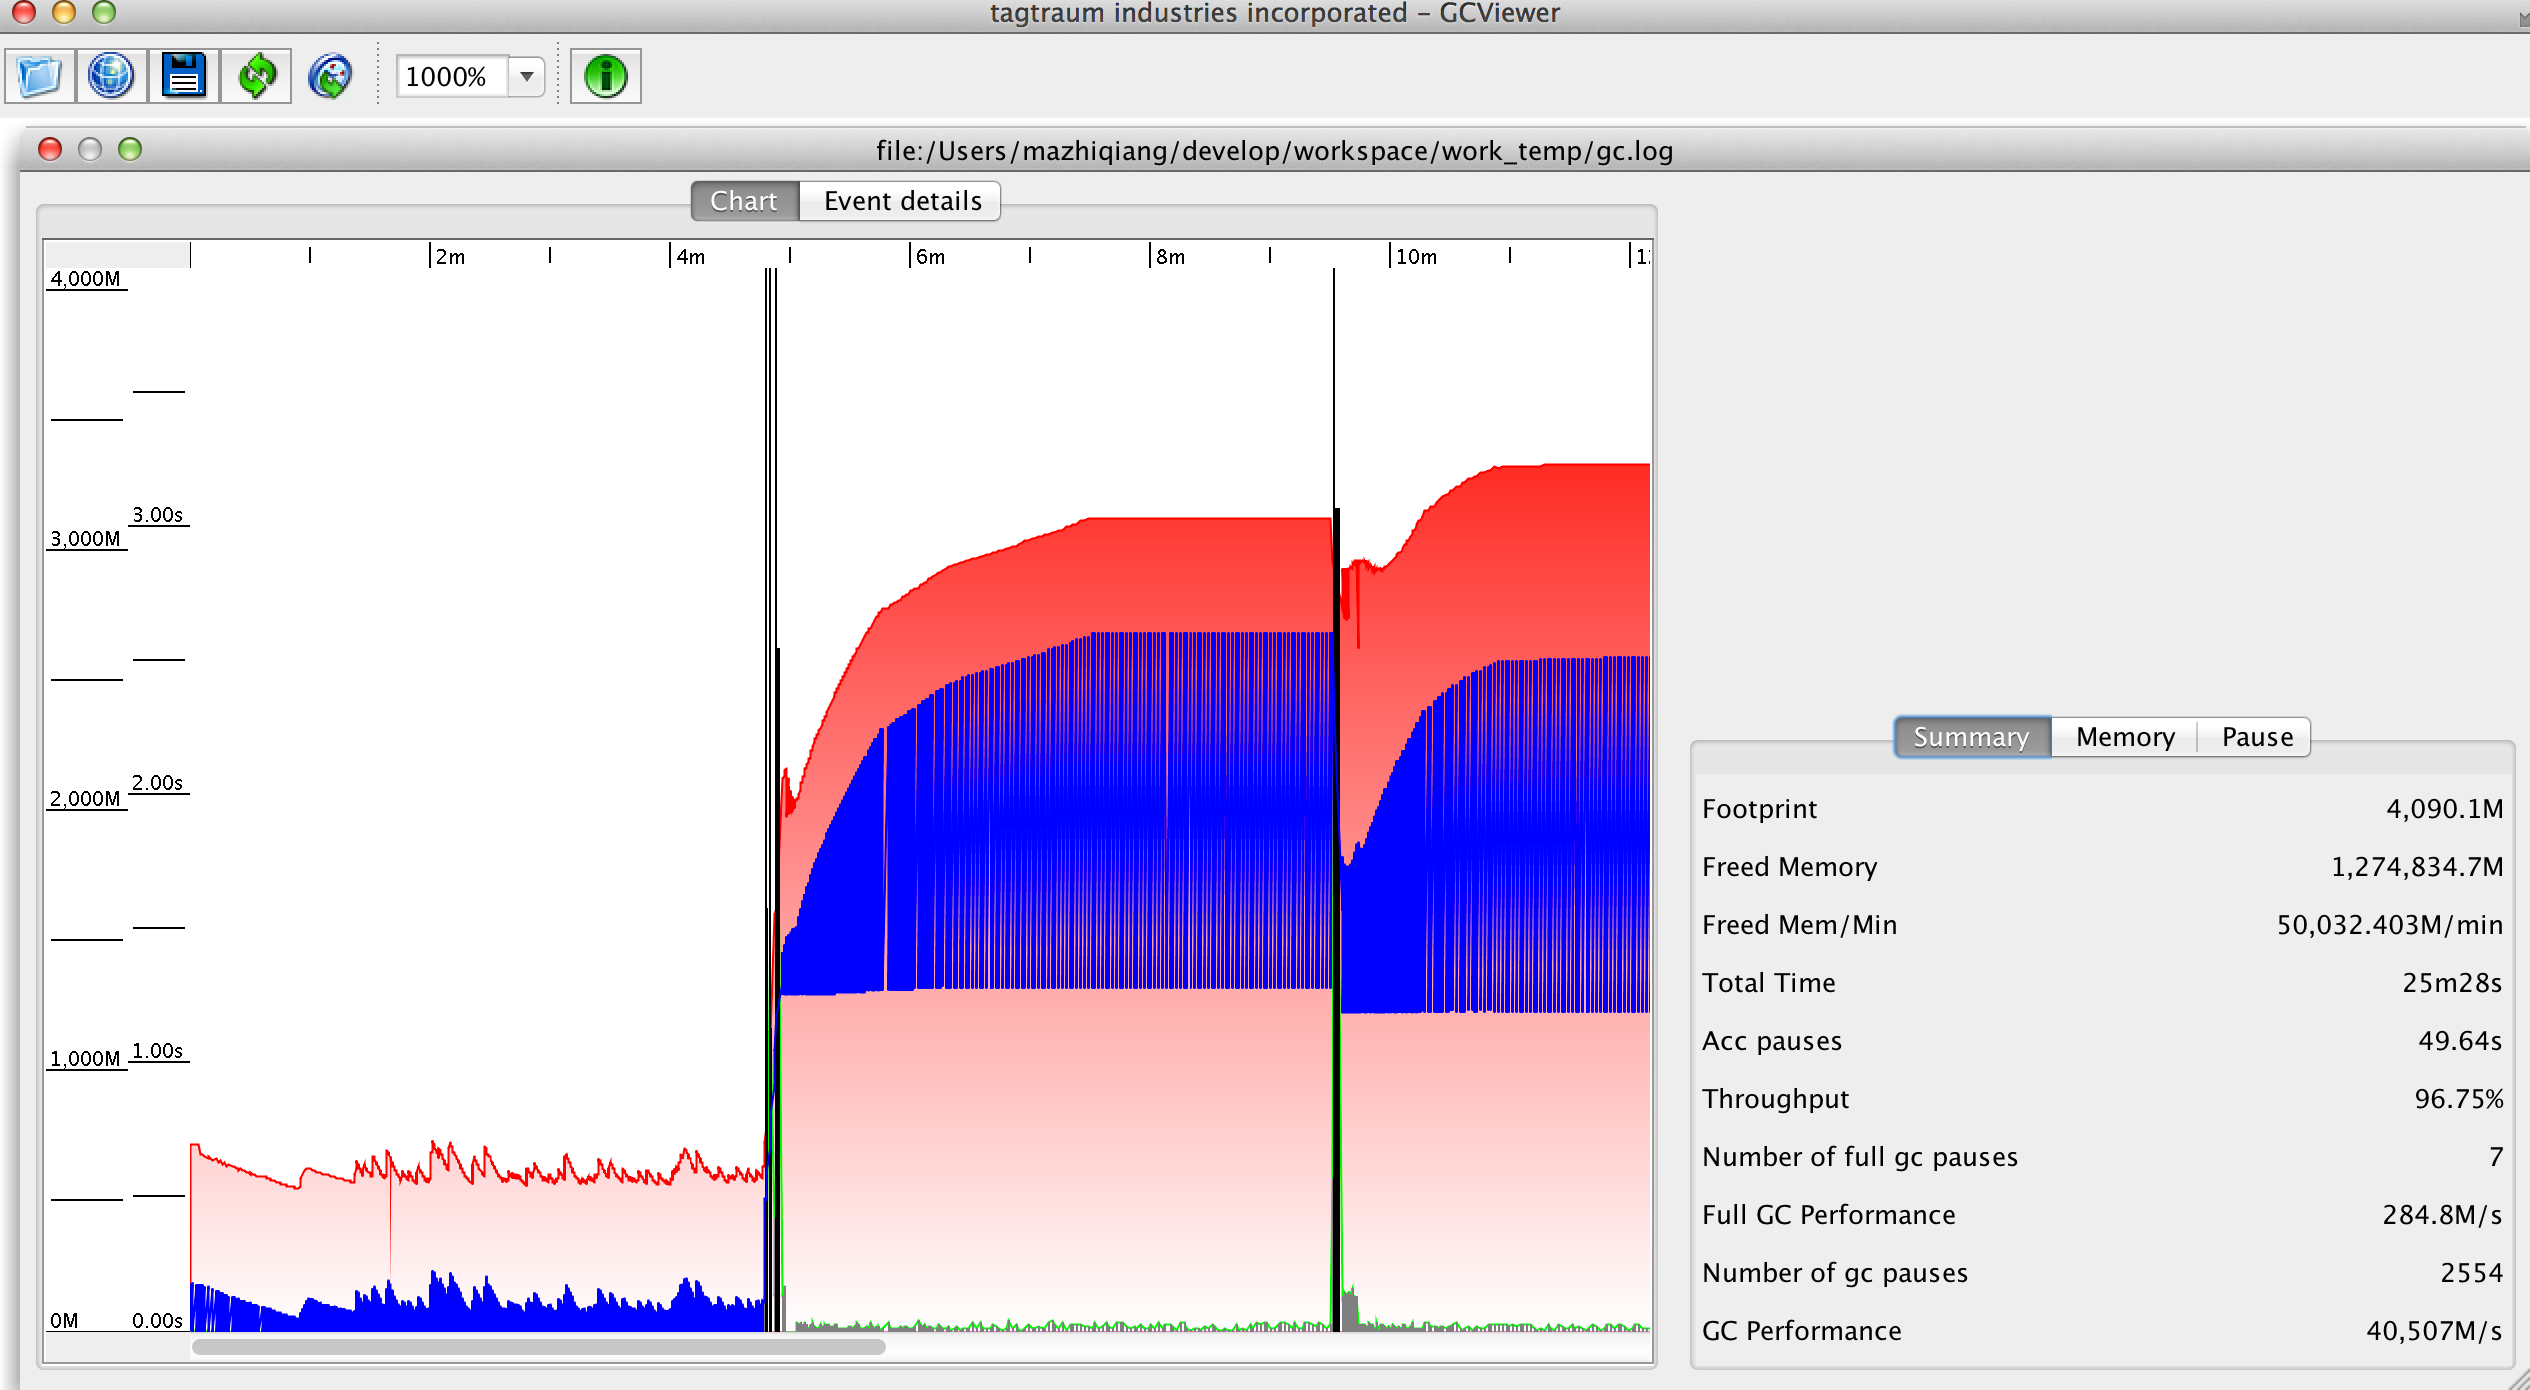
You can use some offline tools to analyze GC logs, such as sun's gchisto( https://java.net/projects/gchisto),gcviewer( https://github.com/chewiebug/GCViewer ), these are open source tools. Users can download their source code directly through version control tools for offline analysis.
Let's take gcviewer as an example to briefly analyze the offline analysis of gc logs. The source code project of gcviewer is maven structure, which can be directly package d with maven. Version 1.34 is compiled here, and the snapshot of this version has been uploaded to the attachment.
It should be noted that gcviewer supports gc logs generated by multiple parameters, which can be run directly through java – jar, and the generated gc logs can be loaded:
------------------------Second understanding-----------------------
First, give an example of log output:
The parameter is set to:
-XX:+PrintGCDetails -XX:-UseAdaptiveSizePolicy -XX:SurvivorRatio=8 -XX:NewSize=10M -XX:MaxNewSize=10M
Parameter interpretation:
-20: + printgcdetails enable logging
-20: - useadaptive sizepolicy disables dynamic adjustment so that SurvivorRatio works
-20: Survivorratio = 8 set Eden: survival = 8
-20: Newsize = 10M - XX: maxnewsize = 10M sets the size of the whole Cenozoic to 10M
The default garbage collector is Parallel Scavenge
The output result is:
[GC [PSYoungGen: 4423K->320K(9216K)] 4423K->320K(58880K), 0.0011900 secs] [Times: user=0.01 sys=0.00, real=0.01 secs]
 [Full GC (System) [PSYoungGen: 320K->0K(9216K)] [ParOldGen: 0K->222K(49664K)] 320K->222K(58880K) [PSPermGen: 2458K->2456K(21248K)], 0.0073610 secs] [Times: user=0.01 sys=0.00, real=0.00 secs]
 Heap
  PSYoungGen      total 9216K, used 491K [0x00000000ff600000, 0x0000000100000000, 0x0000000100000000)
   eden space 8192K, 6% used [0x00000000ff600000,0x00000000ff67af50,0x00000000ffe00000)
   from space 1024K, 0% used [0x00000000ffe00000,0x00000000ffe00000,0x00000000fff00000)
   to   space 1024K, 0% used [0x00000000fff00000,0x00000000fff00000,0x0000000100000000)
  ParOldGen       total 49664K, used 222K [0x00000000c5800000, 0x00000000c8880000, 0x00000000ff600000)
   object space 49664K, 0% used [0x00000000c5800000,0x00000000c58378a0,0x00000000c8880000)
  PSPermGen       total 21248K, used 2466K [0x00000000c0600000, 0x00000000c1ac0000, 0x00000000c5800000)
   object space 21248K, 11% used [0x00000000c0600000,0x00000000c0868b48,0x00000000c1ac0000)
First half analysis:
GC (minor) log
Full GC log
Second half analysis:
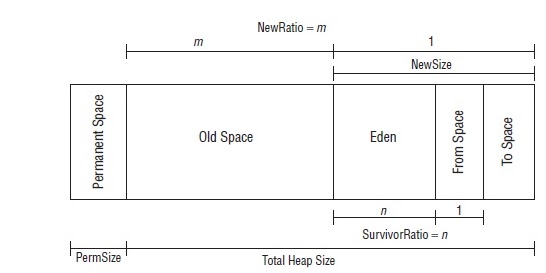
Compared with the above figure, PSYoungGen (PS refers to Parallel Scavenge) in GC log is Eden+FromSpace, while the whole YoungGeneration is Eden+FromSpace+ToSpace.
We set the Cenozoic size to 10240K, including 9216K PSYoungGen and 1024K ToSpace. Eden:FromSpace in PSYoungGen is 8:1,
This includes Eden of 8192K and FromSpace of 1024K.
The output of the elderly generation and the permanent generation is relatively simple and will not be described in detail.
For a more detailed description, see the official documents: http://www.oracle.com/technetwork/java/javase/gc-tuning-6-140523.html
Finally, it should be noted that if the Cenozoic space cannot be divided in proportion, there may be some errors. For example, if SurvivorRatio in the above parameters is changed to 10, the output is as follows:
[GC [PSYoungGen: 4439K->320K(9408K)] 4439K->320K(59072K), 0.0010120 secs] [Times: user=0.00 sys=0.00, real=0.00 secs]
 [Full GC (System) [PSYoungGen: 320K->0K(9408K)] [ParOldGen: 0K->222K(49664K)] 320K->222K(59072K) [PSPermGen: 2458K->2456K(21248K)], 0.0095710 secs] [Times: user=0.02 sys=0.00, real=0.00 secs]
 Heap
  PSYoungGen      total 9408K, used 514K [0x00000000ff600000, 0x0000000100000000, 0x0000000100000000)
   eden space 8576K, 6% used [0x00000000ff600000,0x00000000ff680b78,0x00000000ffe60000)
   from space 832K, 0% used [0x00000000ffe60000,0x00000000ffe60000,0x00000000fff30000)
   to   space 832K, 0% used [0x00000000fff30000,0x00000000fff30000,0x0000000100000000)
  ParOldGen       total 49664K, used 222K [0x00000000c5800000, 0x00000000c8880000, 0x00000000ff600000)
   object space 49664K, 0% used [0x00000000c5800000,0x00000000c58378a0,0x00000000c8880000)
  PSPermGen       total 21248K, used 2466K [0x00000000c0600000, 0x00000000c1ac0000, 0x00000000c5800000)
   object space 21248K, 11% used [0x00000000c0600000,0x00000000c0868b48,0x00000000c1ac0000)
It can be seen that there is a certain error in the relevant values of the Cenozoic
GC log time analysis: http://www.cnblogs.com/senlinyang/p/8717611.html