Previously, gdb debugging was basically used for debugging in Linux environment. gdb debugging is really powerful, but it is not very convenient for vs and other ides in windows environment. I learned about a vscode tool. This tool is a lightweight IDE that can remotely debug programs in Linux environment, and the visibility and availability are greatly improved, You don't need to remember the gdb command to debug. Now many programs use makefile for program compilation. According to the actual needs, this paper combines the nxlog source code to build the gdb remote debugging environment of vscode linux environment.
This article needs to prepare vscode remote debugging environment, install vscode locally on windows, and configure remote connection to linux environment. These operations are mainly to install some plug-ins and mutual trust configuration, which will not be introduced here.
After making sure that the remote connection is successful, start configuring the remote gdb debugging function, mainly configuring tasks JSON and launch JSON file.
1. First, make sure you can connect to the linux environment remotely:
2. Create launch JSON file
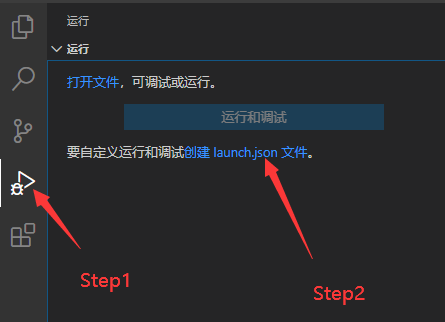
Select c++(GDB/LLDB)

Using: default configuration

This will be in Generate launch. In vscode directory JSON file. The following is the template generated by default. The default option field can view the attribute description by hovering over the mouse. Here I have briefly made some comments.
{
    // Use IntelliSense to understand related properties.
    // Hover to view the description of an existing property.
    // For more information, visit: https://go.microsoft.com/fwlink/?linkid=830387
    "version": "0.2.0",
    "configurations": [
        {
            "name": "(gdb) start-up", //Configuration name, displayed in the configuration drop-down menu
            "type": "cppdbg", //Configuration type
            "request": "launch", //Request configuration type, which can be startup or additional
            "program": "Enter a program name, for example ${workspaceFolder}/a.exe", //The full path of the program executable, ${workspaceFolder} represents the initial path of the remote connection
            "args": [], //Command line arguments passed to the program
            "stopAtEntry": false,//Optional parameter. If true, the debugger should stop at the entry (main)
            "cwd": "${workspaceFolder}", //Target's working directory
            "environment": [], //Represents the environment variable to preset
            "externalConsole": false,//If true, start the console for the debug object
            "MIMode": "gdb",//Console launcher to connect to
            "setupCommands": [ //One or more GDB/LLDB commands executed to install the base debugger
                {
                    "description": "by gdb Enable neat printing",
                    "text": "-enable-pretty-printing",
                    "ignoreFailures": true
                }
            ]
        }
    ]
}
3. Modify launch JSON file
{
    // Use IntelliSense to understand related properties.
    // Hover to view the description of an existing property.
    // For more information, visit: https://go.microsoft.com/fwlink/?linkid=830387
    "version": "0.2.0",
    "configurations": [
        {
            "name": "(gdb) start-up",
            "type": "cppdbg",
            "request": "launch",
            "program": "${workspaceFolder}/src/core/nxlog",
            "args": [],
            "stopAtEntry": false,
            "cwd": "${fileDirname}",
            "environment": [],
            "externalConsole": false,
            "MIMode": "gdb",
            "setupCommands": [
                {
                    "description": "by gdb Enable neat printing",
                    "text": "-enable-pretty-printing",
                    "ignoreFailures": true
                }
            ],
            "preLaunchTask": "build-debug"
        }
    ]
}
A preLaunchTask field is added here to indicate the task to be executed before debugging. We set the task to be executed as build debug. We hope that this task is to generate an executable program through the make command.
4. Next, we generate the build debug task
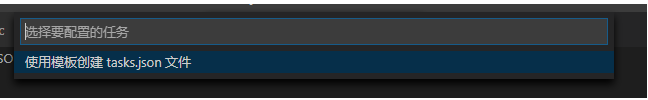
ctrl + shift + p enter Tasks select Tasks: configure Tasks

Use the template to generate tasks json
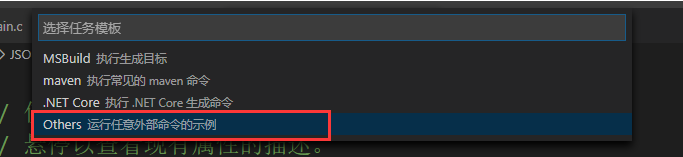 This will be in Generate a default task in the vscode directory JSON file
{
    // See https://go.microsoft.com/fwlink/?LinkId=733558
    // for the documentation about the tasks.json format
    "version": "2.0.0",
    "tasks": [
        {
            "label": "echo",
            "type": "shell",
            "command": "echo Hello"
        }
    ]
}
5. Modify tasks JSON file
{
    // See https://go.microsoft.com/fwlink/?LinkId=733558
    // for the documentation about the tasks.json format
    "version": "2.0.0",
    "tasks": [
        {
            "label": "build-debug",
            "command": "make",
            "args": [""],
            "type": "shell"
        },
        {
            "label": "clean",
            "command": "make",
            "args": ["clean"],
            "type": "shell"
        }
    ]
}
Here we configure two label s, including the build debug task we mentioned earlier.
6. Start debugging
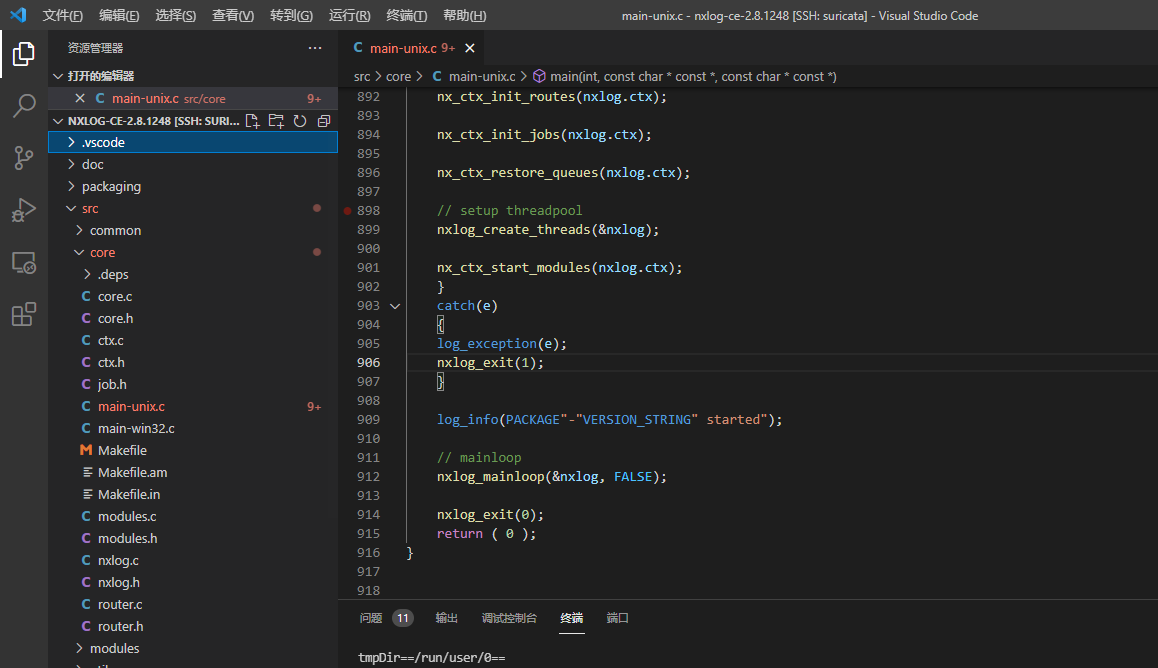
This completes the configuration. Next, after setting the breakpoint (the breakpoint will not be introduced), we start F5 debugging. First, make according to the configuration in the tasks.json file to generate the required nxlog file, and then formally enter the debugging process, blocking at the first breakpoint.
Here are some debugging keys:
F5 start commissioning
F10 # single step skip
F11 single step commissioning
shift + F11 # step out
ctrl + shift + F5} restart debugging
shift + F5} stop debugging
7. Finally, the debugging interface

The debug interface is divided into several interfaces. Variables can be used to view various variables in the current debugging process, monitor components can configure monitoring conditions, and call stack components to display the current stack information. The specific content is not yet studied carefully, and the function of debugging is still more comprehensive.