1, Problem Description:
How to use GEE to analyze urban heat island effect? Get the area with higher temperature in the urban area, and get the area of the area?
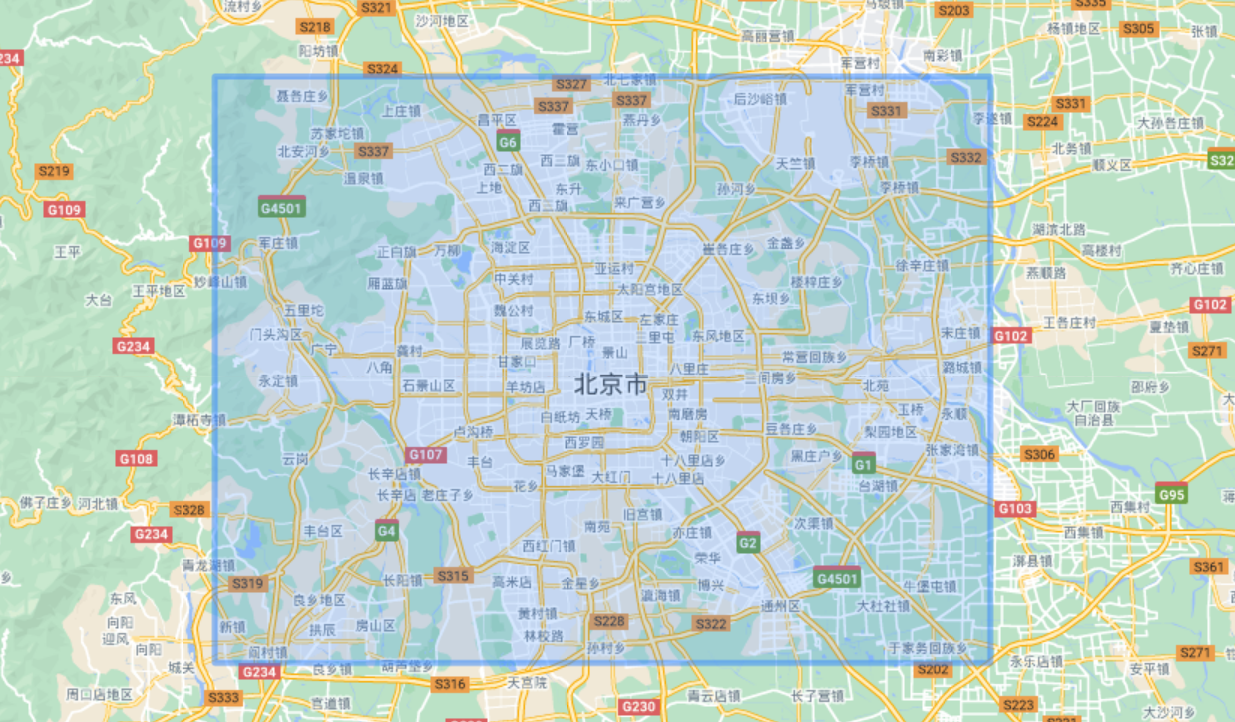
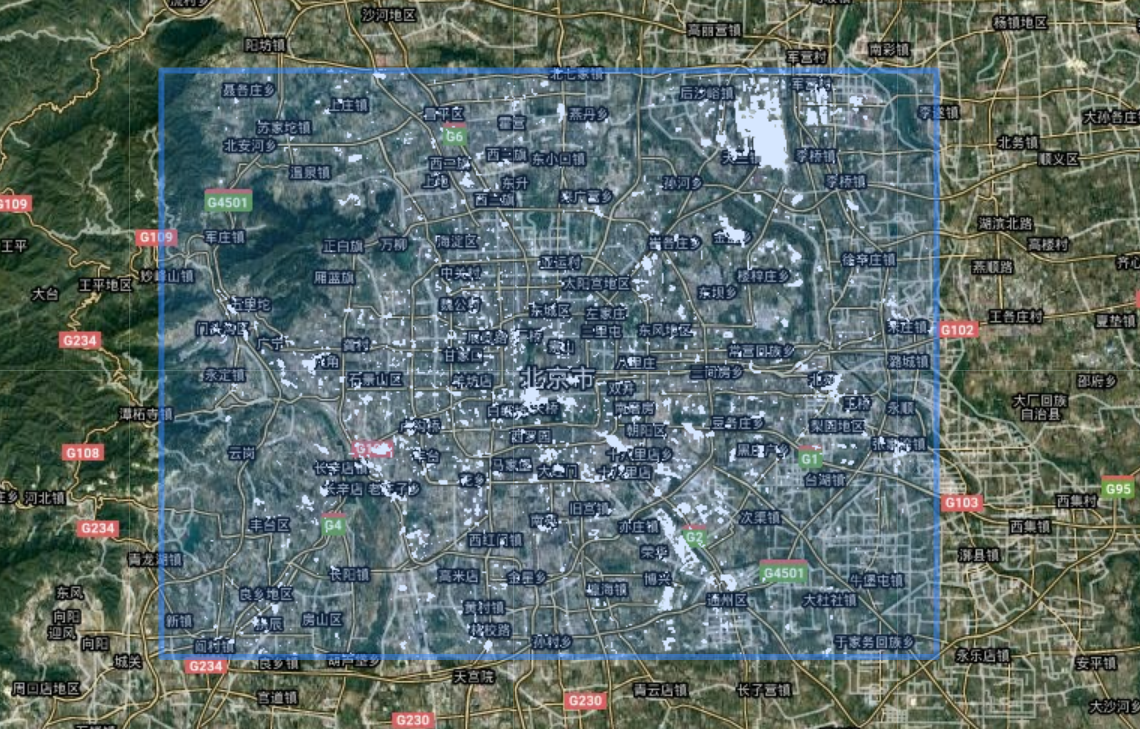
In the analysis area, the urban area of Beijing is selected for analysis:
2, Heat island effect
- Urban Heat Island Effect refers to the phenomenon that the temperature in an area is higher than that in the surrounding area. It is expressed by the temperature difference (i.e. heat island intensity) of two representative measuring points. There are mainly Urban Heat Island Effect and Qinghai Tibet Plateau heat island effect.
- Heat island effect is a phenomenon of urban microclimate change caused by human factors, which changes the local temperature, humidity and air convection of urban surface. This phenomenon is one of the most obvious characteristics of urban climate.
1. Definition
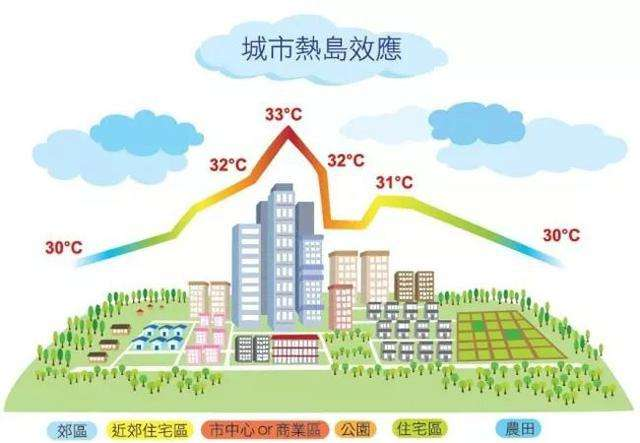
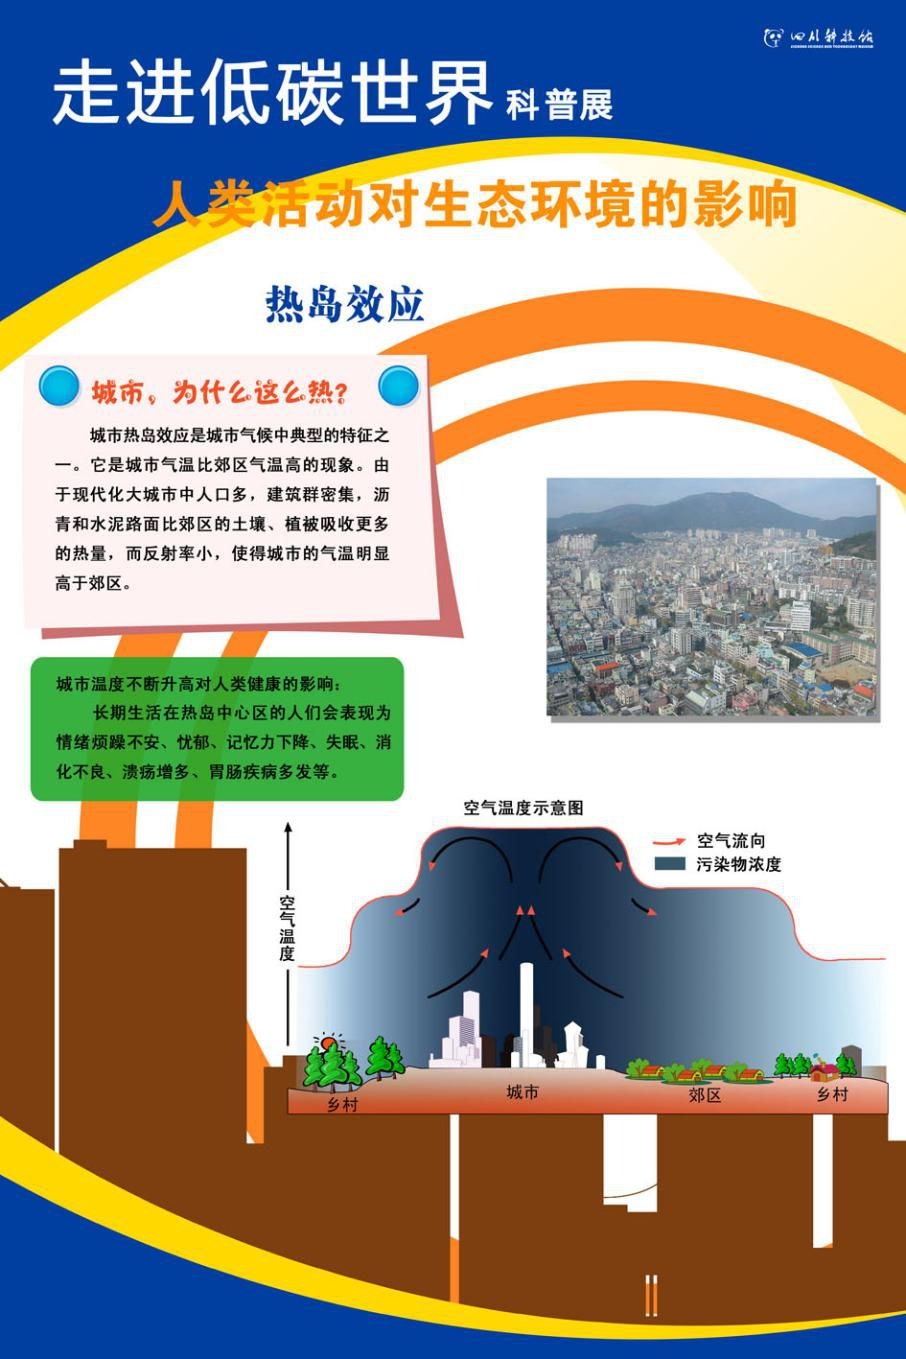
Due to the dense urban buildings, asphalt roads and cement pavements have greater heat absorption rate and smaller specific heat capacity than the soil and vegetation in the suburbs, the urban area heats up faster and radiates a lot to the surrounding and atmosphere. At the same time, the temperature in the urban area is generally higher than that in the surrounding suburbs, and the high-temperature urban area is surrounded by low-temperature suburbs, Like islands in the ocean, people call this phenomenon urban heat island effect.
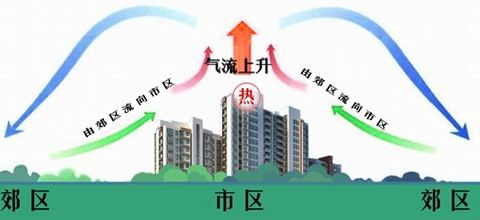
On the near surface isotherm map, the temperature in the suburbs is relatively low, while the urban area forms an obvious high-temperature area, like an island exposed to the water, which is vividly called "urban heat island". In the center of urban heat island, the temperature is generally about 1 ℃ higher than that in the surrounding suburbs, up to more than 6 ℃. The heat emitted by large cities can reach 2 / 5 of the solar energy received, thus raising the temperature of the city. Under the action of urban heat island, a heat island circulation blowing from the suburbs to the city is generated near the ground. The urban heat island enhances air convection, and the smoke and dust in the air provides sufficient water vapor condensation nodules. The precipitation in the old city is more than that in the suburbs. Research on many large cities in Europe and the United States found that urban precipitation is generally 5% ~ 10% more than that in the suburbs.
2. Cause of formation
The urban heat island effect is mainly affected by the following factors: evaporation reduction, reflectivity reduction of urban underlying surface and energy input. Its intensity influence is as follows: evaporation reduction of 0.05g/sm and heat input increase of 120.9w/m; The reflectivity of urban underlying surface decreases by 10% and the heat input increases by 30w/m; The artificial energy input is 10w/m, and the total heat input in the city increases by 160.9w/m. Due to the influence of air convection, the actual heat input is about 20w/m, and the calculated temperature rise is about 3.5 ℃, which is consistent with the actual comparison. When the air circulation slows down in summer, the heat input will increase sharply. Due to the low adaptability of urban evaporation system, the urban temperature will rise sharply. At the same time, the accelerated operation of air conditioning and thermal power plant will cause a vicious circle and aggravate the urban atmospheric temperature rise. The reduction of urban evaporation also forms the urban dry island effect, resulting in the increase of atmospheric stability over the city, the difficulty of vertical convection, the formation of near surface high temperature and serious air pollution (such as haze and photochemical smog).
3. Harm
Urban heat island effect is one of the typical characteristics of urban climate. It is a phenomenon that the temperature in the city is higher than that in the suburbs. On the one hand, the formation of urban heat island is the heat emitted by people's daily life in modern big cities; On the other hand, there are dense buildings in the city. The asphalt and cement pavement has smaller correspondence specific heat capacity (can absorb more heat) than the soil and vegetation in the suburbs, and the reflectivity is small and the absorption rate is large, which makes the city absorb and store more solar energy in the daytime than in the suburbs. At night, the cooling of the city is slow and the temperature is still higher than that in the suburbs. Urban heat island takes the city center as the center of the heat island, and a strong heating flow rises here, while the relatively cold air sinks over the suburbs, which forms the suburban circulation. Under the action of this local circulation, various pollutants in the air gather over the city. If there is no strong cold air, the urban air pollution will increase and the human living environment will be destroyed, It leads to various diseases and even death.
3, Regional analysis of high temperature in urban area
1. Analysis steps
The analysis steps are as follows:
2. Load data and display
python code is as follows:
image = ee.Image('LANDSAT/LC08/C02/T1_L2/LC08_123032_20210907')
# Map.addLayer(image, {'min':5000, 'max':15000, 'bands':['SR_B7', 'SR_B6', 'SR_B2']}, 'image')
image_clip = image.clip(roi)
# Scale conversion of C02 data
image_roi = image_clip.select('ST_B10').multiply(0.00341802).add(149)
# Convert to Celsius (- 273.5) and screen out areas greater than 35 ℃
hotspots = image_roi.subtract(273.5).gt(35).selfMask().rename('hotspots')
Map.add_basemap()
Map.addLayer(hotspots, {'palette':'gray'}, 'hotspots')
The results are as follows:
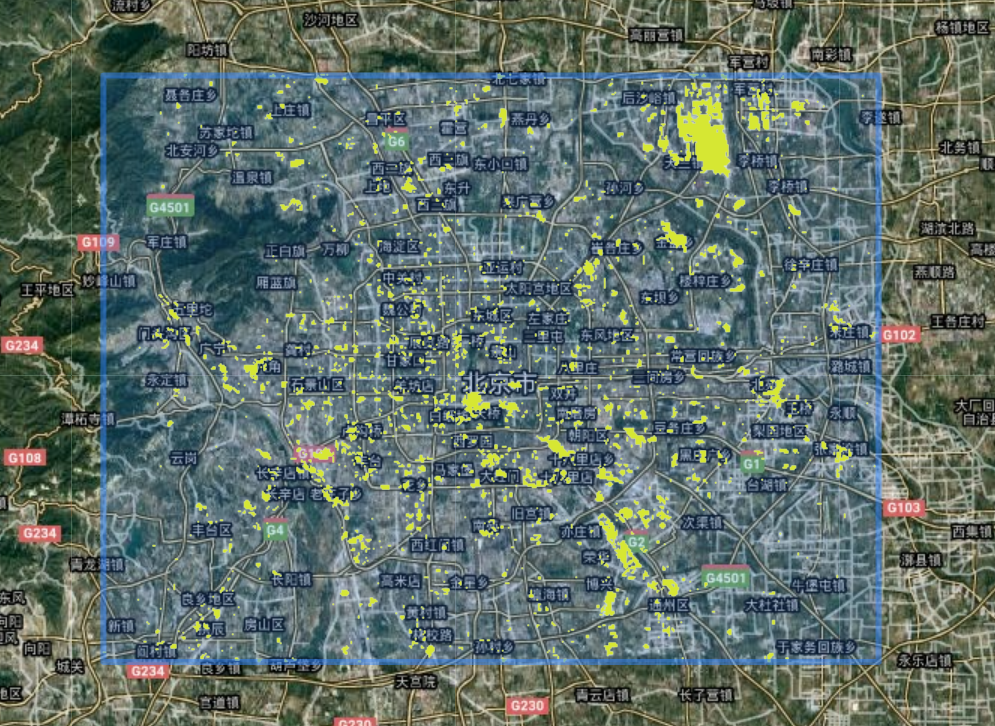
# The number of pixels in each area (patch) is counted according to the patch with a maximum number of 100 pixels around, which is connected in 8 directions
patchsize = hotspots.connectedPixelCount(100, True)
Map.addLayer(patchsize, {'palette':'yellow'}, 'patchsize')
Map
The results are as follows:
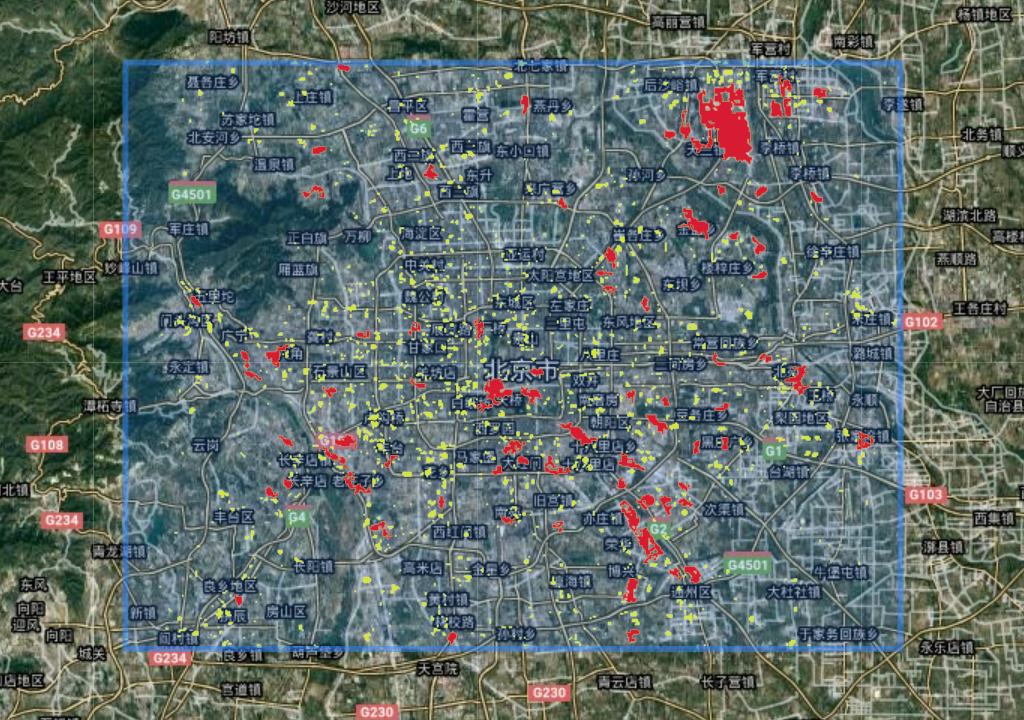
# Patch area
large_patches = patchsize.gt(20)
large_patches = large_patches.updateMask(large_patches)
Map.addLayer(large_patches, {'palette':'red'}, 'patches>4')
Map
The results are as follows:
4, Extraction of urban heat island area
- ee.Image.pixelArea()
Generate an image where the value of each pixel is the area of the pixel, in square meters. The returned image has a band called "area".

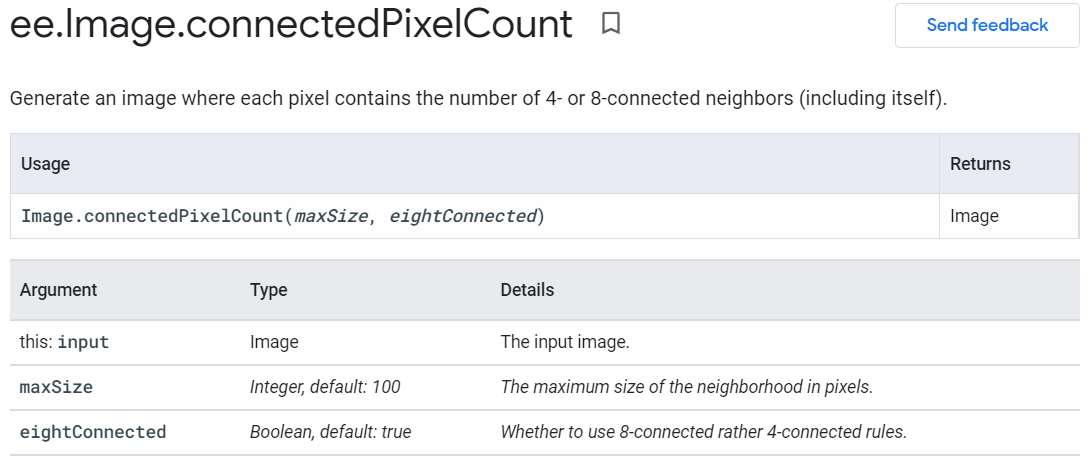
- ee.Image.connectedPixelCount()
Generate an image in which each pixel contains the number of 4 or 8 connected neighbors (including itself).
- ee.Image.connectedComponents()
Find connected components that have the same value as the first band entered, and mark them with globally unique values. Connectivity is specified by the given kernel. Objects larger than maxSize are treated as background and masked.

# Image domain mean smoothing
# Use the PixelArea() function to Generate an image in which the
# value of each pixel is the area of that pixel in square meters.
# The returned image has a single band called "area."
pixelAreaAllPatches = hotspots.multiply(ee.Image.pixelArea())
pixelAreaLargePatches = large_patches.multiply(ee.Image.pixelArea())
AreaAllPatches = pixelAreaAllPatches.reduceRegion(**{
    'reducer':ee.Reducer.sum(),
    'geometry':roi
})
AreaLargePatches = pixelAreaLargePatches.reduceRegion(**{
    'reducer':ee.Reducer.sum(),
    'geometry':roi
})

# Get area
print('All the pathches area:', AreaAllPatches.getInfo())
print('The large patches area:', AreaLargePatches.getInfo())
The results are as follows:
All the pathches area are: {'hotspots': 78300179.11268622}
The large patches area are: {'hotspots': 73151637.55642593}
5, Learning summary:
- Learned the analysis method of regional patches. Taking the urban heat island effect as an example, extract and analyze the urban heat island area and concentrated contiguous area to obtain its distribution range
- Master the analysis method of spatial area of raster image in GEE
reference resources:
- https://github.com/giswqs/earthengine-py-notebooks/blob/master/Image/image_patch_area.ipynb
- https://baike.baidu.com/item/%E7%83%AD%E5%B2%9B%E6%95%88%E5%BA%94/293720?fr=aladdin
- https://developers.google.com/earth-engine/apidocs/ee-image-connectedcomponents?hl=en