Unit 1: introduction to Google Earth engine
Authors: Peder Engelstad, Dan Carver
Updated may 2021
1 Introduction
In this module, we will discuss the following concepts:
- Define the main data types in Google Earth engine and how to use them.
- How to explore data sets and limit the output of specific research sites.
- How to visualize the difference of photosynthetic activities between landscapes before and after fire.
2 background
 Remote sensing can become a powerful tool for ecologists to understand research systems or regions of interest on a larger spatial scale. Remote sensing tools alone can not replace field work or physical collection of samples, but help to describe the characteristics of spatio-temporal landscape, so as to deepen our understanding of ecological processes.
There are many data sources available for downloading remote sensing data products, but collecting these data sets has long been a cumbersome and time-consuming task. Google Earth engine (GEE) eliminates the downloading, preprocessing and heavy computing environment involved in the traditional use of remote sensing data. Although optimized for "big data", gee is a flexible and transparent platform that can handle a variety of research areas from forestry to drought monitoring to crop mapping.
In this module, you will begin to explore the functions of GEE using data from the national agricultural imaging program (NAIP). NAIP data includes aerial images obtained during the agricultural growing season in the mainland of the United States. According to the given location and time range, NAIP images are collected in four bands: blue, green, red and near infrared. For more information about NAIP, see Click here .
3 start using Google Earth engine
Google Earth Engine is a Web-based platform that provides access to large geospatial databases (usually in grid format), and is a distributed computing environment on Google servers that allows you to quickly ask questions and develop testable workflows. However, GEE does need to register through a Google account. Therefore, you need to create an account / registration before continuing with this module. You can register on the GEE registration page Register and read more. After registering, navigate to code.earthengine.google.com , and then continue to learn the module.
3.1 browsing user interface
The following figure is what you will see when you visit the GEE home page for the first time. Listed below is a quick guide to the features we will regularly access in these modules. For a more detailed description of the entire user interface, click The icon in the upper right corner of the screen, and then click "function guide" from the drop-down menu.
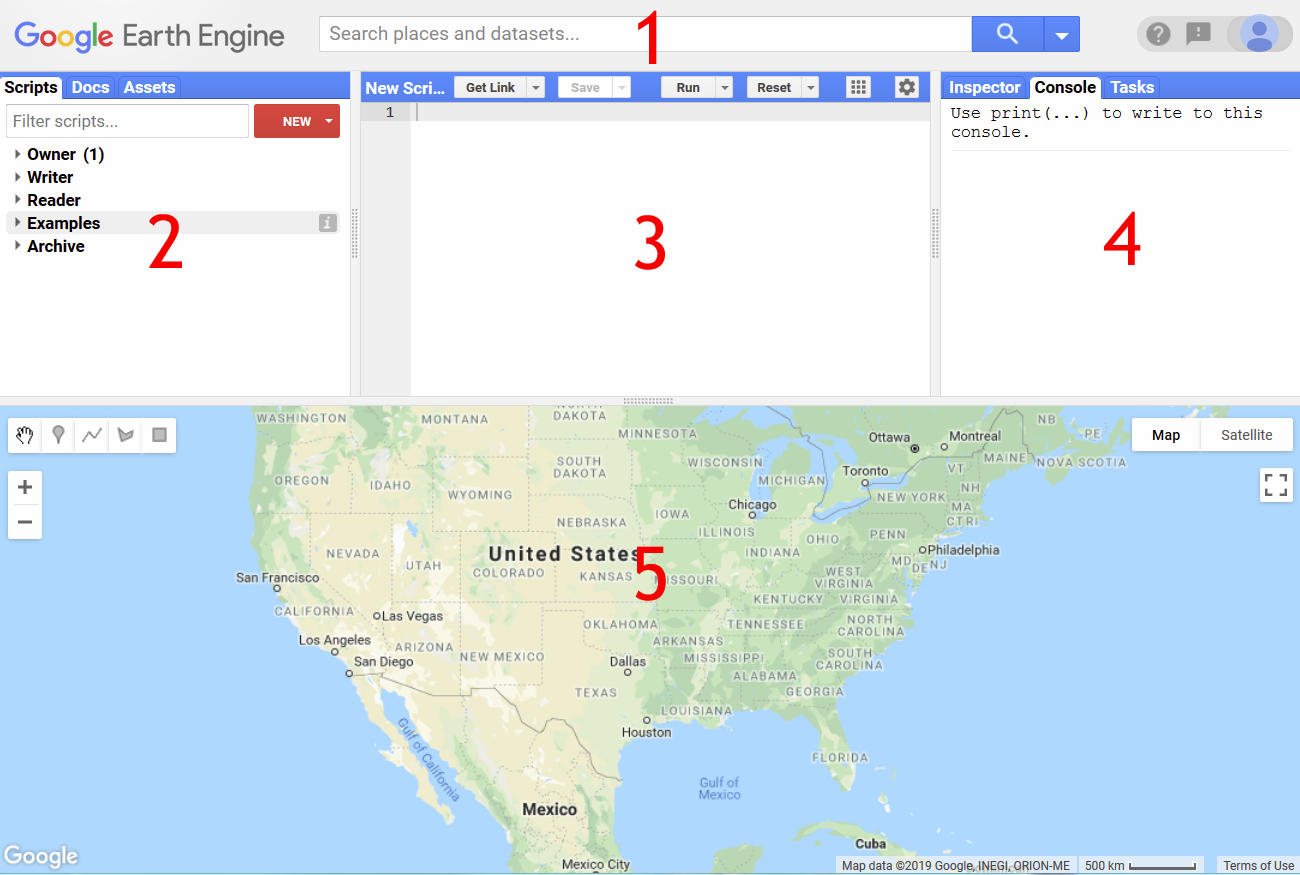
Google Earth engine interface. Follow the numbers below to understand the extended definition of each interactive part.
- Search bar
This is a convenient shortcut to the countless datasets available to GEE users. Searching for city names ("places") is a convenient way to zoom in to the desired geographic location.
- Left panel
Script
In this tab, any scripts you save are listed under owner. Clicking the name of a script opens its contents in the script editor pane. Fortunately, GEE provides a warning if there are any unsaved changes before opening a new script.
Documentation
In this tab, you will see a categorized list of available functions to use when scripting. Clicking a function name displays its definition and requirements. In the script editor, if you can only remember some function names, you can avoid finding it by calling up the suggestion list by pressing Ctrl space (CMD space on Mac).
Assets
All files you upload to GEE will be listed in this tab. Clicking a file name displays some basic information about the file and gives you the option to import, share, or delete it. More about assets will be in Module 4 Introduced in.
- Script editor
This is where magic happens! All GEE scripts are written in javascript (see Section 3.2) and can be activated by clicking the "run" button or pressing Ctrl enter (CMD enter on Mac). A reminder: be sure to keep it as early as possible and often. No auto save function!
- Right Panel
Inspector
Opening this tab changes our interaction with the Map Viewer. The mouse cursor changes to a crosshair, and clicking on the map allows us to sample data from a specific latitude and longitude. More about the inspector tab will be found in Module 3 Introduced in.
Console
This is the default tab when GEE loads and contains useful information about the data accessed in the script editor, as well as statistical printouts and error messages.
Mission
In this tab, we can track the progress of any data in the export / download queue. Module 4 More about moving data out of GEE will be introduced.
- Map Viewer
Finally, all our image visualizations will take place in this pane. The map runs in a similar way to Google maps, with GEE professional plug-ins, such as the ability to draw shapes and switch between visible or hidden layers.
3.2 JavaScript introduction
All scripts in the GEE code editor are written in JavaScript (JS). If you are not familiar with this programming language, please don't be afraid! JS has a lot of online resources, and GEE is actually quite relaxed about complying with all the rules. For example, the standard protocol for JS is semicolon (;) End each command. However, if you happen to forget one, gee will remind you when your code runs smoothly (often). For more details on the structure of JS and how to use it in Gee, Please click here.
3.3 data type: Grid
The main data type used in GEE is raster, which covers images from local to global scope, and images can be obtained from hundreds of satellite and aviation resources. To start writing your first script, copy the following code into the script editor pane. This code request is from NAIP Image collection Grid of. However, requesting a collection of images means that we can access all the data in the collection - much more than we actually need. Use this filterDate() function Modify our original collection and limit the number of images.
<span style="color:#333333"><span style="background-color:#ffffff"><span style="color:#333333"><span style="background-color:#f8f8f8"><code><span style="color:inherit"><span style="color:#8f5902"><em>// Call in NAIP imagery as an image collection.</em></span></span>
<span style="color:inherit"><span style="color:#204a87"><strong>var</strong></span> NAIP <span style="color:#ce5c00"><strong>=</strong></span> ee<span style="color:#ce5c00"><strong>.</strong></span><span style="color:#000000">ImageCollection</span>(<span style="color:#4e9a06">"USDA/NAIP/DOQQ"</span>)<span style="color:#ce5c00"><strong>;</strong></span></span>

<span style="color:inherit"><span style="color:#8f5902"><em>// Filter your dataset from the entire collection to the year of interest and extent.</em></span></span>
<span style="color:inherit"><span style="color:#204a87"><strong>var</strong></span> naip2011 <span style="color:#ce5c00"><strong>=</strong></span> NAIP</span>
<span style="color:inherit">  <span style="color:#ce5c00"><strong>.</strong></span><span style="color:#000000">filterDate</span>(<span style="color:#4e9a06">"2011-01-01"</span><span style="color:#ce5c00"><strong>,</strong></span> <span style="color:#4e9a06">"2011-12-31"</span>)<span style="color:#ce5c00"><strong>;</strong></span></span></code></span></span></span></span>
This code sets up a framework for displaying or running analysis of a part of the NAIP image set, but that's all. Until we provide GEE with an executable task, it will not do anything with this information. This means that nothing happens when you click Run. This is a bit confusing, but see GEE as a lazy software program. You can give it instructions, but it will defer execution until you request a deliverable.
3.3.1 viewing Grid Metadata
Now that we have loaded the NAIP image, we want to visualize it on the map. Since NAIP is collected as a series of images, we need to create multispectral images by defining the bands we want to use and visualize (more about Module 2 Band in). We set up Visual parameters And save them as variables to do this. But before we set the visualization parameters, we need to be able to reference the band by name. To retrieve this information, type "NAIP" in the search bar, and then click "NAIP: National Agricultural imaging program". The data set information should be displayed in the pop-up window as shown in the figure below.
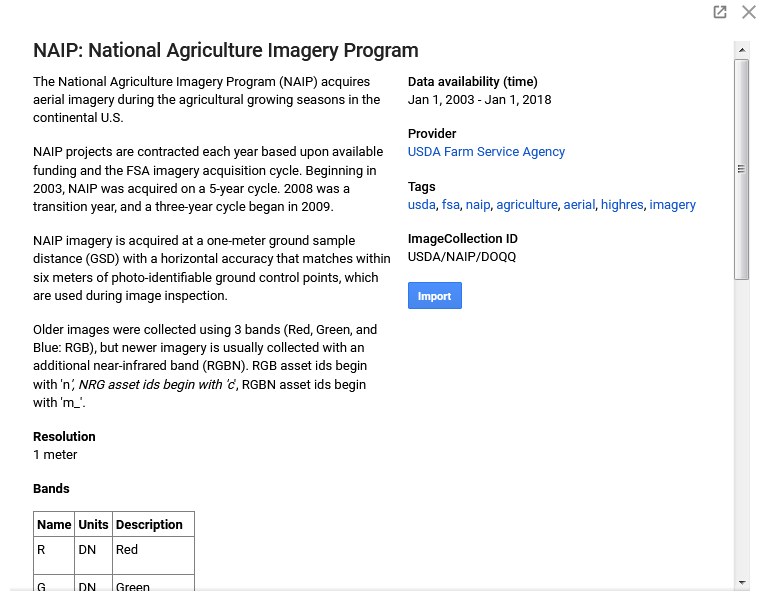
Click the name of the dataset in the search bar to view the NAIP metadata pop-up window.
3.3.2 defining visualization parameters
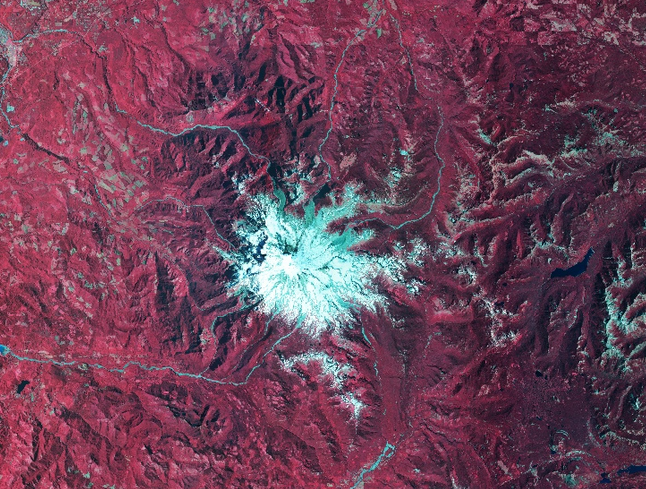
Now that we know the name of our band, we will add our image to our map viewer. True color images can be used to distinguish land cover types or physical objects on the landscape. The use of false color images in the near-infrared band can help identify areas of active photosynthesis (red) in the landscape. Because NAIP images are usually collected at high spatial resolution (1 meter), it takes a long time to view the entire United States in GEE. Therefore, it is a good idea to focus on a smaller geographical area.
Attach the following code to your existing script and click Run. Using the search bar, enter and select longfire, WA to zoom your map to Mount Rainier National Park. Your map viewer will look like the following image. Remember that you must open the layers tab in the map viewer and click the check box next to the layer you want to activate.
<span style="color:#333333"><span style="background-color:#ffffff"><span style="color:#333333"><span style="background-color:#f8f8f8"><code><span style="color:inherit"><span style="color:#8f5902"><em>// Define visualization parameters.</em></span></span>
<span style="color:inherit"><span style="color:#204a87"><strong>var</strong></span> visParamsFalse <span style="color:#ce5c00"><strong>=</strong></span> {<span style="color:#204a87">bands</span><span style="color:#ce5c00"><strong>:</strong></span>[<span style="color:#4e9a06">'N'</span><span style="color:#ce5c00"><strong>,</strong></span> <span style="color:#4e9a06">'R'</span><span style="color:#ce5c00"><strong>,</strong></span> <span style="color:#4e9a06">'G'</span>]}<span style="color:#ce5c00"><strong>;</strong></span></span>
<span style="color:inherit"><span style="color:#204a87"><strong>var</strong></span> visParamsTrue <span style="color:#ce5c00"><strong>=</strong></span> {<span style="color:#204a87">bands</span><span style="color:#ce5c00"><strong>:</strong></span>[<span style="color:#4e9a06">'R'</span><span style="color:#ce5c00"><strong>,</strong></span> <span style="color:#4e9a06">'G'</span><span style="color:#ce5c00"><strong>,</strong></span> <span style="color:#4e9a06">'B'</span>]}<span style="color:#ce5c00"><strong>;</strong></span></span>

<span style="color:inherit"><span style="color:#8f5902"><em>// Add 2011 imagery to the map with false color and true color composites</em></span></span>
<span style="color:inherit"><span style="color:#8f5902"><em>// here we specify either 'true; or 'false' in the third argument to toggle the layer to show automatically or to stay hidden when the code is exicuted. </em></span></span>
<span style="color:inherit">Map<span style="color:#ce5c00"><strong>.</strong></span><span style="color:#000000">addLayer</span>(naip2011<span style="color:#ce5c00"><strong>,</strong></span>visParamsFalse<span style="color:#ce5c00"><strong>,</strong></span> <span style="color:#4e9a06">"2011_false"</span><span style="color:#ce5c00"><strong>,</strong></span> <span style="color:#204a87"><strong>true</strong></span> )<span style="color:#ce5c00"><strong>;</strong></span></span>
<span style="color:inherit">Map<span style="color:#ce5c00"><strong>.</strong></span><span style="color:#000000">addLayer</span>(naip2011<span style="color:#ce5c00"><strong>,</strong></span>visParamsTrue<span style="color:#ce5c00"><strong>,</strong></span> <span style="color:#4e9a06">"2011_true"</span><span style="color:#ce5c00"><strong>,</strong></span> <span style="color:#204a87"><strong>false</strong></span> )<span style="color:#ce5c00"><strong>;</strong></span></span></code></span></span></span></span>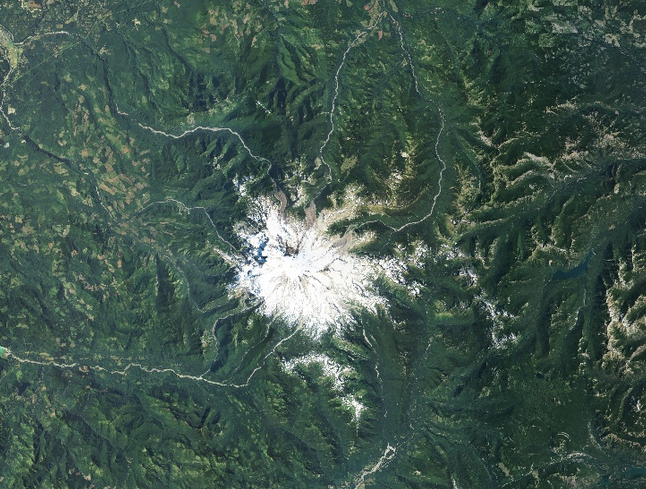
Side by side comparison of true and false color images of the 2011 NAIP collection in the Rainier mountain map viewer, Washington.
3.4 data type: vector
In other GIS and remote sensing systems, points, lines and polygons are usually classified as "vector" objects. In GEE, these data are called geometry . In general, you will be responsible for uploading or creating geometric features you want to use in GEE. You can manually create a region of interest (AOI) using any of the following techniques.
3.4.1 define areas of concern
To explore data in a specific geographic area, we can manually create AOI as geometric features in the GEE interface. It's as simple as selecting the geometry button (see figure below) and drawing a polygon to outline the area of interest. Complete the geometry by clicking the initial point.
When you complete a geometric feature by placing a point at the starting position, a new feature appears at the top of the script editor with the default name of geometry. This feature can now be used to limit the geographic scope of GEE scripts. This is a useful feature to help you get into the habit of using gee. By default, it handles the scope of the map viewer pane. The larger your range, the longer it takes to load the output!
Note: click the name to rename the geometry. To remove this feature, look at the top of the script and hover over the line of code that declares the geometric object. The trash can icon appears to the left of the line of code. Click the trash can you want to delete.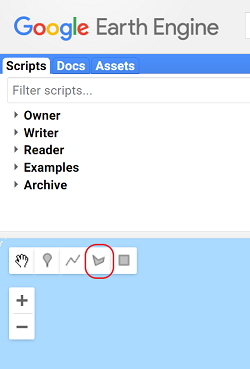
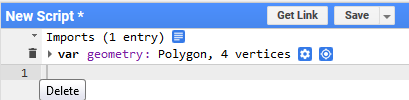
Highlight the polygon drawing tool (left) and successfully imported geometry (right).
Another way to limit the range of visual images is to use a set of latitude and longitude coordinates. In the figure below, we use this function to limit the image to Within the scope of High Park Fire. filterBounds() to avoid having to zoom in every time a script is loaded, we can also use the centerObject() function to automatically center the Map Viewer pane on our image at a predefined zoom level.
If you replace the code in section 3.3.2 with the following code and click Run, it will generate an image similar to the following figure. Please note that there is no semicolon after the line, filterDate() because we have not finished modifying the NAIP set.
<span style="color:#333333"><span style="background-color:#ffffff"><span style="color:#333333"><span style="background-color:#f8f8f8"><code><span style="color:inherit"><span style="color:#8f5902"><em>// Enter the desired coordinates for the upper left and lower right corners of your study area.</em></span></span>
<span style="color:inherit"><span style="color:#8f5902"><em>// You can find the lat long coordinates by using the inspector.</em></span></span>
<span style="color:inherit"><span style="color:#204a87"><strong>var</strong></span> bounds <span style="color:#ce5c00"><strong>=</strong></span> ee<span style="color:#ce5c00"><strong>.</strong></span><span style="color:#c4a000">Geometry</span><span style="color:#ce5c00"><strong>.</strong></span><span style="color:#000000">Rectangle</span>([[<span style="color:#ce5c00"><strong>-</strong></span><span style="color:#0000cf">105.53</span><span style="color:#ce5c00"><strong>,</strong></span><span style="color:#0000cf">40.75</span>]<span style="color:#ce5c00"><strong>,</strong></span>[<span style="color:#ce5c00"><strong>-</strong></span><span style="color:#0000cf">105.17</span><span style="color:#ce5c00"><strong>,</strong></span><span style="color:#0000cf">40.56</span>]])<span style="color:#ce5c00"><strong>;</strong></span></span>

<span style="color:inherit"><span style="color:#8f5902"><em>// Filter your dataset from the entire collection to the year of interest and extent</em></span></span>
<span style="color:inherit"><span style="color:#8f5902"><em>// and add the filterBounds function, moving the semicolon to the end of the statement.</em></span></span>
<span style="color:inherit"><span style="color:#204a87"><strong>var</strong></span> naip2011 <span style="color:#ce5c00"><strong>=</strong></span> NAIP</span>
<span style="color:inherit">  <span style="color:#ce5c00"><strong>.</strong></span><span style="color:#000000">filterDate</span>(<span style="color:#4e9a06">"2011-01-01"</span><span style="color:#ce5c00"><strong>,</strong></span> <span style="color:#4e9a06">"2011-10-31"</span>)</span>
<span style="color:inherit">  <span style="color:#ce5c00"><strong>.</strong></span><span style="color:#000000">filterBounds</span>(bounds)<span style="color:#ce5c00"><strong>;</strong></span></span>

<span style="color:inherit"><span style="color:#8f5902"><em>// Define visualization parameters.</em></span></span>
<span style="color:inherit"><span style="color:#204a87"><strong>var</strong></span> visParamsFalse <span style="color:#ce5c00"><strong>=</strong></span> {<span style="color:#204a87">bands</span><span style="color:#ce5c00"><strong>:</strong></span>[<span style="color:#4e9a06">'N'</span><span style="color:#ce5c00"><strong>,</strong></span> <span style="color:#4e9a06">'R'</span><span style="color:#ce5c00"><strong>,</strong></span> <span style="color:#4e9a06">'G'</span>]}<span style="color:#ce5c00"><strong>;</strong></span></span>
<span style="color:inherit"><span style="color:#204a87"><strong>var</strong></span> visParamsTrue <span style="color:#ce5c00"><strong>=</strong></span> {<span style="color:#204a87">bands</span><span style="color:#ce5c00"><strong>:</strong></span>[<span style="color:#4e9a06">'R'</span><span style="color:#ce5c00"><strong>,</strong></span> <span style="color:#4e9a06">'G'</span><span style="color:#ce5c00"><strong>,</strong></span> <span style="color:#4e9a06">'B'</span>]}<span style="color:#ce5c00"><strong>;</strong></span></span>

<span style="color:inherit"><span style="color:#8f5902"><em>// Add 2011 imagery to the map with false color and true color composites.</em></span></span>
<span style="color:inherit">Map<span style="color:#ce5c00"><strong>.</strong></span><span style="color:#000000">addLayer</span>(naip2011<span style="color:#ce5c00"><strong>,</strong></span>visParamsFalse<span style="color:#ce5c00"><strong>,</strong></span><span style="color:#4e9a06">"2011_false"</span><span style="color:#ce5c00"><strong>,</strong></span> <span style="color:#204a87"><strong>false</strong></span> )<span style="color:#ce5c00"><strong>;</strong></span></span>
<span style="color:inherit">Map<span style="color:#ce5c00"><strong>.</strong></span><span style="color:#000000">addLayer</span>(naip2011<span style="color:#ce5c00"><strong>,</strong></span>visParamsTrue<span style="color:#ce5c00"><strong>,</strong></span><span style="color:#4e9a06">"2011_true"</span><span style="color:#ce5c00"><strong>,</strong></span> <span style="color:#204a87"><strong>false</strong></span> )<span style="color:#ce5c00"><strong>;</strong></span></span>

<span style="color:inherit">Map<span style="color:#ce5c00"><strong>.</strong></span><span style="color:#000000">centerObject</span>(naip2011<span style="color:#ce5c00"><strong>,</strong></span> <span style="color:#0000cf">11</span>)<span style="color:#ce5c00"><strong>;</strong></span></span></code></span></span></span></span>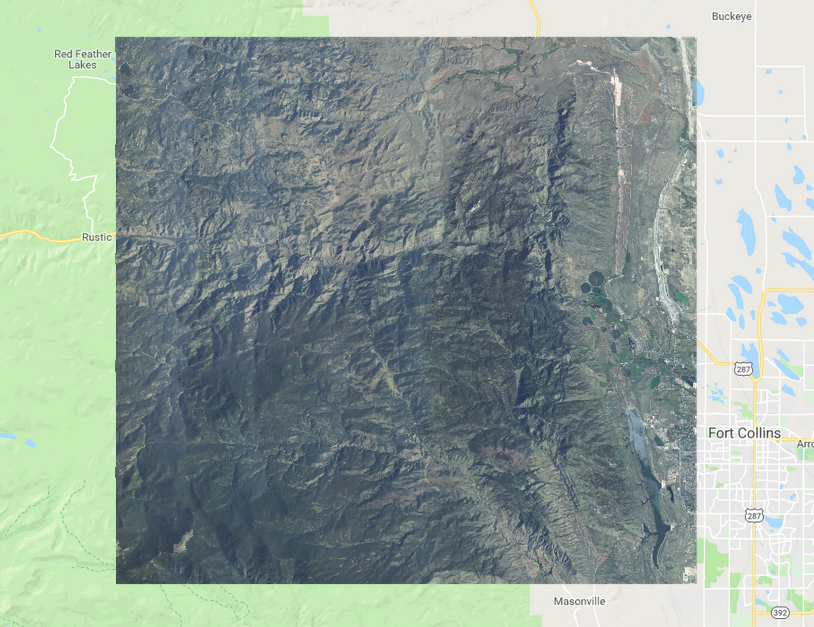
The EE geometry. The rectangle () object successfully delimited the scope of our NAIP image.
3.5 put everything together
Using the NAIP data we visualized in this module, we are ready to perform this introductory analysis using GEE. By adding additional NAIP data subsets to our code, we can intuitively compare the vegetation regeneration inside and outside the boundary of High Park Fire. Running the following code, we found that although the true color image is helpful, the false color image (shown below) allows us to easily distinguish between areas with low photosynthetic activity (higher burn severity) and areas with relatively constant photosynthetic activity (low severity or unburned).
<span style="color:#333333"><span style="background-color:#ffffff"><span style="color:#333333"><span style="background-color:#f8f8f8"><code><span style="color:inherit"><span style="color:#204a87"><strong>var</strong></span> naip2013 <span style="color:#ce5c00"><strong>=</strong></span> NAIP</span>
<span style="color:inherit">  <span style="color:#ce5c00"><strong>.</strong></span><span style="color:#000000">filterDate</span>(<span style="color:#4e9a06">"2013-01-01"</span><span style="color:#ce5c00"><strong>,</strong></span> <span style="color:#4e9a06">"2013-12-31"</span>)</span>
<span style="color:inherit">  <span style="color:#ce5c00"><strong>.</strong></span><span style="color:#000000">filterBounds</span>(bounds)<span style="color:#ce5c00"><strong>;</strong></span></span>

<span style="color:inherit"><span style="color:#8f5902"><em>// add 2013 imagery to the map with false color and true color composites</em></span></span>
<span style="color:inherit">Map<span style="color:#ce5c00"><strong>.</strong></span><span style="color:#000000">addLayer</span>(naip2013<span style="color:#ce5c00"><strong>,</strong></span> visParamsFalse<span style="color:#ce5c00"><strong>,</strong></span> <span style="color:#4e9a06">"2013_false"</span><span style="color:#ce5c00"><strong>,</strong></span> <span style="color:#204a87"><strong>false</strong></span> )<span style="color:#ce5c00"><strong>;</strong></span></span>
<span style="color:inherit">Map<span style="color:#ce5c00"><strong>.</strong></span><span style="color:#000000">addLayer</span>(naip2013<span style="color:#ce5c00"><strong>,</strong></span> visParamsTrue<span style="color:#ce5c00"><strong>,</strong></span> <span style="color:#4e9a06">"2013_true"</span><span style="color:#ce5c00"><strong>,</strong></span> <span style="color:#204a87"><strong>false</strong></span> )<span style="color:#ce5c00"><strong>;</strong></span></span></code></span></span></span></span>
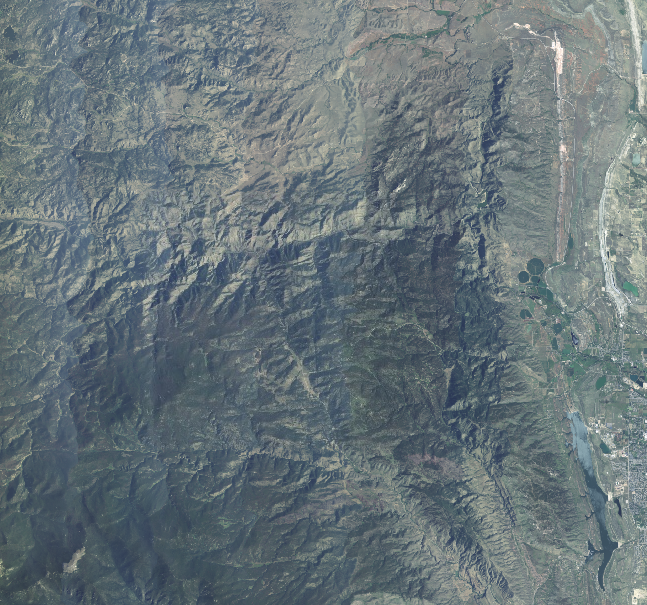
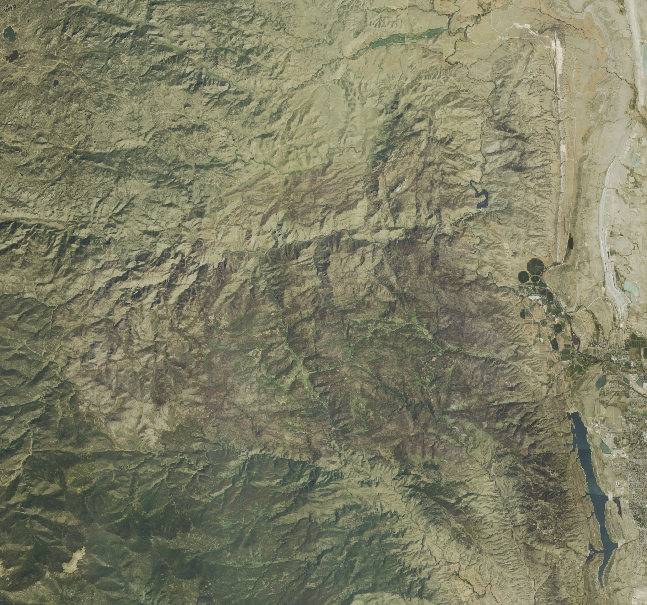
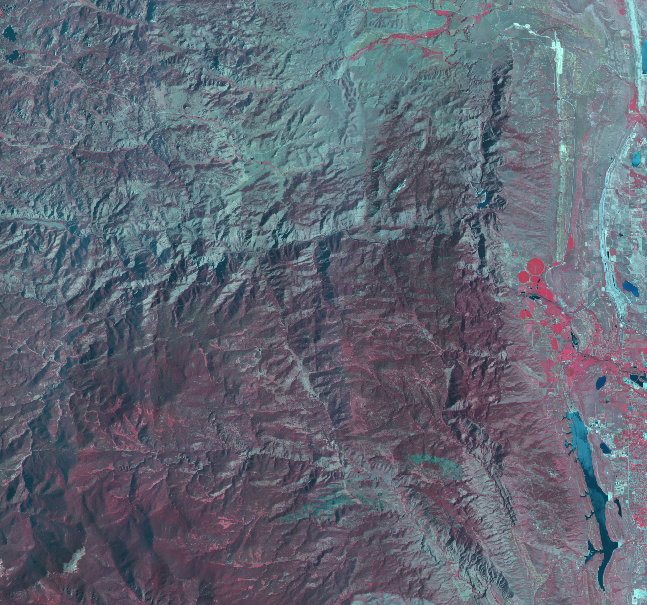
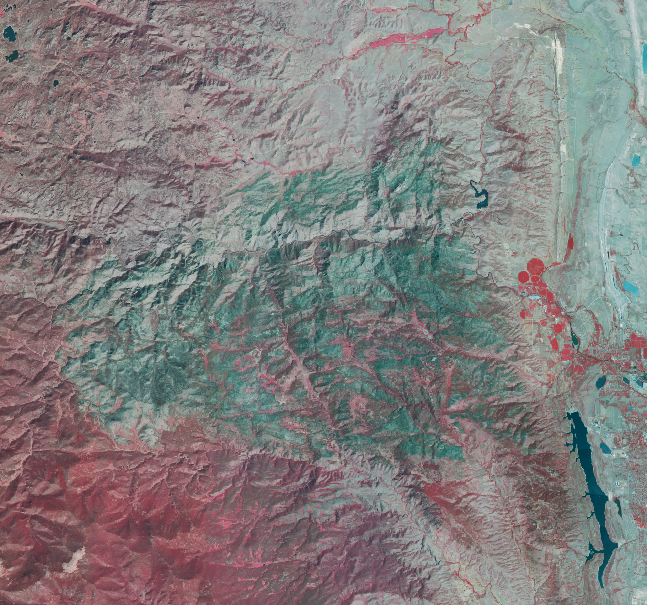
The true color NAIP images in 2011 (upper left) and 2013 (upper right) are compared with the false color images in 2011 (lower left) and 2013 (lower right).
However, the practicability of NAIP images is not limited to large-scale analysis. Zoom in to the smaller area of High Park Fire (shown below) and we can see that due to the high resolution of the data set, the degree of burn can be evaluated in a very small range.
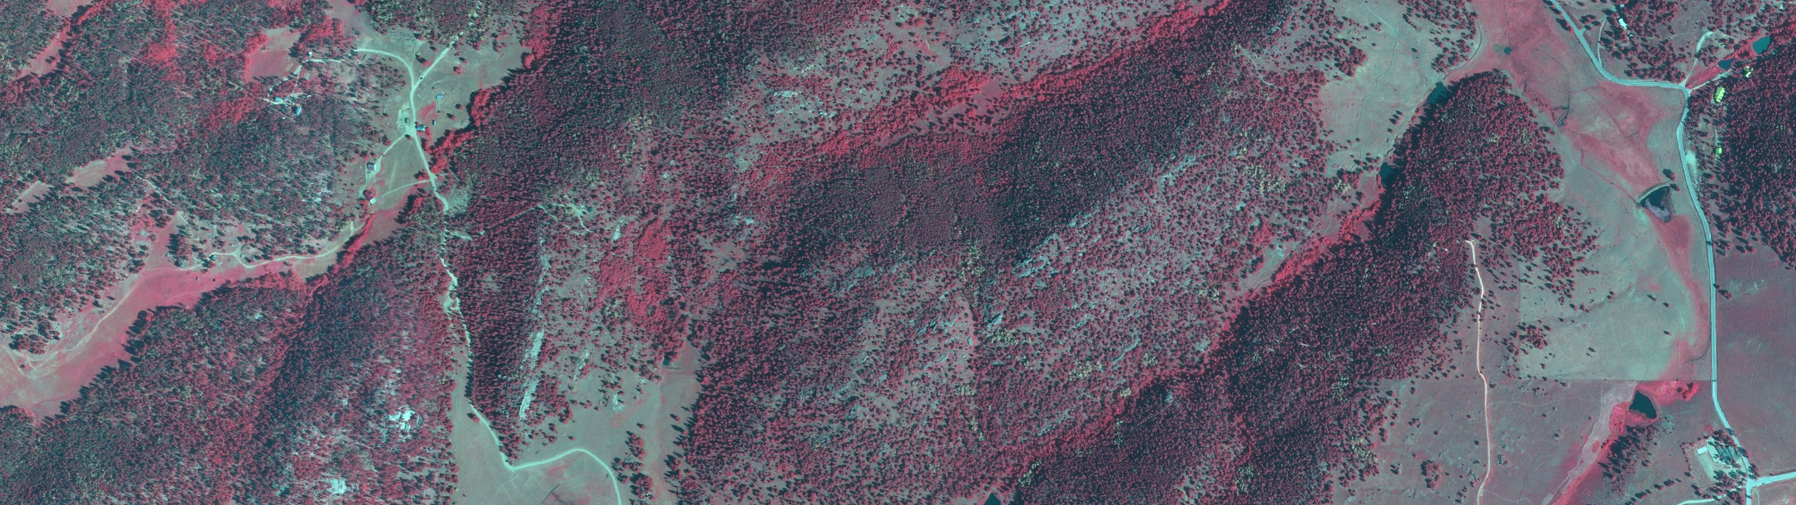
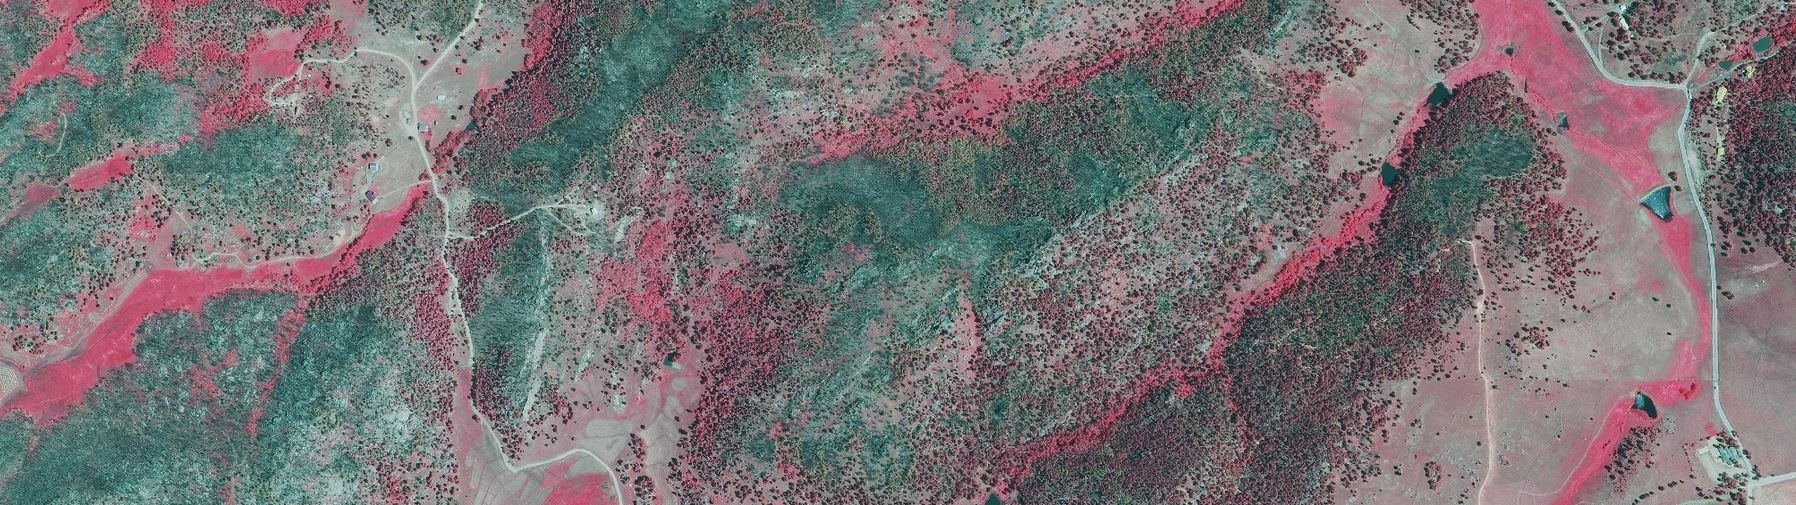
Take a closer look at the level of detail available through NAIP images. Individual trees can be clearly seen in the image (top) in 2011, while there are still trees that survived the fire in the image (bottom) in 2013.
4 Conclusion
In this unit, we introduce Google Earth engine as a powerful tool for ecologists to use remote sensing data. Then, we define the interactive elements of Google Earth engine user interface. Finally, we briefly explored NAIP images to see the landscape scale differences before and after the high park fire in Northern Colorado.
5 complete code
<span style="color:#333333"><span style="background-color:#ffffff"><span style="color:#333333"><span style="background-color:#f8f8f8"><code><span style="color:inherit"><span style="color:#8f5902"><em>// Call in NAIP imagery as an image collection.</em></span></span>
<span style="color:inherit"><span style="color:#204a87"><strong>var</strong></span> NAIP <span style="color:#ce5c00"><strong>=</strong></span> ee<span style="color:#ce5c00"><strong>.</strong></span><span style="color:#000000">ImageCollection</span>(<span style="color:#4e9a06">"USDA/NAIP/DOQQ"</span>)<span style="color:#ce5c00"><strong>;</strong></span></span>

<span style="color:inherit"><span style="color:#8f5902"><em>// Enter the desired coordinates for the upper left and lower right corners of your study area.</em></span></span>
<span style="color:inherit"><span style="color:#204a87"><strong>var</strong></span> bounds <span style="color:#ce5c00"><strong>=</strong></span> ee<span style="color:#ce5c00"><strong>.</strong></span><span style="color:#c4a000">Geometry</span><span style="color:#ce5c00"><strong>.</strong></span><span style="color:#000000">Rectangle</span>([[<span style="color:#ce5c00"><strong>-</strong></span><span style="color:#0000cf">105.53</span><span style="color:#ce5c00"><strong>,</strong></span><span style="color:#0000cf">40.75</span>]<span style="color:#ce5c00"><strong>,</strong></span>[<span style="color:#ce5c00"><strong>-</strong></span><span style="color:#0000cf">105.17</span><span style="color:#ce5c00"><strong>,</strong></span><span style="color:#0000cf">40.56</span>]])<span style="color:#ce5c00"><strong>;</strong></span></span>

<span style="color:inherit"><span style="color:#8f5902"><em>// Filter your dataset from the entire collection to the year of interest and extent.</em></span></span>
<span style="color:inherit"><span style="color:#204a87"><strong>var</strong></span> naip2011 <span style="color:#ce5c00"><strong>=</strong></span> NAIP</span>
<span style="color:inherit">  <span style="color:#ce5c00"><strong>.</strong></span><span style="color:#000000">filterDate</span>(<span style="color:#4e9a06">"2011-01-01"</span><span style="color:#ce5c00"><strong>,</strong></span> <span style="color:#4e9a06">"2011-12-31"</span>)</span>
<span style="color:inherit">  <span style="color:#ce5c00"><strong>.</strong></span><span style="color:#000000">filterBounds</span>(bounds)<span style="color:#ce5c00"><strong>;</strong></span></span>

<span style="color:inherit"><span style="color:#8f5902"><em>// Define visualization parameters.</em></span></span>
<span style="color:inherit"><span style="color:#204a87"><strong>var</strong></span> visParamsFalse <span style="color:#ce5c00"><strong>=</strong></span> {<span style="color:#204a87">bands</span><span style="color:#ce5c00"><strong>:</strong></span>[<span style="color:#4e9a06">'N'</span><span style="color:#ce5c00"><strong>,</strong></span> <span style="color:#4e9a06">'R'</span><span style="color:#ce5c00"><strong>,</strong></span> <span style="color:#4e9a06">'G'</span>]}<span style="color:#ce5c00"><strong>;</strong></span></span>
<span style="color:inherit"><span style="color:#204a87"><strong>var</strong></span> visParamsTrue <span style="color:#ce5c00"><strong>=</strong></span> {<span style="color:#204a87">bands</span><span style="color:#ce5c00"><strong>:</strong></span>[<span style="color:#4e9a06">'R'</span><span style="color:#ce5c00"><strong>,</strong></span> <span style="color:#4e9a06">'G'</span><span style="color:#ce5c00"><strong>,</strong></span> <span style="color:#4e9a06">'B'</span>]}<span style="color:#ce5c00"><strong>;</strong></span></span>

<span style="color:inherit"><span style="color:#8f5902"><em>// Add 2011 imagery to the map with false color and true color composites.</em></span></span>
<span style="color:inherit">Map<span style="color:#ce5c00"><strong>.</strong></span><span style="color:#000000">addLayer</span>(naip2011<span style="color:#ce5c00"><strong>,</strong></span>visParamsFalse<span style="color:#ce5c00"><strong>,</strong></span><span style="color:#4e9a06">"2011_false"</span><span style="color:#ce5c00"><strong>,</strong></span> <span style="color:#204a87"><strong>false</strong></span> )<span style="color:#ce5c00"><strong>;</strong></span></span>
<span style="color:inherit">Map<span style="color:#ce5c00"><strong>.</strong></span><span style="color:#000000">addLayer</span>(naip2011<span style="color:#ce5c00"><strong>,</strong></span>visParamsTrue<span style="color:#ce5c00"><strong>,</strong></span><span style="color:#4e9a06">"2011_true"</span><span style="color:#ce5c00"><strong>,</strong></span> <span style="color:#204a87"><strong>false</strong></span> )<span style="color:#ce5c00"><strong>;</strong></span></span>

<span style="color:inherit">Map<span style="color:#ce5c00"><strong>.</strong></span><span style="color:#000000">centerObject</span>(naip2011<span style="color:#ce5c00"><strong>,</strong></span> <span style="color:#0000cf">11</span>)<span style="color:#ce5c00"><strong>;</strong></span></span>

<span style="color:inherit"><span style="color:#8f5902"><em>// Add 2013 imagery to the map with false color and true color composites.</em></span></span>
<span style="color:inherit"><span style="color:#204a87"><strong>var</strong></span> naip2013 <span style="color:#ce5c00"><strong>=</strong></span> NAIP</span>
<span style="color:inherit">  <span style="color:#ce5c00"><strong>.</strong></span><span style="color:#000000">filterDate</span>(<span style="color:#4e9a06">"2013-01-01"</span><span style="color:#ce5c00"><strong>,</strong></span> <span style="color:#4e9a06">"2013-12-31"</span>)</span>
<span style="color:inherit">  <span style="color:#ce5c00"><strong>.</strong></span><span style="color:#000000">filterBounds</span>(bounds)<span style="color:#ce5c00"><strong>;</strong></span></span>

<span style="color:inherit"><span style="color:#8f5902"><em>// Add 2013 imagery to the map with false color and true color composites.</em></span></span>
<span style="color:inherit">Map<span style="color:#ce5c00"><strong>.</strong></span><span style="color:#000000">addLayer</span>(naip2013<span style="color:#ce5c00"><strong>,</strong></span>visParamsFalse<span style="color:#ce5c00"><strong>,</strong></span><span style="color:#4e9a06">"2013_false"</span><span style="color:#ce5c00"><strong>,</strong></span> <span style="color:#204a87"><strong>false</strong></span> )<span style="color:#ce5c00"><strong>;</strong></span></span>
<span style="color:inherit">Map<span style="color:#ce5c00"><strong>.</strong></span><span style="color:#000000">addLayer</span>(naip2013<span style="color:#ce5c00"><strong>,</strong></span>visParamsTrue<span style="color:#ce5c00"><strong>,</strong></span><span style="color:#4e9a06">"2013_true"</span><span style="color:#ce5c00"><strong>,</strong></span> <span style="color:#204a87"><strong>false</strong></span> )<span style="color:#ce5c00"><strong>;</strong></span></span></code></span></span></span></span>
6 vocabulary and abbreviations
AOI: region of interest
GEE: Google Earth engine
JS: JavaScript
NAIP: National Agricultural imaging program