Unit 8: time series analysis in Google Earth engine
1 Introduction
In this module, we will discuss the following concepts:
-
Process remote sensing images of the ocean.
-
Create a video from an image time series.
-
Time series analysis in GEE.
-
Add basic elements to the graphical user interface.
2 background
The Deepwater Horizon oil spill is considered to be the largest accidental offshore oil spill in history. The well released more than 4.9 million barrels of oil, of which 4.1 million barrels entered the Gulf of Mexico between April 20 and July 15, 2010. By burning or skimming the oil on the ocean surface and by releasing more than 1.84 million gallons of chemical dispersant (Corexit) on the ocean surface and directly into the oil flow discharged by the oil well about 5000 feet below the ocean surface. Even with these efforts, the oil spill has seriously affected the coastal and marine ecosystems of the Gulf. Despite extensive efforts to assess the impact of oil on these ecosystems, the large area affected by the spill makes it difficult. In this module, we will explore the ecological impact of the oil spill by monitoring the change trend of algae concentration with time in the area highly affected by the oil spill. Since algae are the main producers of marine ecosystems, monitoring how their populations are affected by such changes may help us better understand the overall impact of oil on the state of affected ecosystems.
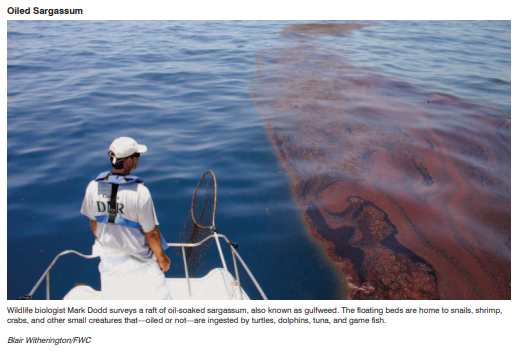
A wildlife biologist is observing oil soaked Sargassum, Sargassum. This represents the loss of habitat for many small marine organisms. Source: US National Response Team
3. GEE trend analysis
3.1 remote sensing direct monitoring of oil products
The ability of remote sensing to detect oil directly is limited. This is because oil reflects light in much the same way as water does. However, oil does affect the surface roughness of water. Areas with high oil concentrations can make the ocean surface smooth. Therefore, after the Deepwater Horizon spill, most of the remote sensing work of detecting oil involves airborne radar, which is an active sensor that can capture surface texture. Unfortunately, these data are not available in GEE. Although passive sensors are not suitable for directly detecting oil on the water surface, remote sensing professionals from NASA MODIS rapid response team use the smooth quality of oil to detect it in a very smart way.
3.2 sunshine
According to the relationship between the solar angle and the sensor, the water surface can effectively act as a mirror to directly reflect most of the light back to the sensor. This process is called sunglint, which is a consistent challenge in processing remote sensing water images. Sunglit effectively changes all the data of the surface it covers, because the energy reaching the sensor is only the direct reflection of sunlight, not based on the subset of light absorbed and reflected by the surface. We know that oil has the ability to smooth the water surface. When this happens in sunny areas, the oil covered surface reflects more light than water alone. This means that in sunny areas, oil is brighter than water. The following figure, captured by Aqua MODIS sensor, clearly shows the degree of oil contamination 35 days after the first release of oil from the Deepwater Horizon spill. The upper left corner is the Mississippi River Delta.
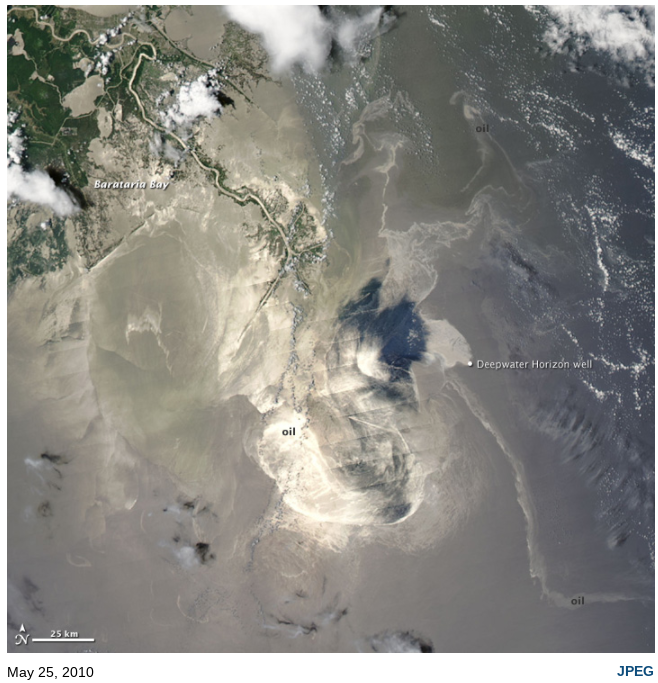
An image of a sunny area containing a large amount of surface oil. When you are away from the center of the sunlight (right side of the image), you can observe the change of reflectivity of the oil. Credit: NASA Earth Observatory
Because we know the sensor (MODIS) and date, let's try to copy this image in GEE.
<span style="color:#333333"><span style="background-color:#ffffff"><span style="color:#333333"><span style="background-color:#f8f8f8"><code><span style="color:inherit"><span style="color:#8f5902"><em>// A point representing the general location of deepwater horizon oil rig.</em></span></span>
<span style="color:inherit"><span style="color:#204a87"><strong>var</strong></span> dw <span style="color:#ce5c00"><strong>=</strong></span> ee<span style="color:#ce5c00"><strong>.</strong></span><span style="color:#c4a000">Geometry</span><span style="color:#ce5c00"><strong>.</strong></span><span style="color:#000000">Point</span>([<span style="color:#ce5c00"><strong>-</strong></span><span style="color:#0000cf">88.36555556</span><span style="color:#ce5c00"><strong>,</strong></span><span style="color:#0000cf">28.73805556</span>])<span style="color:#ce5c00"><strong>;</strong></span></span>

<span style="color:inherit"><span style="color:#8f5902"><em>// Pull in MODIS Aqua imagery and visualize the sunglint oil.</em></span></span>
<span style="color:inherit"><span style="color:#204a87"><strong>var</strong></span> mod2 <span style="color:#ce5c00"><strong>=</strong></span> ee<span style="color:#ce5c00"><strong>.</strong></span><span style="color:#000000">ImageCollection</span>(<span style="color:#4e9a06">"MODIS/006/MYD09GA"</span>)</span>
<span style="color:inherit">  <span style="color:#ce5c00"><strong>.</strong></span><span style="color:#000000">filterDate</span>(<span style="color:#4e9a06">"2010-05-25"</span><span style="color:#ce5c00"><strong>,</strong></span><span style="color:#4e9a06">"2010-05-26"</span>)<span style="color:#ce5c00"><strong>;</strong></span></span>

<span style="color:inherit"><span style="color:#8f5902"><em>// Add to map.</em></span></span>
<span style="color:inherit">Map<span style="color:#ce5c00"><strong>.</strong></span><span style="color:#000000">addLayer</span>(mod2<span style="color:#ce5c00"><strong>,</strong></span> {<span style="color:#204a87">bands</span><span style="color:#ce5c00"><strong>:</strong></span> [<span style="color:#4e9a06">"sur_refl_b01"</span><span style="color:#ce5c00"><strong>,</strong></span><span style="color:#4e9a06">"sur_refl_b04"</span><span style="color:#ce5c00"><strong>,</strong></span><span style="color:#4e9a06">"sur_refl_b03"</span>]<span style="color:#ce5c00"><strong>,</strong></span></span>
<span style="color:inherit"><span style="color:#204a87">gamma</span><span style="color:#ce5c00"><strong>:</strong></span> <span style="color:#0000cf">1</span><span style="color:#ce5c00"><strong>,</strong></span></span>
<span style="color:inherit"><span style="color:#204a87">max</span><span style="color:#ce5c00"><strong>:</strong></span> <span style="color:#0000cf">10278.86</span><span style="color:#ce5c00"><strong>,</strong></span></span>
<span style="color:inherit"><span style="color:#204a87">min</span><span style="color:#ce5c00"><strong>:</strong></span> <span style="color:#0000cf">192.14000000000001</span><span style="color:#ce5c00"><strong>,</strong></span></span>
<span style="color:inherit"><span style="color:#204a87">opacity</span><span style="color:#ce5c00"><strong>:</strong></span> <span style="color:#0000cf">1</span>}<span style="color:#ce5c00"><strong>,</strong></span> <span style="color:#4e9a06">"mod2"</span>)<span style="color:#ce5c00"><strong>;</strong></span></span>

<span style="color:inherit"><span style="color:#8f5902"><em>// Add Deepwater Horizon location to map.</em></span></span>
<span style="color:inherit">Map<span style="color:#ce5c00"><strong>.</strong></span><span style="color:#000000">addLayer</span>(dw<span style="color:#ce5c00"><strong>,</strong></span>{}<span style="color:#ce5c00"><strong>,</strong></span><span style="color:#4e9a06">"DWH"</span>)<span style="color:#ce5c00"><strong>;</strong></span></span>
<span style="color:inherit"><span style="color:#8f5902"><em>// Set map to center on deep water horizon location</em></span></span>
<span style="color:inherit">Map<span style="color:#ce5c00"><strong>.</strong></span><span style="color:#000000">setCenter</span>(<span style="color:#ce5c00"><strong>-</strong></span><span style="color:#0000cf">88.36555556</span><span style="color:#ce5c00"><strong>,</strong></span><span style="color:#0000cf">28.73805556</span><span style="color:#ce5c00"><strong>,</strong></span> <span style="color:#0000cf">8</span>)<span style="color:#ce5c00"><strong>;</strong></span></span></code></span></span></span></span>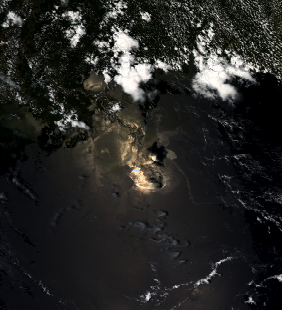
Copy of MODIS Image created in GEE above. You can adjust the Gamma to brighten the image slightly.
This picture shows that in the first month of the spill, oil has spread widely. In GEE, MODIS images can be used to preprocess the surface reflectance level. For more information about when surface reflectance images should be used, see Module 5 Although this is very useful for comparison over time, it means that some elements with very high reflectivity values in the image are actually masked as part of image preprocessing. This includes the sunscreen area in the figure above. Considering this, it is not feasible to make a robust quantitative evaluation of oil range based on MODIS Image. Nevertheless, this is a compelling picture that can be used to stimulate interest in the story of one of the largest environmental disasters in American history. The oil spill, which lasted more than 100 days, was a major ecological disaster, killing 11 people.
Although not very clear, the following figure also shows the smoke visible the day after the initial explosion. The Deepwater Horizon rig burned for two days before sinking to the seabed.
<span style="color:#333333"><span style="background-color:#ffffff"><span style="color:#333333"><span style="background-color:#f8f8f8"><code><span style="color:inherit"><span style="color:#8f5902"><em>// Pull in MODIS aqua imagery and filter for specific date.</em></span></span>
<span style="color:inherit"><span style="color:#204a87"><strong>var</strong></span> smokePlume <span style="color:#ce5c00"><strong>=</strong></span> ee<span style="color:#ce5c00"><strong>.</strong></span><span style="color:#000000">ImageCollection</span>(<span style="color:#4e9a06">"MODIS/006/MYD09GA"</span>)</span>
<span style="color:inherit">  <span style="color:#ce5c00"><strong>.</strong></span><span style="color:#000000">filterDate</span>(<span style="color:#4e9a06">"2010-04-21"</span><span style="color:#ce5c00"><strong>,</strong></span><span style="color:#4e9a06">"2010-04-22"</span>)<span style="color:#ce5c00"><strong>;</strong></span></span>

<span style="color:inherit"><span style="color:#8f5902"><em>// Add to map.</em></span></span>
<span style="color:inherit">Map<span style="color:#ce5c00"><strong>.</strong></span><span style="color:#000000">addLayer</span>(smokePlume<span style="color:#ce5c00"><strong>,</strong></span> {<span style="color:#204a87">bands</span><span style="color:#ce5c00"><strong>:</strong></span> [<span style="color:#4e9a06">"sur_refl_b01"</span><span style="color:#ce5c00"><strong>,</strong></span><span style="color:#4e9a06">"sur_refl_b04"</span><span style="color:#ce5c00"><strong>,</strong></span><span style="color:#4e9a06">"sur_refl_b03"</span>]<span style="color:#ce5c00"><strong>,</strong></span></span>
<span style="color:inherit"><span style="color:#204a87">gamma</span><span style="color:#ce5c00"><strong>:</strong></span> <span style="color:#0000cf">1.32</span><span style="color:#ce5c00"><strong>,</strong></span></span>
<span style="color:inherit"><span style="color:#204a87">max</span><span style="color:#ce5c00"><strong>:</strong></span> <span style="color:#0000cf">3278.86</span><span style="color:#ce5c00"><strong>,</strong></span></span>
<span style="color:inherit"><span style="color:#204a87">min</span><span style="color:#ce5c00"><strong>:</strong></span> <span style="color:#0000cf">192.14000000000001</span><span style="color:#ce5c00"><strong>,</strong></span></span>
<span style="color:inherit"><span style="color:#204a87">opacity</span><span style="color:#ce5c00"><strong>:</strong></span> <span style="color:#0000cf">1</span>}<span style="color:#ce5c00"><strong>,</strong></span> <span style="color:#4e9a06">"smokePlume"</span>)<span style="color:#ce5c00"><strong>;</strong></span></span></code></span></span></span></span>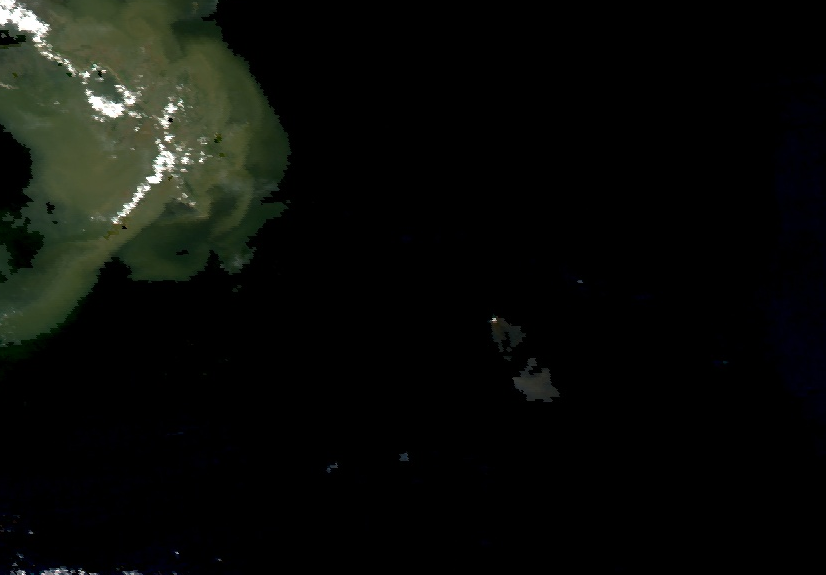
Although not the best image, the sediment rich outlet of the Mississippi River, the lighter area of the southeast ocean is the smoke generated by the burning Deepwater Horizon oil drilling platform.
This image has a lot of qualitative value. In order to quickly obtain this, we will make a time-lapse film of MODIS Image during the active oil spill.
4 landscape change video
Gee was originally a project to develop a global cloudless mosaic using Landsat images. The product becomes the basic map of Google Earth. After creating cloud free splicing, the next product produced using GEE infrastructure is delayed video of major landscape changes. These videos are fascinating and provide frightening descriptions of the dramatic changes taking place on the surface of our planet. Take a few minutes to see some prefabricated ones example It's worth it.
To make one of these videos, we need to do three things.
-
Define a region of interest.
-
Pull in the image along the date range.
-
Define visualization parameters.
In order to create an area of interest, we will buffer around the previous position of the Deepwater Horizo # n drilling rig. GEE will use the size of the buffer to set the bounding box of the video. Basically, even if our shape on the map is round, we will eventually get a square. Add the following code to an existing script to get started.
<span style="color:#333333"><span style="background-color:#ffffff"><span style="color:#333333"><span style="background-color:#f8f8f8"><code><span style="color:inherit"><span style="color:#8f5902"><em>// Buffer around the deep water horizon site.</em></span></span>
<span style="color:inherit"><span style="color:#204a87"><strong>var</strong></span> buffer <span style="color:#ce5c00"><strong>=</strong></span> dw<span style="color:#ce5c00"><strong>.</strong></span><span style="color:#000000">buffer</span>({<span style="color:#204a87">distance</span><span style="color:#ce5c00"><strong>:</strong></span><span style="color:#0000cf">150000</span>} )<span style="color:#ce5c00"><strong>;</strong></span></span>

<span style="color:inherit">Map<span style="color:#ce5c00"><strong>.</strong></span><span style="color:#000000">addLayer</span>(buffer<span style="color:#ce5c00"><strong>,</strong></span> {}<span style="color:#ce5c00"><strong>,</strong></span> <span style="color:#4e9a06">'buffer'</span>)<span style="color:#ce5c00"><strong>;</strong></span></span></code></span></span></span></span>
We will continue to use the Aqua MODIS surface reflectance image and use the visualization parameters we previously defined. In this case, we select images within four months. There will be about 120 images in the video. Add the following code to your script.
<span style="color:#333333"><span style="background-color:#ffffff"><span style="color:#333333"><span style="background-color:#f8f8f8"><code><span style="color:inherit"><span style="color:#8f5902"><em>// Define the visualization parameters.</em></span></span>
<span style="color:inherit"><span style="color:#204a87"><strong>var</strong></span> vis <span style="color:#ce5c00"><strong>=</strong></span> {<span style="color:#204a87">gamma</span><span style="color:#ce5c00"><strong>:</strong></span> <span style="color:#0000cf">1</span><span style="color:#ce5c00"><strong>,</strong></span></span>
<span style="color:inherit"><span style="color:#204a87">max</span><span style="color:#ce5c00"><strong>:</strong></span> <span style="color:#0000cf">10278.86</span><span style="color:#ce5c00"><strong>,</strong></span></span>
<span style="color:inherit"><span style="color:#204a87">min</span><span style="color:#ce5c00"><strong>:</strong></span> <span style="color:#0000cf">192.14000000000001</span><span style="color:#ce5c00"><strong>,</strong></span></span>
<span style="color:inherit"><span style="color:#204a87">opacity</span><span style="color:#ce5c00"><strong>:</strong></span> <span style="color:#0000cf">1</span>}<span style="color:#ce5c00"><strong>;</strong></span></span>


<span style="color:inherit"><span style="color:#204a87"><strong>var</strong></span> collection <span style="color:#ce5c00"><strong>=</strong></span> ee<span style="color:#ce5c00"><strong>.</strong></span><span style="color:#000000">ImageCollection</span>(<span style="color:#4e9a06">"MODIS/006/MYD09GA"</span>)</span>
<span style="color:inherit">  <span style="color:#8f5902"><em>// Get four months of imagery.</em></span></span>
<span style="color:inherit">  <span style="color:#ce5c00"><strong>.</strong></span><span style="color:#000000">filterDate</span>(<span style="color:#4e9a06">'2010-04-01'</span><span style="color:#ce5c00"><strong>,</strong></span><span style="color:#4e9a06">'2010-7-30'</span>)</span>
<span style="color:inherit">  <span style="color:#8f5902"><em>// Need to have 3-band imagery for the video.</em></span></span>
<span style="color:inherit">  <span style="color:#ce5c00"><strong>.</strong></span><span style="color:#000000">select</span>([<span style="color:#4e9a06">'sur_refl_b01'</span><span style="color:#ce5c00"><strong>,</strong></span> <span style="color:#4e9a06">'sur_refl_b04'</span><span style="color:#ce5c00"><strong>,</strong></span> <span style="color:#4e9a06">'sur_refl_b03'</span>])</span>
<span style="color:inherit">  <span style="color:#8f5902"><em>// Use the map function to apply the same visualizations to all images.</em></span></span>
<span style="color:inherit">  <span style="color:#ce5c00"><strong>.</strong></span><span style="color:#000000">map</span>(<span style="color:#204a87"><strong>function</strong></span>(image) {</span>
<span style="color:inherit">    <span style="color:#204a87"><strong>return</strong></span> image<span style="color:#ce5c00"><strong>.</strong></span><span style="color:#000000">visualize</span>(vis)<span style="color:#ce5c00"><strong>;</strong></span></span>
<span style="color:inherit">  })<span style="color:#ce5c00"><strong>;</strong></span></span>

<span style="color:inherit">Map<span style="color:#ce5c00"><strong>.</strong></span><span style="color:#000000">addLayer</span>({<span style="color:#204a87">eeObject</span><span style="color:#ce5c00"><strong>:</strong></span> collection<span style="color:#ce5c00"><strong>,</strong></span> <span style="color:#204a87">name</span><span style="color:#ce5c00"><strong>:</strong></span><span style="color:#4e9a06">'Video images'</span>})<span style="color:#ce5c00"><strong>;</strong></span>  </span></code></span></span></span></span>
The last step is to export these video elements. This is as effective as any other export function in GEE, but there are some unique parameters specific to video quality.
Dimensions: the pixel resolution of the video. 720 by 720 is assumed when providing a single number.
FramesPerSecond: defines the number of images displayed per second. We're displaying about 120 images, so at four frames per second, our video will be about 30 seconds long. If you want to use this video for a more qualitative assessment, you can reduce it to 1 frame per second. Add code to an existing script.
<span style="color:#333333"><span style="background-color:#ffffff"><span style="color:#333333"><span style="background-color:#f8f8f8"><code><span style="color:inherit"><span style="color:#8f5902"><em>// Export (change dimensions or scale for higher quality).</em></span></span>
<span style="color:inherit">Export<span style="color:#ce5c00"><strong>.</strong></span><span style="color:#c4a000">video</span><span style="color:#ce5c00"><strong>.</strong></span><span style="color:#000000">toDrive</span>({</span>
<span style="color:inherit">  <span style="color:#204a87">collection</span><span style="color:#ce5c00"><strong>:</strong></span> collection<span style="color:#ce5c00"><strong>,</strong></span></span>
<span style="color:inherit">  <span style="color:#204a87">description</span><span style="color:#ce5c00"><strong>:</strong></span> <span style="color:#4e9a06">'modisDWH'</span><span style="color:#ce5c00"><strong>,</strong></span></span>
<span style="color:inherit">  <span style="color:#204a87">dimensions</span><span style="color:#ce5c00"><strong>:</strong></span> <span style="color:#0000cf">720</span><span style="color:#ce5c00"><strong>,</strong></span></span>
<span style="color:inherit">  <span style="color:#204a87">framesPerSecond</span><span style="color:#ce5c00"><strong>:</strong></span> <span style="color:#0000cf">4</span><span style="color:#ce5c00"><strong>,</strong></span></span>
<span style="color:inherit">  <span style="color:#204a87">region</span><span style="color:#ce5c00"><strong>:</strong></span> buffer</span>
<span style="color:inherit">})<span style="color:#ce5c00"><strong>;</strong></span></span></code></span></span></span></span>
Like anything exported from GEE, you need to perform this process by selecting the run button in the task pane after running the script. Exporting this video will take some time. Depending on your connection speed and the parameters selected for the video, this process is expected to take 10 to 20 minutes. Making videos for your learning area can provide you with interesting and fascinating resources to show some characteristics of the region. The video will clearly show that the Gulf of Mexico is a generally cloudy place, but there will be some images, and the oil in the sun will shine brightly. Can be in here Find video examples.
In the next step of this study, we will compare the photosynthetic activity with time.
5. Ecological impact of Deepwater Horizon oil spill
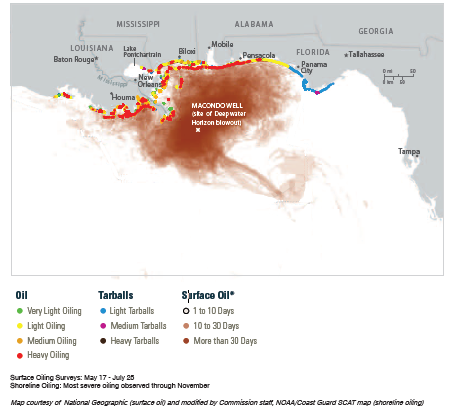
According to field survey data, this map shows the incubation period of offshore oil in the Gulf of Mexico and the severity of coastal oil. Although there is no scale, Baton Rouge and Pensacola are about 250 miles apart. Source: US National Response Team
As shown in the figure above, the main impact of the Deepwater Horizon oil spill is the persistence of oil in the ecosystem. With the opening of oil wells for more than 100 days, oil appeared in the vast area of the Gulf of Mexico due to changes in ocean currents and weather conditions. Measuring the actual ecological impact is a real challenge because oil exists in many parts of the ocean surface and affects species at the entire trophic level. We will try to monitor the impact of the spill on photosynthetic algae that form the basis of the marine food web in the Gulf of Mexico.
5.1 algal bloom
The Deepwater Horizon event is an example of point source pollution. But the Gulf of Mexico, especially around the Mississippi River Delta, has been dealing with non-point source pollution for some time. The Mississippi river discharges about a third of the land of the United States, and most of the region is under intensive agricultural development. In order to grow plants, additional nutrients, such as nitrogen and phosphorus, need to be applied to farmland. Although these nutrients are used by plants, some nutrients are washed away during precipitation events and eventually enter the ocean. As a result, naturally occurring algal populations receive additional nutrients and bloom in large numbers.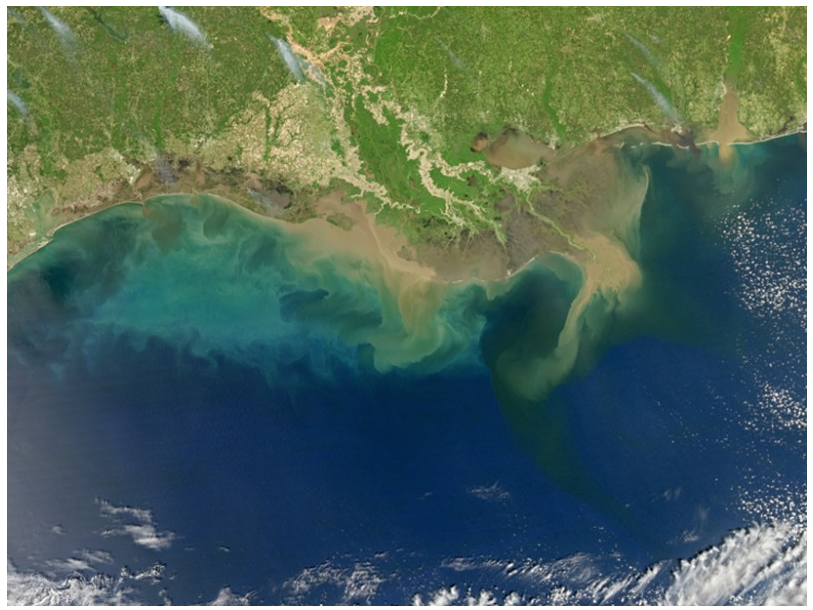
Spring floods carry large amounts of sediment and dissolved nutrients into the Gulf of Mexico. This can significantly increase the number of algae along the coast. The water along the coast is light green with algal blooms. Credit: NASA Earth Observatory
The true color MODIS Image above shows sediment plumes (tan) and algal blooms (light green) generated by spring high water level events throughout the Mississippi River Delta. We will try to see if there are measurable differences in the extent and intensity of algal blooms between years when oil continues to exist on the ocean surface and years when oil does not exist.
5.2 MODIS chlorophyll-a products
MODIS Aqua sensor has been capturing images since 2000. During this period, the remote sensing community has also developed many content specific algorithms specially designed for MODIS images. Many algorithms have become preprocessing products that end users can quickly participate in GEE. For mapping algae populations over time, we will rely on one of these preprocessing products available in GEE, Ocean Color SMI: standard mapping image MODIS Aqua Data
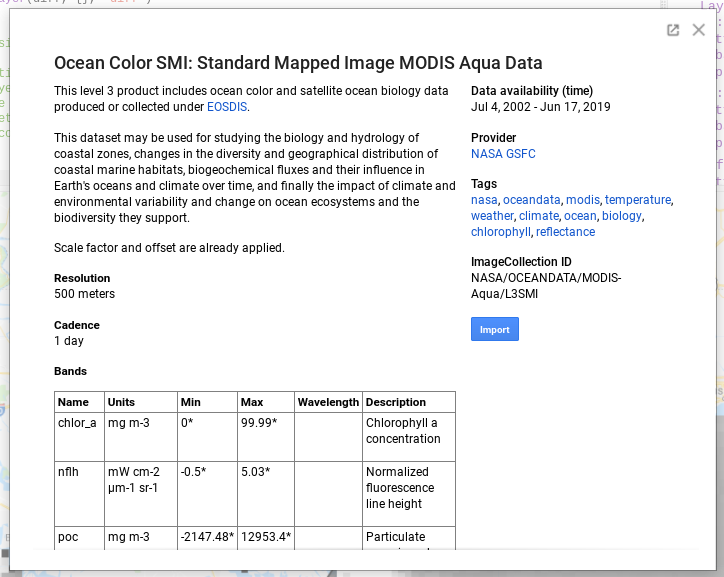
Description of MODIS Ocean Color image sets available in GEE.
"chlor_a" band is the near surface concentration of chlorophyll-a, which is based on the empirical relationship between blue and green bands of MODIS sensor. Chlorophyll-a is the main molecule responsible for photosynthesis and contributes to the green of plants. By mapping the concentration of chlorophyll-a, we assume that algae are the main source of this molecule in the marine area.
5.3 distinguishing images of two years
As long as you have the right image, it's worth generating a simple visualization of some ecological features you're interested in. We will do this by generating chlorophyll a density maps for 2009 and 2010. We will also use the difference between the two images to visualize the spatial pattern of chlorophyll a density between the two years.
We will filter our dataset a to capture the months in which the well was active. Please open a new script, starting with the following code.
<span style="color:#333333"><span style="background-color:#ffffff"><span style="color:#333333"><span style="background-color:#f8f8f8"><code><span style="color:inherit"><span style="color:#8f5902"><em>// Set map to center on deep water horizon location</em></span></span>
<span style="color:inherit">Map<span style="color:#ce5c00"><strong>.</strong></span><span style="color:#000000">setCenter</span>(<span style="color:#ce5c00"><strong>-</strong></span><span style="color:#0000cf">88.36555556</span><span style="color:#ce5c00"><strong>,</strong></span><span style="color:#0000cf">28.73805556</span><span style="color:#ce5c00"><strong>,</strong></span> <span style="color:#0000cf">7</span>)<span style="color:#ce5c00"><strong>;</strong></span></span>

<span style="color:inherit"><span style="color:#8f5902"><em>// Define visualization parameters so the images are both presented in the same way.</em></span></span>
<span style="color:inherit"><span style="color:#204a87"><strong>var</strong></span> vis2 <span style="color:#ce5c00"><strong>=</strong></span> {<span style="color:#204a87">min</span><span style="color:#ce5c00"><strong>:-</strong></span><span style="color:#0000cf">7</span><span style="color:#ce5c00"><strong>,</strong></span> <span style="color:#204a87">max</span><span style="color:#ce5c00"><strong>:</strong></span><span style="color:#0000cf">14</span>}<span style="color:#ce5c00"><strong>;</strong></span></span>

<span style="color:inherit"><span style="color:#8f5902"><em>// Generate the based dataset for our processes.</em></span></span>
<span style="color:inherit"><span style="color:#204a87"><strong>var</strong></span> mod09 <span style="color:#ce5c00"><strong>=</strong></span> ee<span style="color:#ce5c00"><strong>.</strong></span><span style="color:#000000">ImageCollection</span>(<span style="color:#4e9a06">"NASA/OCEANDATA/MODIS-Aqua/L3SMI"</span>)</span>
<span style="color:inherit">  <span style="color:#ce5c00"><strong>.</strong></span><span style="color:#000000">filterDate</span>(<span style="color:#4e9a06">"2009-04-20"</span><span style="color:#ce5c00"><strong>,</strong></span><span style="color:#4e9a06">"2009-07-31"</span>)</span>
<span style="color:inherit">  <span style="color:#ce5c00"><strong>.</strong></span><span style="color:#000000">select</span>(<span style="color:#4e9a06">"chlor_a"</span>)</span>
<span style="color:inherit">  <span style="color:#ce5c00"><strong>.</strong></span><span style="color:#000000">median</span>()<span style="color:#ce5c00"><strong>;</strong></span></span>
<span style="color:inherit">Map<span style="color:#ce5c00"><strong>.</strong></span><span style="color:#000000">addLayer</span>(mod09<span style="color:#ce5c00"><strong>,</strong></span> vis2<span style="color:#ce5c00"><strong>,</strong></span> <span style="color:#4e9a06">"09"</span>)<span style="color:#ce5c00"><strong>;</strong></span></span>

<span style="color:inherit"><span style="color:#8f5902"><em>// Generate the based dataset for our processes.</em></span></span>
<span style="color:inherit"><span style="color:#204a87"><strong>var</strong></span> mod10 <span style="color:#ce5c00"><strong>=</strong></span> ee<span style="color:#ce5c00"><strong>.</strong></span><span style="color:#000000">ImageCollection</span>(<span style="color:#4e9a06">"NASA/OCEANDATA/MODIS-Aqua/L3SMI"</span>)</span>
<span style="color:inherit">  <span style="color:#ce5c00"><strong>.</strong></span><span style="color:#000000">filterDate</span>(<span style="color:#4e9a06">"2010-04-20"</span><span style="color:#ce5c00"><strong>,</strong></span><span style="color:#4e9a06">"2010-07-31"</span>)</span>
<span style="color:inherit">  <span style="color:#ce5c00"><strong>.</strong></span><span style="color:#000000">select</span>(<span style="color:#4e9a06">"chlor_a"</span>)</span>
<span style="color:inherit">  <span style="color:#ce5c00"><strong>.</strong></span><span style="color:#000000">median</span>()<span style="color:#ce5c00"><strong>;</strong></span></span>
<span style="color:inherit">Map<span style="color:#ce5c00"><strong>.</strong></span><span style="color:#000000">addLayer</span>(mod10<span style="color:#ce5c00"><strong>,</strong></span> vis2<span style="color:#ce5c00"><strong>,</strong></span> <span style="color:#4e9a06">"10"</span>)<span style="color:#ce5c00"><strong>;</strong></span></span>

<span style="color:inherit"><span style="color:#8f5902"><em>// Difference the model by subtracting.</em></span></span>
<span style="color:inherit"><span style="color:#204a87"><strong>var</strong></span> diff <span style="color:#ce5c00"><strong>=</strong></span> mod10<span style="color:#ce5c00"><strong>.</strong></span><span style="color:#000000">subtract</span>(mod09)<span style="color:#ce5c00"><strong>;</strong></span></span>
<span style="color:inherit">Map<span style="color:#ce5c00"><strong>.</strong></span><span style="color:#000000">addLayer</span>(diff<span style="color:#ce5c00"><strong>,</strong></span> {<span style="color:#204a87">min</span><span style="color:#ce5c00"><strong>:-</strong></span><span style="color:#0000cf">6</span><span style="color:#ce5c00"><strong>,</strong></span> <span style="color:#204a87">max</span><span style="color:#ce5c00"><strong>:</strong></span><span style="color:#0000cf">6</span>}<span style="color:#ce5c00"><strong>,</strong></span> <span style="color:#4e9a06">"diff"</span>)<span style="color:#ce5c00"><strong>;</strong></span></span></code></span></span></span></span>
Use the inspector tool to view differences in values. The presence of more algae in darker areas in 2009 indicates that there are more algae in shallower areas in 2010.
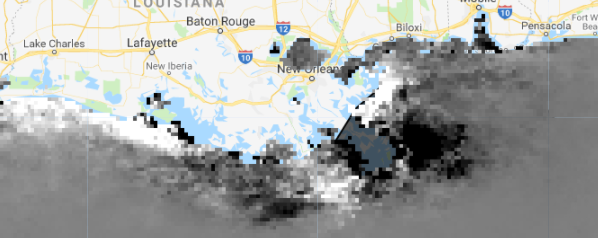
The difference of algae concentration between 2009 and 2010. The dark area represents the area where the algae concentration decreases, and the light area is the area where the algae concentration increases.
Very dark areas may suggest that oil has an impact on algae productivity. But this is a complex system. It is wise to check the trend of the data rather than directly compare the two time steps. We will study two different methods to observe the change trend of algae productivity over time.
6. Trend analysis of MODIS series
Trend analysis of remote sensing data is a big research field. This is an important method, because in complex systems, a single event may have an impact in the short term, but due to the elasticity of the system, it has little impact on ecosystem function over time. Using MODIS sensor, we can obtain the algae concentration data from 2002 to now. We will prepare these data using two different methods to highlight the changes in mean and daily measurements over time. Both methods highlight different trends and provide unique information on the impact of oil spills on algal populations.
6.1 median method.
In the image comparison method above, we looked at the difference between the two images. In this example, we will develop a method that allows us to make similar comparisons of available data for all years. We will slightly automate this process by creating a dictionary containing a reduced median image of the time period of the well leak. We are using custom built functions to build our image dictionary. This feature requires users to make some adjustments, so we include some descriptive text in the description so that users can know exactly what they need. This is a good practice if you find that your generated functions are used by people other than you in many different situations. Add the following code to your current script.
<span style="color:#333333"><span style="background-color:#ffffff"><span style="color:#333333"><span style="background-color:#f8f8f8"><code><span style="color:inherit"><span style="color:#204a87"><strong>var</strong></span> constructMODDict <span style="color:#ce5c00"><strong>=</strong></span> <span style="color:#204a87"><strong>function</strong></span>(geometry)</span>
<span style="color:inherit">  <span style="color:#8f5902"><em>/*</em></span></span>
<span style="color:inherit"><span style="color:#8f5902"><em>  This function takes in a geometry feature from the GUI and uses it to</em></span></span>
<span style="color:inherit"><span style="color:#8f5902"><em>  generate a dictionary of median reduce images for the specified date range</em></span></span>
<span style="color:inherit"><span style="color:#8f5902"><em>  inputs</em></span></span>
<span style="color:inherit"><span style="color:#8f5902"><em>  geometry = geometry object representing you area of interest</em></span></span>
<span style="color:inherit"><span style="color:#8f5902"><em>  y_list = set based on sensor type</em></span></span>
<span style="color:inherit"><span style="color:#8f5902"><em>  imagecollection = unique id for collection type</em></span></span>
<span style="color:inherit"><span style="color:#8f5902"><em>  filterDate = cat() this is used to refine the month and day of start and end time</em></span></span>
<span style="color:inherit"><span style="color:#8f5902"><em>  With adaptation this should be flexible across sensors and times</em></span></span>
<span style="color:inherit"><span style="color:#8f5902"><em>  */</em></span></span>
<span style="color:inherit">  {</span>
<span style="color:inherit">  <span style="color:#204a87"><strong>var</strong></span> startMonth <span style="color:#ce5c00"><strong>=</strong></span> <span style="color:#4e9a06">"-04-20"</span><span style="color:#ce5c00"><strong>;</strong></span></span>
<span style="color:inherit">  <span style="color:#204a87"><strong>var</strong></span> endMonth <span style="color:#ce5c00"><strong>=</strong></span> <span style="color:#4e9a06">"-07-31"</span><span style="color:#ce5c00"><strong>;</strong></span></span>
<span style="color:inherit">  <span style="color:#8f5902"><em>// Construct a dictionary for MODIS.</em></span></span>
<span style="color:inherit">  <span style="color:#204a87"><strong>var</strong></span> y_list <span style="color:#ce5c00"><strong>=</strong></span> ee<span style="color:#ce5c00"><strong>.</strong></span><span style="color:#c4a000">List</span><span style="color:#ce5c00"><strong>.</strong></span><span style="color:#000000">sequence</span>(<span style="color:#0000cf">2002</span><span style="color:#ce5c00"><strong>,</strong></span> <span style="color:#0000cf">2018</span>)<span style="color:#ce5c00"><strong>;</strong></span></span>
<span style="color:inherit">  <span style="color:#204a87"><strong>var</strong></span> ystr_list <span style="color:#ce5c00"><strong>=</strong></span> y_list<span style="color:#ce5c00"><strong>.</strong></span><span style="color:#000000">map</span>(<span style="color:#204a87"><strong>function</strong></span>(y){<span style="color:#204a87"><strong>return</strong></span> ee<span style="color:#ce5c00"><strong>.</strong></span><span style="color:#000000">Number</span>(y)<span style="color:#ce5c00"><strong>.</strong></span><span style="color:#000000">format</span>(<span style="color:#4e9a06">'%1d'</span>)})<span style="color:#ce5c00"><strong>;</strong></span></span>
<span style="color:inherit">  <span style="color:#204a87"><strong>var</strong></span> mod <span style="color:#ce5c00"><strong>=</strong></span> y_list<span style="color:#ce5c00"><strong>.</strong></span><span style="color:#000000">map</span>(<span style="color:#204a87"><strong>function</strong></span>(y){<span style="color:#204a87"><strong>return</strong></span> ee<span style="color:#ce5c00"><strong>.</strong></span><span style="color:#000000">ImageCollection</span>(<span style="color:#4e9a06">'NASA/OCEANDATA/MODIS-Aqua/L3SMI'</span>)</span>
<span style="color:inherit">                                          <span style="color:#ce5c00"><strong>.</strong></span><span style="color:#000000">filterDate</span>(ee<span style="color:#ce5c00"><strong>.</strong></span><span style="color:#000000">String</span>(ee<span style="color:#ce5c00"><strong>.</strong></span><span style="color:#000000">Number</span>(y)<span style="color:#ce5c00"><strong>.</strong></span><span style="color:#000000">format</span>(<span style="color:#4e9a06">'%1d'</span>))<span style="color:#ce5c00"><strong>.</strong></span><span style="color:#000000">cat</span>(startMonth)<span style="color:#ce5c00"><strong>,</strong></span></span>
<span style="color:inherit">                                                      ee<span style="color:#ce5c00"><strong>.</strong></span><span style="color:#000000">String</span>(ee<span style="color:#ce5c00"><strong>.</strong></span><span style="color:#000000">Number</span>(y)<span style="color:#ce5c00"><strong>.</strong></span><span style="color:#000000">format</span>(<span style="color:#4e9a06">'%1d'</span>))<span style="color:#ce5c00"><strong>.</strong></span><span style="color:#000000">cat</span>(endMonth))</span>
<span style="color:inherit">                                          <span style="color:#ce5c00"><strong>.</strong></span><span style="color:#000000">select</span>(<span style="color:#4e9a06">"chlor_a"</span>)</span>
<span style="color:inherit">                                          <span style="color:#ce5c00"><strong>.</strong></span><span style="color:#000000">median</span>()</span>
<span style="color:inherit">                                          <span style="color:#ce5c00"><strong>.</strong></span><span style="color:#000000">clip</span>(geometry)<span style="color:#ce5c00"><strong>;</strong></span></span>
<span style="color:inherit">  })</span>
<span style="color:inherit">  <span style="color:#204a87"><strong>var</strong></span> mod_dict <span style="color:#ce5c00"><strong>=</strong></span> ee<span style="color:#ce5c00"><strong>.</strong></span><span style="color:#c4a000">Dictionary</span><span style="color:#ce5c00"><strong>.</strong></span><span style="color:#000000">fromLists</span>(ystr_list<span style="color:#ce5c00"><strong>,</strong></span> mod)<span style="color:#ce5c00"><strong>;</strong></span></span>
<span style="color:inherit">  <span style="color:#8f5902"><em>// Return MODIS dictionary.</em></span></span>
<span style="color:inherit">  <span style="color:#204a87"><strong>return</strong></span> mod_dict<span style="color:#ce5c00"><strong>;</strong></span></span>
<span style="color:inherit">}<span style="color:#ce5c00"><strong>;</strong></span></span></code></span></span></span></span>
In short, this function pulls in all images within the set date range, selects a specific band, applies a median reducer, and clips the images to geometric features. We wanted to do this over the years, so we created a list of years we wanted to cover. The list is converted to EE Number object, which is used to select and manipulate images of all years in the list. When you create an image, it is stored in the list. We then convert the list into a dictionary that allows us to track the image by defining its key as the year it represents. For more examples of dictionaries, see Module 10.
Running the above function will bring the feature into memory. In the following code, we call this function and provide geometric features as input. Create your own geometric features, including more coastlines in Louisiana, Mississippi and Alabama. For reference, use section 5 Map the affected coastal areas in and make sure it includes a distance of 20 or 30 miles from the coast. Algae are most common in shallow water, but we want to include potential habitats. Add the following code to your script to run the function.
<span style="color:#333333"><span style="background-color:#ffffff"><span style="color:#333333"><span style="background-color:#f8f8f8"><code><span style="color:inherit"><span style="color:#8f5902"><em>// Apply function across the new geometry.</em></span></span>
<span style="color:inherit"><span style="color:#204a87"><strong>var</strong></span> elements <span style="color:#ce5c00"><strong>=</strong></span> <span style="color:#000000">constructMODDict</span>(geometry)<span style="color:#ce5c00"><strong>;</strong></span></span>
<span style="color:inherit"><span style="color:#000000">print</span>(elements<span style="color:#ce5c00"><strong>,</strong></span> <span style="color:#4e9a06">"Image dictionary"</span>)<span style="color:#ce5c00"><strong>;</strong></span></span></code></span></span></span></span>
We can use the dictionary to select the year of the image, because we can use the key to store the image data. This makes it easy to classify and understand the images you are using. That is, dictionaries are not useful for displaying and running image analysis. Therefore, we will create a collection of images from the dictionary. Add the following code to the existing script.
<span style="color:#333333"><span style="background-color:#ffffff"><span style="color:#333333"><span style="background-color:#f8f8f8"><code><span style="color:inherit"><span style="color:#8f5902"><em>// Convert the images in the dictionary to an image collection.</em></span></span>
<span style="color:inherit"><span style="color:#204a87"><strong>var</strong></span> collection2 <span style="color:#ce5c00"><strong>=</strong></span> ee<span style="color:#ce5c00"><strong>.</strong></span><span style="color:#c4a000">ImageCollection</span><span style="color:#ce5c00"><strong>.</strong></span><span style="color:#000000">fromImages</span>([</span>
<span style="color:inherit">  ee<span style="color:#ce5c00"><strong>.</strong></span><span style="color:#000000">Image</span>(elements<span style="color:#ce5c00"><strong>.</strong></span><span style="color:#000000">get</span>(<span style="color:#4e9a06">'2002'</span>))<span style="color:#ce5c00"><strong>,</strong></span></span>
<span style="color:inherit">  ee<span style="color:#ce5c00"><strong>.</strong></span><span style="color:#000000">Image</span>(elements<span style="color:#ce5c00"><strong>.</strong></span><span style="color:#000000">get</span>(<span style="color:#4e9a06">'2003'</span>))<span style="color:#ce5c00"><strong>,</strong></span></span>
<span style="color:inherit">  ee<span style="color:#ce5c00"><strong>.</strong></span><span style="color:#000000">Image</span>(elements<span style="color:#ce5c00"><strong>.</strong></span><span style="color:#000000">get</span>(<span style="color:#4e9a06">'2004'</span>))<span style="color:#ce5c00"><strong>,</strong></span></span>
<span style="color:inherit">  ee<span style="color:#ce5c00"><strong>.</strong></span><span style="color:#000000">Image</span>(elements<span style="color:#ce5c00"><strong>.</strong></span><span style="color:#000000">get</span>(<span style="color:#4e9a06">'2005'</span>))<span style="color:#ce5c00"><strong>,</strong></span></span>
<span style="color:inherit">  ee<span style="color:#ce5c00"><strong>.</strong></span><span style="color:#000000">Image</span>(elements<span style="color:#ce5c00"><strong>.</strong></span><span style="color:#000000">get</span>(<span style="color:#4e9a06">'2006'</span>))<span style="color:#ce5c00"><strong>,</strong></span></span>
<span style="color:inherit">  ee<span style="color:#ce5c00"><strong>.</strong></span><span style="color:#000000">Image</span>(elements<span style="color:#ce5c00"><strong>.</strong></span><span style="color:#000000">get</span>(<span style="color:#4e9a06">'2007'</span>))<span style="color:#ce5c00"><strong>,</strong></span></span>
<span style="color:inherit">  ee<span style="color:#ce5c00"><strong>.</strong></span><span style="color:#000000">Image</span>(elements<span style="color:#ce5c00"><strong>.</strong></span><span style="color:#000000">get</span>(<span style="color:#4e9a06">'2008'</span>))<span style="color:#ce5c00"><strong>,</strong></span></span>
<span style="color:inherit">  ee<span style="color:#ce5c00"><strong>.</strong></span><span style="color:#000000">Image</span>(elements<span style="color:#ce5c00"><strong>.</strong></span><span style="color:#000000">get</span>(<span style="color:#4e9a06">'2009'</span>))<span style="color:#ce5c00"><strong>,</strong></span></span>
<span style="color:inherit">  ee<span style="color:#ce5c00"><strong>.</strong></span><span style="color:#000000">Image</span>(elements<span style="color:#ce5c00"><strong>.</strong></span><span style="color:#000000">get</span>(<span style="color:#4e9a06">'2010'</span>))<span style="color:#ce5c00"><strong>,</strong></span></span>
<span style="color:inherit">  ee<span style="color:#ce5c00"><strong>.</strong></span><span style="color:#000000">Image</span>(elements<span style="color:#ce5c00"><strong>.</strong></span><span style="color:#000000">get</span>(<span style="color:#4e9a06">'2011'</span>))<span style="color:#ce5c00"><strong>,</strong></span></span>
<span style="color:inherit">  ee<span style="color:#ce5c00"><strong>.</strong></span><span style="color:#000000">Image</span>(elements<span style="color:#ce5c00"><strong>.</strong></span><span style="color:#000000">get</span>(<span style="color:#4e9a06">'2012'</span>))<span style="color:#ce5c00"><strong>,</strong></span></span>
<span style="color:inherit">  ee<span style="color:#ce5c00"><strong>.</strong></span><span style="color:#000000">Image</span>(elements<span style="color:#ce5c00"><strong>.</strong></span><span style="color:#000000">get</span>(<span style="color:#4e9a06">'2013'</span>))<span style="color:#ce5c00"><strong>,</strong></span></span>
<span style="color:inherit">  ee<span style="color:#ce5c00"><strong>.</strong></span><span style="color:#000000">Image</span>(elements<span style="color:#ce5c00"><strong>.</strong></span><span style="color:#000000">get</span>(<span style="color:#4e9a06">'2014'</span>))<span style="color:#ce5c00"><strong>,</strong></span></span>
<span style="color:inherit">  ee<span style="color:#ce5c00"><strong>.</strong></span><span style="color:#000000">Image</span>(elements<span style="color:#ce5c00"><strong>.</strong></span><span style="color:#000000">get</span>(<span style="color:#4e9a06">'2015'</span>))<span style="color:#ce5c00"><strong>,</strong></span></span>
<span style="color:inherit">  ee<span style="color:#ce5c00"><strong>.</strong></span><span style="color:#000000">Image</span>(elements<span style="color:#ce5c00"><strong>.</strong></span><span style="color:#000000">get</span>(<span style="color:#4e9a06">'2016'</span>))<span style="color:#ce5c00"><strong>,</strong></span></span>
<span style="color:inherit">  ee<span style="color:#ce5c00"><strong>.</strong></span><span style="color:#000000">Image</span>(elements<span style="color:#ce5c00"><strong>.</strong></span><span style="color:#000000">get</span>(<span style="color:#4e9a06">'2017'</span>))<span style="color:#ce5c00"><strong>,</strong></span></span>
<span style="color:inherit">  ee<span style="color:#ce5c00"><strong>.</strong></span><span style="color:#000000">Image</span>(elements<span style="color:#ce5c00"><strong>.</strong></span><span style="color:#000000">get</span>(<span style="color:#4e9a06">'2018'</span>))</span>
<span style="color:inherit">  ])<span style="color:#ce5c00"><strong>;</strong></span></span>

<span style="color:inherit"><span style="color:#000000">print</span>(collection2)</span>
<span style="color:inherit">Map<span style="color:#ce5c00"><strong>.</strong></span><span style="color:#000000">addLayer</span>(collection2<span style="color:#ce5c00"><strong>,</strong></span>{}<span style="color:#ce5c00"><strong>,</strong></span><span style="color:#4e9a06">'ic'</span>)</span></code></span></span></span></span>
This is not an effective method, but it does work. If you have a large number of images in your dictionary, you must find a more creative way to create this new set of images. Another option to explore is map() A function in GEE that works like a for loop or a function in happy() R.
After adding the image set to the map, we can use the inspector tool to select a location on the map and view the histogram of the median chlorophyll a concentration of the selected location over a 17 year period. The oil spill occurred in 2010, and our image began in 2002. This means that the eighth position on the histogram represents 2010. You can verify this by comparing the values on the histogram with the values in the 2009 and 2010 grids. The inspector tool displays the values of all images at the location you choose.
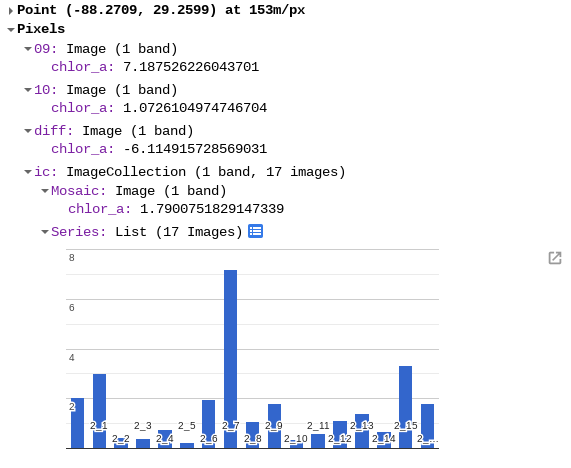
A histogram showing the median chlorophyll a concentration at selected locations in all available MODIS images.
6.2 trend of a single image in a region
The example above is a great resource to quickly check the median of a selected location. However, this method can mask the unique values of interest, such as minimum and maximum concentrations. In this example, we will build a similar dataset, but we will not reduce the images in a year. Therefore, we will provide value for every day of every year we choose. Add the following code to your script.
<span style="color:#333333"><span style="background-color:#ffffff"><span style="color:#333333"><span style="background-color:#f8f8f8"><code><span style="color:inherit"><span style="color:#8f5902"><em>// Define start and end dates.</em></span></span>
<span style="color:inherit"><span style="color:#204a87"><strong>var</strong></span> start <span style="color:#ce5c00"><strong>=</strong></span> <span style="color:#4e9a06">'2008-01-01'</span><span style="color:#ce5c00"><strong>;</strong></span></span>
<span style="color:inherit"><span style="color:#204a87"><strong>var</strong></span> end <span style="color:#ce5c00"><strong>=</strong></span> <span style="color:#4e9a06">'2012-12-31'</span><span style="color:#ce5c00"><strong>;</strong></span></span>

<span style="color:inherit"><span style="color:#8f5902"><em>// Select all images with the months of April to July with a date range</em></span></span>
<span style="color:inherit"><span style="color:#204a87"><strong>var</strong></span> col <span style="color:#ce5c00"><strong>=</strong></span> ee<span style="color:#ce5c00"><strong>.</strong></span><span style="color:#000000">ImageCollection</span>(<span style="color:#4e9a06">"NASA/OCEANDATA/MODIS-Aqua/L3SMI"</span>)</span>
<span style="color:inherit">  <span style="color:#ce5c00"><strong>.</strong></span><span style="color:#000000">filterDate</span>(start<span style="color:#ce5c00"><strong>,</strong></span> end)</span>
<span style="color:inherit">  <span style="color:#ce5c00"><strong>.</strong></span><span style="color:#000000">filter</span>(ee<span style="color:#ce5c00"><strong>.</strong></span><span style="color:#c4a000">Filter</span><span style="color:#ce5c00"><strong>.</strong></span><span style="color:#000000">calendarRange</span>(<span style="color:#0000cf">4</span><span style="color:#ce5c00"><strong>,</strong></span><span style="color:#0000cf">7</span><span style="color:#ce5c00"><strong>,</strong></span><span style="color:#4e9a06">'month'</span>))</span>
<span style="color:inherit">  <span style="color:#ce5c00"><strong>.</strong></span><span style="color:#000000">filterBounds</span>(geometry)</span>
<span style="color:inherit">  <span style="color:#ce5c00"><strong>.</strong></span><span style="color:#000000">select</span>(<span style="color:#4e9a06">"chlor_a"</span>)<span style="color:#ce5c00"><strong>;</strong></span></span>

<span style="color:inherit"><span style="color:#000000">print</span>(col<span style="color:#ce5c00"><strong>,</strong></span> <span style="color:#4e9a06">"Individual Images By Year"</span>)<span style="color:#ce5c00"><strong>;</strong></span></span></code></span></span></span></span>
In the above code, we applied a very familiar filtering process and added a new filtering element. The EE Filter. The calendarrange() function allows you to filter by time elements in the image metadata (timestamp, day, month, year). In our example, we choose images taken between the fourth and seventh months of the year. This is a very convenient filter!
Click "+ new layer" under Geometry Imports to generate a new geometric feature and place it on the map. Rename the feature "roi". You can adjust the size and location of features at any time, but remember that the larger the geometry, the longer it takes to complete the summary statistics.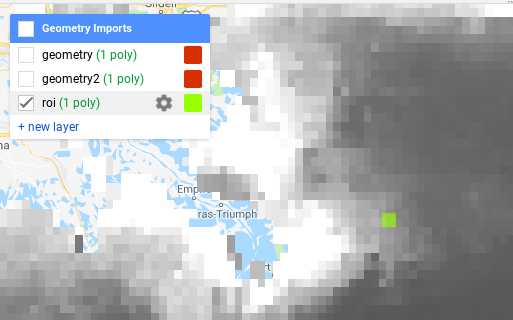
An example of a small area of interest that can be used to run summary statistics.
This geometric feature will define the source of our compiled data. To visualize the data, we will use this UI Chart() function. This function requires an imageCollection for input data, a reducer function for defining the geometric characteristics of the region, and a reducer function for compiling all elements in the region into a single value. Add the following code to your script to generate and view charts.
<span style="color:#333333"><span style="background-color:#ffffff"><span style="color:#333333"><span style="background-color:#f8f8f8"><code><span style="color:inherit"><span style="color:#8f5902"><em>// Plot a time series of the chlor_a at a single location or summarize values within an area.</em></span></span>
<span style="color:inherit"><span style="color:#204a87"><strong>var</strong></span> l8Chart <span style="color:#ce5c00"><strong>=</strong></span> ui<span style="color:#ce5c00"><strong>.</strong></span><span style="color:#c4a000">Chart</span><span style="color:#ce5c00"><strong>.</strong></span><span style="color:#c4a000">image</span><span style="color:#ce5c00"><strong>.</strong></span><span style="color:#000000">series</span>({<span style="color:#204a87">imageCollection</span><span style="color:#ce5c00"><strong>:</strong></span> col<span style="color:#ce5c00"><strong>,</strong></span></span>
<span style="color:inherit">   <span style="color:#204a87">region</span><span style="color:#ce5c00"><strong>:</strong></span> roi<span style="color:#ce5c00"><strong>,</strong></span></span>
<span style="color:inherit">   <span style="color:#204a87">reducer</span><span style="color:#ce5c00"><strong>:</strong></span> ee<span style="color:#ce5c00"><strong>.</strong></span><span style="color:#c4a000">Reducer</span><span style="color:#ce5c00"><strong>.</strong></span><span style="color:#000000">median</span>()}</span>
<span style="color:inherit"> )<span style="color:#ce5c00"><strong>.</strong></span><span style="color:#000000">setChartType</span>(<span style="color:#4e9a06">'ScatterChart'</span>)<span style="color:#ce5c00"><strong>;</strong></span></span>

<span style="color:inherit"><span style="color:#000000">print</span>(l8Chart)<span style="color:#ce5c00"><strong>;</strong></span></span></code></span></span></span></span>
The chart will appear in your console. Use the arrow in the upper right corner of the chart to open the chart as a full-size web page. You can also choose to save data or chart images for further work.
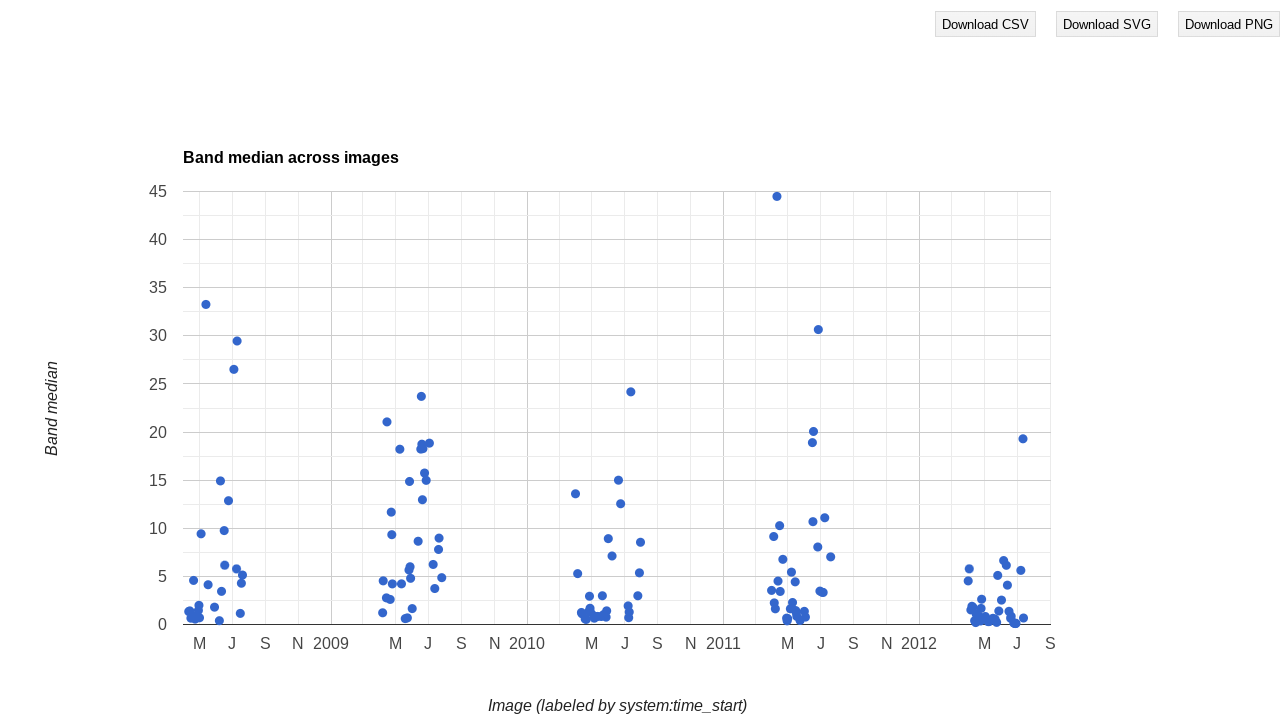
Daily chlorophyll-a concentration in multi-year images within the date of oil release in 2010.
It's easy to see how aggregate data and single image data tell slightly different stories. The complexity of single image data clearly shows that algae concentration is a very dynamic feature, and making a scientific and reasonable statement over time will require a lot of extra work. The important thing is that the data is there, just need to make efforts.
7 conclusion
In this module, we developed a method that allows us to view the time series data of algae concentration in the Gulf of Mexico to estimate the impact of the Deepwater Horizon oil spill on the basic nutrient level of the ecosystem. The scale and complexity of the system indicate that a great deal of additional work will be required to draw conclusive results on the actual impact. However, it can be clearly seen from this process that GEE provides computing power and flexibility for time series analysis. I hope you can use these tools and methods to ask your own questions and understand the long-term impact of ecological disturbance over time.
7.1 complete trend analysis code
<span style="color:#333333"><span style="background-color:#ffffff"><span style="color:#333333"><span style="background-color:#f8f8f8"><code><span style="color:inherit"><span style="color:#8f5902"><em>// Set map to center on deep water horizon location.</em></span></span>
<span style="color:inherit">Map<span style="color:#ce5c00"><strong>.</strong></span><span style="color:#000000">setCenter</span>(<span style="color:#ce5c00"><strong>-</strong></span><span style="color:#0000cf">88.36555556</span><span style="color:#ce5c00"><strong>,</strong></span><span style="color:#0000cf">28.73805556</span><span style="color:#ce5c00"><strong>,</strong></span> <span style="color:#0000cf">6</span>)<span style="color:#ce5c00"><strong>;</strong></span></span>

<span style="color:inherit"><span style="color:#8f5902"><em>// Define visualization parameters so the images are both presented in the same way.</em></span></span>
<span style="color:inherit"><span style="color:#204a87"><strong>var</strong></span> vis2 <span style="color:#ce5c00"><strong>=</strong></span> {<span style="color:#204a87">min</span><span style="color:#ce5c00"><strong>:-</strong></span><span style="color:#0000cf">7</span><span style="color:#ce5c00"><strong>,</strong></span> <span style="color:#204a87">max</span><span style="color:#ce5c00"><strong>:</strong></span><span style="color:#0000cf">14</span>}<span style="color:#ce5c00"><strong>;</strong></span></span>

<span style="color:inherit"><span style="color:#8f5902"><em>// Generate the based dataset for our processes.</em></span></span>
<span style="color:inherit"><span style="color:#204a87"><strong>var</strong></span> mod09 <span style="color:#ce5c00"><strong>=</strong></span> ee<span style="color:#ce5c00"><strong>.</strong></span><span style="color:#000000">ImageCollection</span>(<span style="color:#4e9a06">"NASA/OCEANDATA/MODIS-Aqua/L3SMI"</span>)</span>
<span style="color:inherit">  <span style="color:#ce5c00"><strong>.</strong></span><span style="color:#000000">filterDate</span>(<span style="color:#4e9a06">"2009-04-20"</span><span style="color:#ce5c00"><strong>,</strong></span><span style="color:#4e9a06">"2009-07-31"</span>)</span>
<span style="color:inherit">  <span style="color:#ce5c00"><strong>.</strong></span><span style="color:#000000">select</span>(<span style="color:#4e9a06">"chlor_a"</span>)</span>
<span style="color:inherit">  <span style="color:#ce5c00"><strong>.</strong></span><span style="color:#000000">median</span>()<span style="color:#ce5c00"><strong>;</strong></span></span>
<span style="color:inherit">Map<span style="color:#ce5c00"><strong>.</strong></span><span style="color:#000000">addLayer</span>(mod09<span style="color:#ce5c00"><strong>,</strong></span> vis2<span style="color:#ce5c00"><strong>,</strong></span> <span style="color:#4e9a06">"09"</span>)<span style="color:#ce5c00"><strong>;</strong></span></span>

<span style="color:inherit"><span style="color:#8f5902"><em>// Generate the based dataset for our processes.</em></span></span>
<span style="color:inherit"><span style="color:#204a87"><strong>var</strong></span> mod10 <span style="color:#ce5c00"><strong>=</strong></span> ee<span style="color:#ce5c00"><strong>.</strong></span><span style="color:#000000">ImageCollection</span>(<span style="color:#4e9a06">"NASA/OCEANDATA/MODIS-Aqua/L3SMI"</span>)</span>
<span style="color:inherit">  <span style="color:#ce5c00"><strong>.</strong></span><span style="color:#000000">filterDate</span>(<span style="color:#4e9a06">"2010-04-20"</span><span style="color:#ce5c00"><strong>,</strong></span><span style="color:#4e9a06">"2010-07-31"</span>)</span>
<span style="color:inherit">  <span style="color:#ce5c00"><strong>.</strong></span><span style="color:#000000">select</span>(<span style="color:#4e9a06">"chlor_a"</span>)</span>
<span style="color:inherit">  <span style="color:#ce5c00"><strong>.</strong></span><span style="color:#000000">median</span>()<span style="color:#ce5c00"><strong>;</strong></span></span>
<span style="color:inherit">Map<span style="color:#ce5c00"><strong>.</strong></span><span style="color:#000000">addLayer</span>(mod10<span style="color:#ce5c00"><strong>,</strong></span> vis2<span style="color:#ce5c00"><strong>,</strong></span> <span style="color:#4e9a06">"10"</span>)<span style="color:#ce5c00"><strong>;</strong></span></span>

<span style="color:inherit"><span style="color:#8f5902"><em>// Difference the model by subtracting.</em></span></span>
<span style="color:inherit"><span style="color:#204a87"><strong>var</strong></span> diff <span style="color:#ce5c00"><strong>=</strong></span> mod10<span style="color:#ce5c00"><strong>.</strong></span><span style="color:#000000">subtract</span>(mod09)<span style="color:#ce5c00"><strong>;</strong></span></span>
<span style="color:inherit">Map<span style="color:#ce5c00"><strong>.</strong></span><span style="color:#000000">addLayer</span>(diff<span style="color:#ce5c00"><strong>,</strong></span> {<span style="color:#204a87">min</span><span style="color:#ce5c00"><strong>:-</strong></span><span style="color:#0000cf">6</span><span style="color:#ce5c00"><strong>,</strong></span> <span style="color:#204a87">max</span><span style="color:#ce5c00"><strong>:</strong></span><span style="color:#0000cf">6</span>}<span style="color:#ce5c00"><strong>,</strong></span> <span style="color:#4e9a06">"diff"</span>)<span style="color:#ce5c00"><strong>;</strong></span></span>

<span style="color:inherit"><span style="color:#204a87"><strong>var</strong></span> constructMODDict <span style="color:#ce5c00"><strong>=</strong></span> <span style="color:#204a87"><strong>function</strong></span>(geometry)</span>
<span style="color:inherit">  <span style="color:#8f5902"><em>/*</em></span></span>
<span style="color:inherit"><span style="color:#8f5902"><em>  This function takes in a geometry feature from the GUI and uses it to</em></span></span>
<span style="color:inherit"><span style="color:#8f5902"><em>  generate a dictionary of median reduce images for the specified date range</em></span></span>
<span style="color:inherit"><span style="color:#8f5902"><em>  inputs</em></span></span>

<span style="color:inherit"><span style="color:#8f5902"><em>  geometry = geometry object representing you area of interest</em></span></span>
<span style="color:inherit"><span style="color:#8f5902"><em>  y_list = set based on sensor type</em></span></span>
<span style="color:inherit"><span style="color:#8f5902"><em>  imagecollection = unique id for collection type</em></span></span>
<span style="color:inherit"><span style="color:#8f5902"><em>  filterDate = this is used to refine the month and day of start and end time</em></span></span>

<span style="color:inherit"><span style="color:#8f5902"><em>  With adaptation this should be flexible across sensors and date ranges.</em></span></span>
<span style="color:inherit"><span style="color:#8f5902"><em>  */</em></span></span>
<span style="color:inherit">  {</span>
<span style="color:inherit">  <span style="color:#204a87"><strong>var</strong></span> startMonth <span style="color:#ce5c00"><strong>=</strong></span> <span style="color:#4e9a06">"-04-20"</span><span style="color:#ce5c00"><strong>;</strong></span></span>
<span style="color:inherit">  <span style="color:#204a87"><strong>var</strong></span> endMonth <span style="color:#ce5c00"><strong>=</strong></span> <span style="color:#4e9a06">"-07-31"</span><span style="color:#ce5c00"><strong>;</strong></span></span>
<span style="color:inherit">  <span style="color:#8f5902"><em>// Construct a dictionary for MODIS.</em></span></span>
<span style="color:inherit">  <span style="color:#204a87"><strong>var</strong></span> y_list <span style="color:#ce5c00"><strong>=</strong></span> ee<span style="color:#ce5c00"><strong>.</strong></span><span style="color:#c4a000">List</span><span style="color:#ce5c00"><strong>.</strong></span><span style="color:#000000">sequence</span>(<span style="color:#0000cf">2002</span><span style="color:#ce5c00"><strong>,</strong></span> <span style="color:#0000cf">2018</span>)<span style="color:#ce5c00"><strong>;</strong></span></span>
<span style="color:inherit">  <span style="color:#204a87"><strong>var</strong></span> ystr_list <span style="color:#ce5c00"><strong>=</strong></span> y_list<span style="color:#ce5c00"><strong>.</strong></span><span style="color:#000000">map</span>(<span style="color:#204a87"><strong>function</strong></span>(y){<span style="color:#204a87"><strong>return</strong></span> ee<span style="color:#ce5c00"><strong>.</strong></span><span style="color:#000000">Number</span>(y)<span style="color:#ce5c00"><strong>.</strong></span><span style="color:#000000">format</span>(<span style="color:#4e9a06">'%1d'</span>)})<span style="color:#ce5c00"><strong>;</strong></span></span>
<span style="color:inherit">  <span style="color:#204a87"><strong>var</strong></span> mod <span style="color:#ce5c00"><strong>=</strong></span> y_list<span style="color:#ce5c00"><strong>.</strong></span><span style="color:#000000">map</span>(<span style="color:#204a87"><strong>function</strong></span>(y){<span style="color:#204a87"><strong>return</strong></span> ee<span style="color:#ce5c00"><strong>.</strong></span><span style="color:#000000">ImageCollection</span>(<span style="color:#4e9a06">'NASA/OCEANDATA/MODIS-Aqua/L3SMI'</span>)</span>
<span style="color:inherit">                                          <span style="color:#ce5c00"><strong>.</strong></span><span style="color:#000000">filterDate</span>(ee<span style="color:#ce5c00"><strong>.</strong></span><span style="color:#000000">String</span>(ee<span style="color:#ce5c00"><strong>.</strong></span><span style="color:#000000">Number</span>(y)<span style="color:#ce5c00"><strong>.</strong></span><span style="color:#000000">format</span>(<span style="color:#4e9a06">'%1d'</span>))<span style="color:#ce5c00"><strong>.</strong></span><span style="color:#000000">cat</span>(startMonth)<span style="color:#ce5c00"><strong>,</strong></span></span>
<span style="color:inherit">                                                      ee<span style="color:#ce5c00"><strong>.</strong></span><span style="color:#000000">String</span>(ee<span style="color:#ce5c00"><strong>.</strong></span><span style="color:#000000">Number</span>(y)<span style="color:#ce5c00"><strong>.</strong></span><span style="color:#000000">format</span>(<span style="color:#4e9a06">'%1d'</span>))<span style="color:#ce5c00"><strong>.</strong></span><span style="color:#000000">cat</span>(endMonth))</span>
<span style="color:inherit">                                          <span style="color:#ce5c00"><strong>.</strong></span><span style="color:#000000">select</span>(<span style="color:#4e9a06">"chlor_a"</span>)</span>
<span style="color:inherit">                                          <span style="color:#ce5c00"><strong>.</strong></span><span style="color:#000000">median</span>()</span>
<span style="color:inherit">                                          <span style="color:#ce5c00"><strong>.</strong></span><span style="color:#000000">clip</span>(geometry)<span style="color:#ce5c00"><strong>;</strong></span></span>
<span style="color:inherit">  })</span>
<span style="color:inherit">  <span style="color:#204a87"><strong>var</strong></span> mod_dict <span style="color:#ce5c00"><strong>=</strong></span> ee<span style="color:#ce5c00"><strong>.</strong></span><span style="color:#c4a000">Dictionary</span><span style="color:#ce5c00"><strong>.</strong></span><span style="color:#000000">fromLists</span>(ystr_list<span style="color:#ce5c00"><strong>,</strong></span> mod)<span style="color:#ce5c00"><strong>;</strong></span></span>
<span style="color:inherit">  <span style="color:#8f5902"><em>// Return MODIS dictionary.</em></span></span>
<span style="color:inherit">  <span style="color:#204a87"><strong>return</strong></span> mod_dict<span style="color:#ce5c00"><strong>;</strong></span></span>
<span style="color:inherit">}<span style="color:#ce5c00"><strong>;</strong></span></span>

<span style="color:inherit"><span style="color:#8f5902"><em>// Apply function across the new geometry.</em></span></span>
<span style="color:inherit"><span style="color:#204a87"><strong>var</strong></span> elements <span style="color:#ce5c00"><strong>=</strong></span> <span style="color:#000000">constructMODDict</span>(geometry)<span style="color:#ce5c00"><strong>;</strong></span></span>
<span style="color:inherit"><span style="color:#000000">print</span>(elements<span style="color:#ce5c00"><strong>,</strong></span> <span style="color:#4e9a06">"Image dictionary"</span>)<span style="color:#ce5c00"><strong>;</strong></span></span>

<span style="color:inherit"><span style="color:#8f5902"><em>// Convert the images in the dictionary to an image collection.</em></span></span>
<span style="color:inherit"><span style="color:#204a87"><strong>var</strong></span> collection2 <span style="color:#ce5c00"><strong>=</strong></span> ee<span style="color:#ce5c00"><strong>.</strong></span><span style="color:#c4a000">ImageCollection</span><span style="color:#ce5c00"><strong>.</strong></span><span style="color:#000000">fromImages</span>([</span>
<span style="color:inherit">  ee<span style="color:#ce5c00"><strong>.</strong></span><span style="color:#000000">Image</span>(elements<span style="color:#ce5c00"><strong>.</strong></span><span style="color:#000000">get</span>(<span style="color:#4e9a06">'2002'</span>))<span style="color:#ce5c00"><strong>,</strong></span></span>
<span style="color:inherit">  ee<span style="color:#ce5c00"><strong>.</strong></span><span style="color:#000000">Image</span>(elements<span style="color:#ce5c00"><strong>.</strong></span><span style="color:#000000">get</span>(<span style="color:#4e9a06">'2003'</span>))<span style="color:#ce5c00"><strong>,</strong></span></span>
<span style="color:inherit">  ee<span style="color:#ce5c00"><strong>.</strong></span><span style="color:#000000">Image</span>(elements<span style="color:#ce5c00"><strong>.</strong></span><span style="color:#000000">get</span>(<span style="color:#4e9a06">'2004'</span>))<span style="color:#ce5c00"><strong>,</strong></span></span>
<span style="color:inherit">  ee<span style="color:#ce5c00"><strong>.</strong></span><span style="color:#000000">Image</span>(elements<span style="color:#ce5c00"><strong>.</strong></span><span style="color:#000000">get</span>(<span style="color:#4e9a06">'2005'</span>))<span style="color:#ce5c00"><strong>,</strong></span></span>
<span style="color:inherit">  ee<span style="color:#ce5c00"><strong>.</strong></span><span style="color:#000000">Image</span>(elements<span style="color:#ce5c00"><strong>.</strong></span><span style="color:#000000">get</span>(<span style="color:#4e9a06">'2006'</span>))<span style="color:#ce5c00"><strong>,</strong></span></span>
<span style="color:inherit">  ee<span style="color:#ce5c00"><strong>.</strong></span><span style="color:#000000">Image</span>(elements<span style="color:#ce5c00"><strong>.</strong></span><span style="color:#000000">get</span>(<span style="color:#4e9a06">'2007'</span>))<span style="color:#ce5c00"><strong>,</strong></span></span>
<span style="color:inherit">  ee<span style="color:#ce5c00"><strong>.</strong></span><span style="color:#000000">Image</span>(elements<span style="color:#ce5c00"><strong>.</strong></span><span style="color:#000000">get</span>(<span style="color:#4e9a06">'2008'</span>))<span style="color:#ce5c00"><strong>,</strong></span></span>
<span style="color:inherit">  ee<span style="color:#ce5c00"><strong>.</strong></span><span style="color:#000000">Image</span>(elements<span style="color:#ce5c00"><strong>.</strong></span><span style="color:#000000">get</span>(<span style="color:#4e9a06">'2009'</span>))<span style="color:#ce5c00"><strong>,</strong></span></span>
<span style="color:inherit">  ee<span style="color:#ce5c00"><strong>.</strong></span><span style="color:#000000">Image</span>(elements<span style="color:#ce5c00"><strong>.</strong></span><span style="color:#000000">get</span>(<span style="color:#4e9a06">'2010'</span>))<span style="color:#ce5c00"><strong>,</strong></span></span>
<span style="color:inherit">  ee<span style="color:#ce5c00"><strong>.</strong></span><span style="color:#000000">Image</span>(elements<span style="color:#ce5c00"><strong>.</strong></span><span style="color:#000000">get</span>(<span style="color:#4e9a06">'2011'</span>))<span style="color:#ce5c00"><strong>,</strong></span></span>
<span style="color:inherit">  ee<span style="color:#ce5c00"><strong>.</strong></span><span style="color:#000000">Image</span>(elements<span style="color:#ce5c00"><strong>.</strong></span><span style="color:#000000">get</span>(<span style="color:#4e9a06">'2012'</span>))<span style="color:#ce5c00"><strong>,</strong></span></span>
<span style="color:inherit">  ee<span style="color:#ce5c00"><strong>.</strong></span><span style="color:#000000">Image</span>(elements<span style="color:#ce5c00"><strong>.</strong></span><span style="color:#000000">get</span>(<span style="color:#4e9a06">'2013'</span>))<span style="color:#ce5c00"><strong>,</strong></span></span>
<span style="color:inherit">  ee<span style="color:#ce5c00"><strong>.</strong></span><span style="color:#000000">Image</span>(elements<span style="color:#ce5c00"><strong>.</strong></span><span style="color:#000000">get</span>(<span style="color:#4e9a06">'2014'</span>))<span style="color:#ce5c00"><strong>,</strong></span></span>
<span style="color:inherit">  ee<span style="color:#ce5c00"><strong>.</strong></span><span style="color:#000000">Image</span>(elements<span style="color:#ce5c00"><strong>.</strong></span><span style="color:#000000">get</span>(<span style="color:#4e9a06">'2015'</span>))<span style="color:#ce5c00"><strong>,</strong></span></span>
<span style="color:inherit">  ee<span style="color:#ce5c00"><strong>.</strong></span><span style="color:#000000">Image</span>(elements<span style="color:#ce5c00"><strong>.</strong></span><span style="color:#000000">get</span>(<span style="color:#4e9a06">'2016'</span>))<span style="color:#ce5c00"><strong>,</strong></span></span>
<span style="color:inherit">  ee<span style="color:#ce5c00"><strong>.</strong></span><span style="color:#000000">Image</span>(elements<span style="color:#ce5c00"><strong>.</strong></span><span style="color:#000000">get</span>(<span style="color:#4e9a06">'2017'</span>))<span style="color:#ce5c00"><strong>,</strong></span></span>
<span style="color:inherit">  ee<span style="color:#ce5c00"><strong>.</strong></span><span style="color:#000000">Image</span>(elements<span style="color:#ce5c00"><strong>.</strong></span><span style="color:#000000">get</span>(<span style="color:#4e9a06">'2018'</span>))</span>
<span style="color:inherit">  ])<span style="color:#ce5c00"><strong>;</strong></span></span>

<span style="color:inherit"><span style="color:#000000">print</span>(collection2)</span>
<span style="color:inherit">Map<span style="color:#ce5c00"><strong>.</strong></span><span style="color:#000000">addLayer</span>(collection2<span style="color:#ce5c00"><strong>,</strong></span>{}<span style="color:#ce5c00"><strong>,</strong></span><span style="color:#4e9a06">'ic'</span>)</span>

<span style="color:inherit"><span style="color:#8f5902"><em>// Define start and end dates.</em></span></span>
<span style="color:inherit"><span style="color:#204a87"><strong>var</strong></span> start <span style="color:#ce5c00"><strong>=</strong></span> <span style="color:#4e9a06">'2008-01-01'</span><span style="color:#ce5c00"><strong>;</strong></span></span>
<span style="color:inherit"><span style="color:#204a87"><strong>var</strong></span> end <span style="color:#ce5c00"><strong>=</strong></span> <span style="color:#4e9a06">'2012-12-31'</span><span style="color:#ce5c00"><strong>;</strong></span></span>

<span style="color:inherit"><span style="color:#8f5902"><em>// Select all images with the months of April to July with a date range.</em></span></span>
<span style="color:inherit"><span style="color:#204a87"><strong>var</strong></span> col <span style="color:#ce5c00"><strong>=</strong></span> ee<span style="color:#ce5c00"><strong>.</strong></span><span style="color:#000000">ImageCollection</span>(<span style="color:#4e9a06">"NASA/OCEANDATA/MODIS-Aqua/L3SMI"</span>)</span>
<span style="color:inherit">  <span style="color:#ce5c00"><strong>.</strong></span><span style="color:#000000">filterDate</span>(start<span style="color:#ce5c00"><strong>,</strong></span> end)</span>
<span style="color:inherit">  <span style="color:#ce5c00"><strong>.</strong></span><span style="color:#000000">filter</span>(ee<span style="color:#ce5c00"><strong>.</strong></span><span style="color:#c4a000">Filter</span><span style="color:#ce5c00"><strong>.</strong></span><span style="color:#000000">calendarRange</span>(<span style="color:#0000cf">4</span><span style="color:#ce5c00"><strong>,</strong></span><span style="color:#0000cf">7</span><span style="color:#ce5c00"><strong>,</strong></span><span style="color:#4e9a06">'month'</span>))</span>
<span style="color:inherit">  <span style="color:#ce5c00"><strong>.</strong></span><span style="color:#000000">filterBounds</span>(geometry)</span>
<span style="color:inherit">  <span style="color:#ce5c00"><strong>.</strong></span><span style="color:#000000">select</span>(<span style="color:#4e9a06">"chlor_a"</span>)<span style="color:#ce5c00"><strong>;</strong></span></span>

<span style="color:inherit"><span style="color:#000000">print</span>(col<span style="color:#ce5c00"><strong>,</strong></span> <span style="color:#4e9a06">"Individual Images By Year"</span>)<span style="color:#ce5c00"><strong>;</strong></span></span>

<span style="color:inherit"><span style="color:#8f5902"><em>// Plot a time series of the chlor_a at a single location </em></span></span>
<span style="color:inherit"><span style="color:#8f5902"><em>// or summarize values within an area.</em></span></span>
<span style="color:inherit"><span style="color:#204a87"><strong>var</strong></span> l8Chart <span style="color:#ce5c00"><strong>=</strong></span> ui<span style="color:#ce5c00"><strong>.</strong></span><span style="color:#c4a000">Chart</span><span style="color:#ce5c00"><strong>.</strong></span><span style="color:#c4a000">image</span><span style="color:#ce5c00"><strong>.</strong></span><span style="color:#000000">series</span>({<span style="color:#204a87">imageCollection</span><span style="color:#ce5c00"><strong>:</strong></span> col<span style="color:#ce5c00"><strong>,</strong></span></span>
<span style="color:inherit">  <span style="color:#204a87">region</span><span style="color:#ce5c00"><strong>:</strong></span> roi<span style="color:#ce5c00"><strong>,</strong></span></span>
<span style="color:inherit">  <span style="color:#204a87">reducer</span><span style="color:#ce5c00"><strong>:</strong></span> ee<span style="color:#ce5c00"><strong>.</strong></span><span style="color:#c4a000">Reducer</span><span style="color:#ce5c00"><strong>.</strong></span><span style="color:#000000">median</span>()}</span>
<span style="color:inherit">)<span style="color:#ce5c00"><strong>.</strong></span><span style="color:#000000">setChartType</span>(<span style="color:#4e9a06">'ScatterChart'</span>)<span style="color:#ce5c00"><strong>;</strong></span></span>

<span style="color:inherit"><span style="color:#000000">print</span>(l8Chart)<span style="color:#ce5c00"><strong>;</strong></span></span></code></span></span></span></span>