
introduce
Through a complete example, Prometheus monitoring middleware is added to the micro service based on GoFrame framework.
What is Prometheus monitoring interceptor / Middleware?
The monitoring interceptor will record Prometheus Metrics for each API request.
We will use rk-boot To start the micro service of GoFrame framework.
Please visit the following address for a complete tutorial: https://rkdocs.netlify.app/cn
install
go get github.com/rookie-ninja/rk-boot/gf
Quick start
rk-boot The default integration is as follows: open source libraries.
- rk-prom Start the library as a Prometheus client.
1. Create boot yaml
boot.yaml file describes the original information of Gin framework startup. Rk boot reads boot Yaml to start GoFrame.
To verify, we launched the following options:
- commonService: commonService contains a series of general API s. details
- prom: Prometheus client.
- prometheus middleware: start prometheus middleware.
---
gf:
  - name: greeter                     # Required
    port: 8080                        # Required
    enabled: true                     # Required
    prom:
      enabled: true                   # Optional, default: false
    commonService:
      enabled: true                   # Optional, default: false
    interceptors:
      metricsProm:
        enabled: true                 # Optional, default: false
2. Create main go
Add / v1/greeter API.
// Copyright (c) 2021 rookie-ninja
//
// Use of this source code is governed by an Apache-style
// license that can be found in the LICENSE file.
package main

import (
	"context"
	"fmt"
	"github.com/gogf/gf/v2/net/ghttp"
	"github.com/rookie-ninja/rk-boot"
	"github.com/rookie-ninja/rk-boot/gf"
	"net/http"
)

// Application entrance.
func main() {
	// Create a new boot instance.
	boot := rkboot.NewBoot()

	// Register handler
	gfEntry := rkbootgf.GetGfEntry("greeter")
	gfEntry.Server.BindHandler("/v1/greeter", func(ctx *ghttp.Request) {
		ctx.Response.WriteHeader(http.StatusOK)
		ctx.Response.WriteJson(&GreeterResponse{
			Message: fmt.Sprintf("Hello %s!", ctx.GetQuery("name")),
		})
	})

	// Bootstrap
	boot.Bootstrap(context.Background())

	// Wait for shutdown sig
	boot.WaitForShutdownSig(context.Background())
}

type GreeterResponse struct {
	Message string
}
3. Folder structure
$ tree
.
├── boot.yaml
├── go.mod
├── go.sum
└── main.go

0 directories, 4 files
4. Start main go
$ go run main.go

2021-12-30T17:20:07.845+0800    INFO    boot/gf_entry.go:1050   Bootstrap gfEntry       {"eventId": "77d63142-a252-4f65-bbfd-a30d6a96f1a7", "entryName": "greeter"}
------------------------------------------------------------------------
endTime=2021-12-30T17:20:07.845672+08:00
startTime=2021-12-30T17:20:07.845328+08:00
elapsedNano=344309
timezone=CST
ids={"eventId":"77d63142-a252-4f65-bbfd-a30d6a96f1a7"}
app={"appName":"rk","appVersion":"","entryName":"greeter","entryType":"GfEntry"}
env={"arch":"amd64","az":"*","domain":"*","hostname":"lark.local","localIP":"10.8.0.2","os":"darwin","realm":"*","region":"*"}
payloads={"commonServiceEnabled":true,"commonServicePathPrefix":"/rk/v1/","gfPort":8080,"promEnabled":true,"promPath":"/metrics","promPort":8080}
error={}
counters={}
pairs={}
timing={}
remoteAddr=localhost
operation=Bootstrap
resCode=OK
eventStatus=Ended
EOE
5. Verification
- Send the request to the / rk / V1 / health API in CommonService.
$ curl -X GET localhost:8080/rk/v1/healthy
{"healthy":true}
- Send the request to the / v1/greeter API.
curl -X GET "localhost:8080/v1/greeter?name=rk-dev"
{"Message":"Hello rk-dev!"}
To access the Prometheus client: http://localhost:8080/metrics
Visual monitoring
We have started prometheus monitoring in the local process. The rest is how to view the monitoring in a [beautiful] Web page.
There are many tools on the market, but we choose [simple], [popular] and [free], that is Prometheus + Grafana.
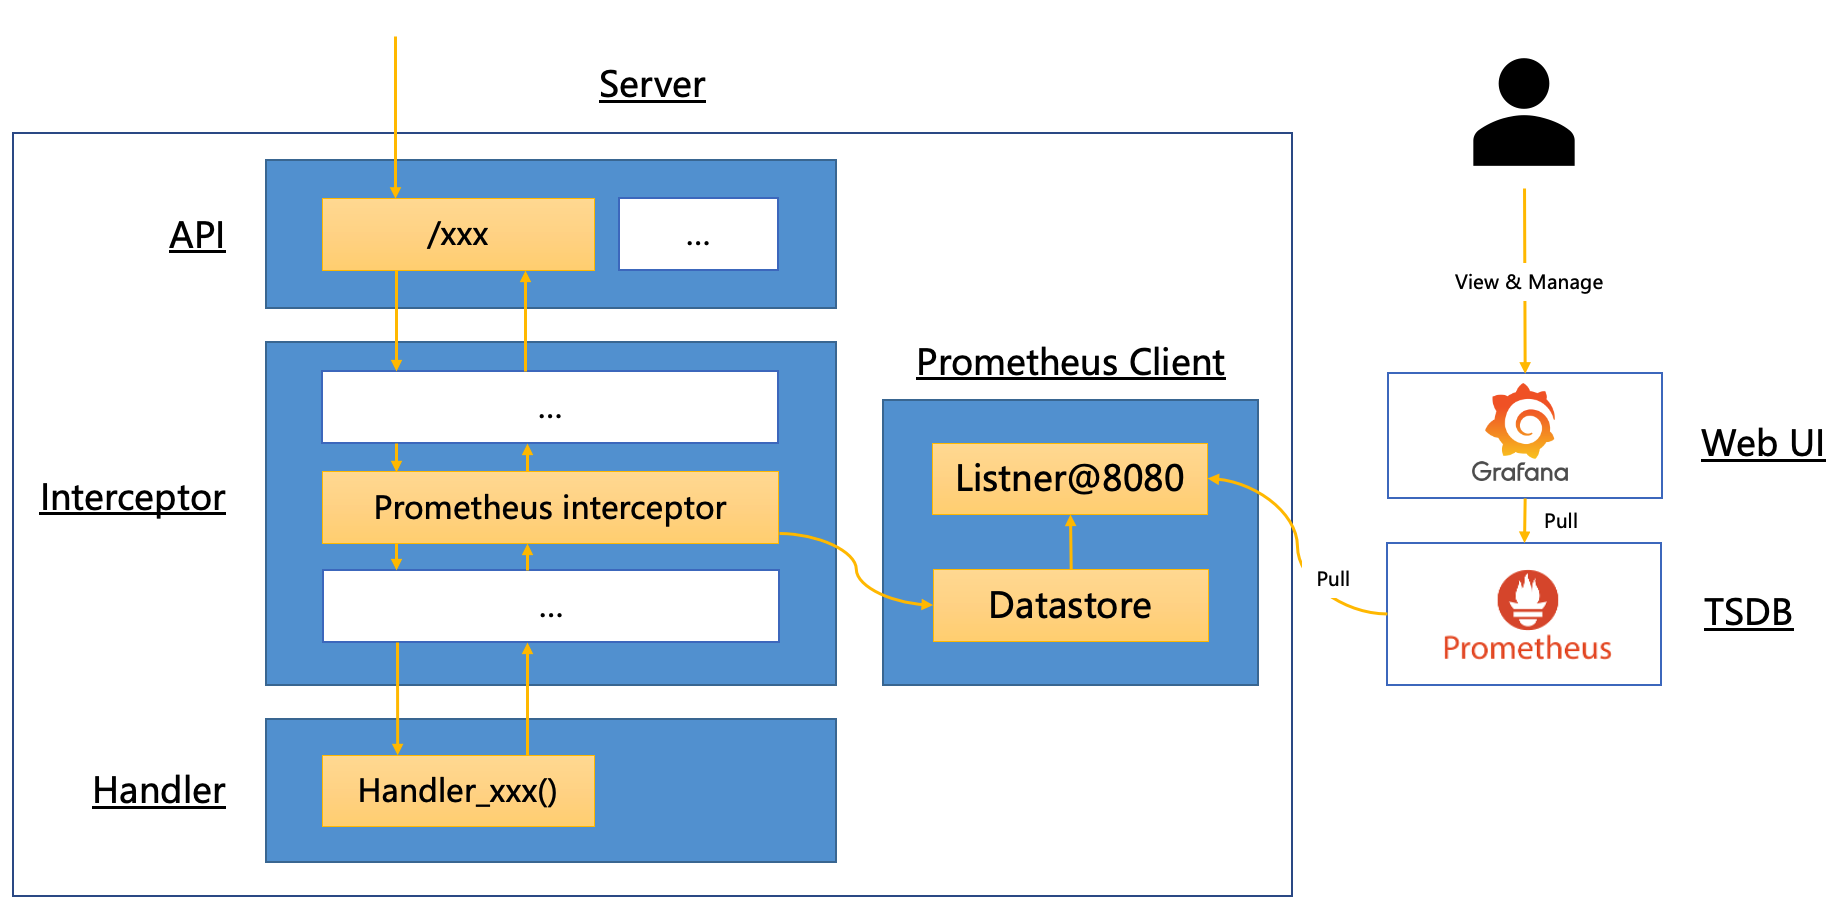
Architecture diagram
Let's take a look at the whole process.
In fact, the principle is very simple. It is to [hijack] API requests and record [time], [error code] and other information. Then, let Prometheus service take the initiative to pull data from [created service]. Finally, let Grafana service pull data from Prometheus and display the data table.
Quick start
1. Create Prometheus yml
Let's first create prometheus The YML configuration file enables the prometheus service to pull data from localhost:8080/metrics.
In the following configuration, we do not specify / metrics, because prometheus will use / metrics to pull data by default.
be careful! We set targets to host docker. Internal: 8080 instead of localhost:8080, because prometheus is in the container and our services are in the local.
This is a convenient way to access the port of the local machine from the container. explain
global:
  scrape_interval: 1s # Make scrape interval to 1s for testing.

# A scrape configuration containing exactly one endpoint to scrape:
# Here it's Prometheus itself.
scrape_configs:
  - job_name: 'rk-demo'
    scrape_interval: 1s
    static_configs:
      - targets: ['host.docker.internal:8080']
2. Start Prometheus
We use docker To start.
Prometheus uses 9090 port by default.
$ docker run -p 9090:9090 -v /<your path>/rk-demo/prometheus.yml:/etc/prometheus/prometheus.yml prom/prometheus
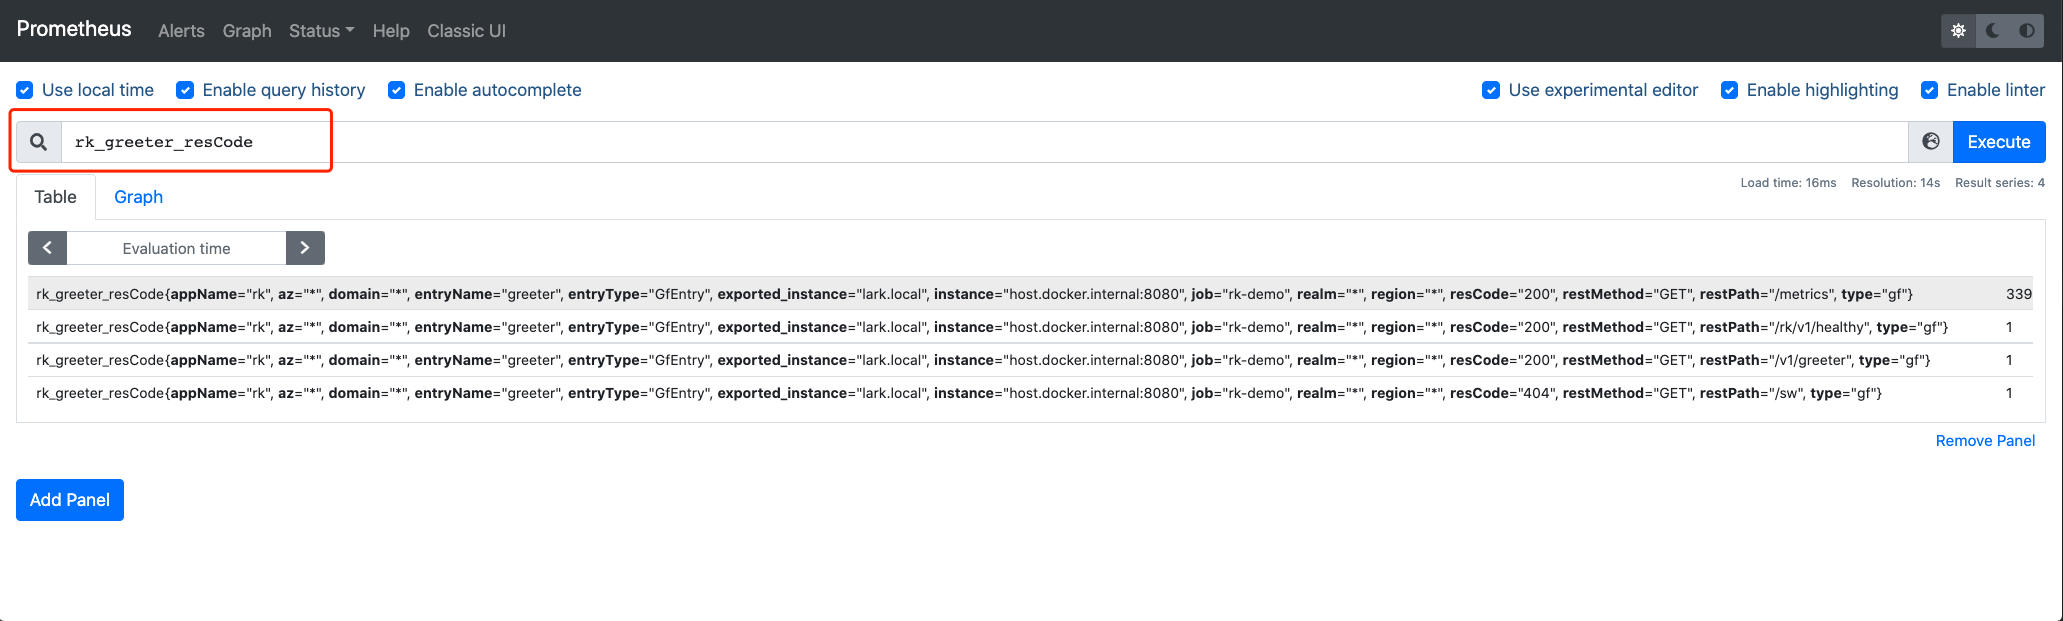
3. Verify Prometheus
Please start main.go according to the above [verification] and send a / rk / V1 / health request.
Then, let's take a look at the data in the prometheus service.
Visit: localhost:9090 and search rk_greeter_resCode, we can see that the data is already in prometheus.
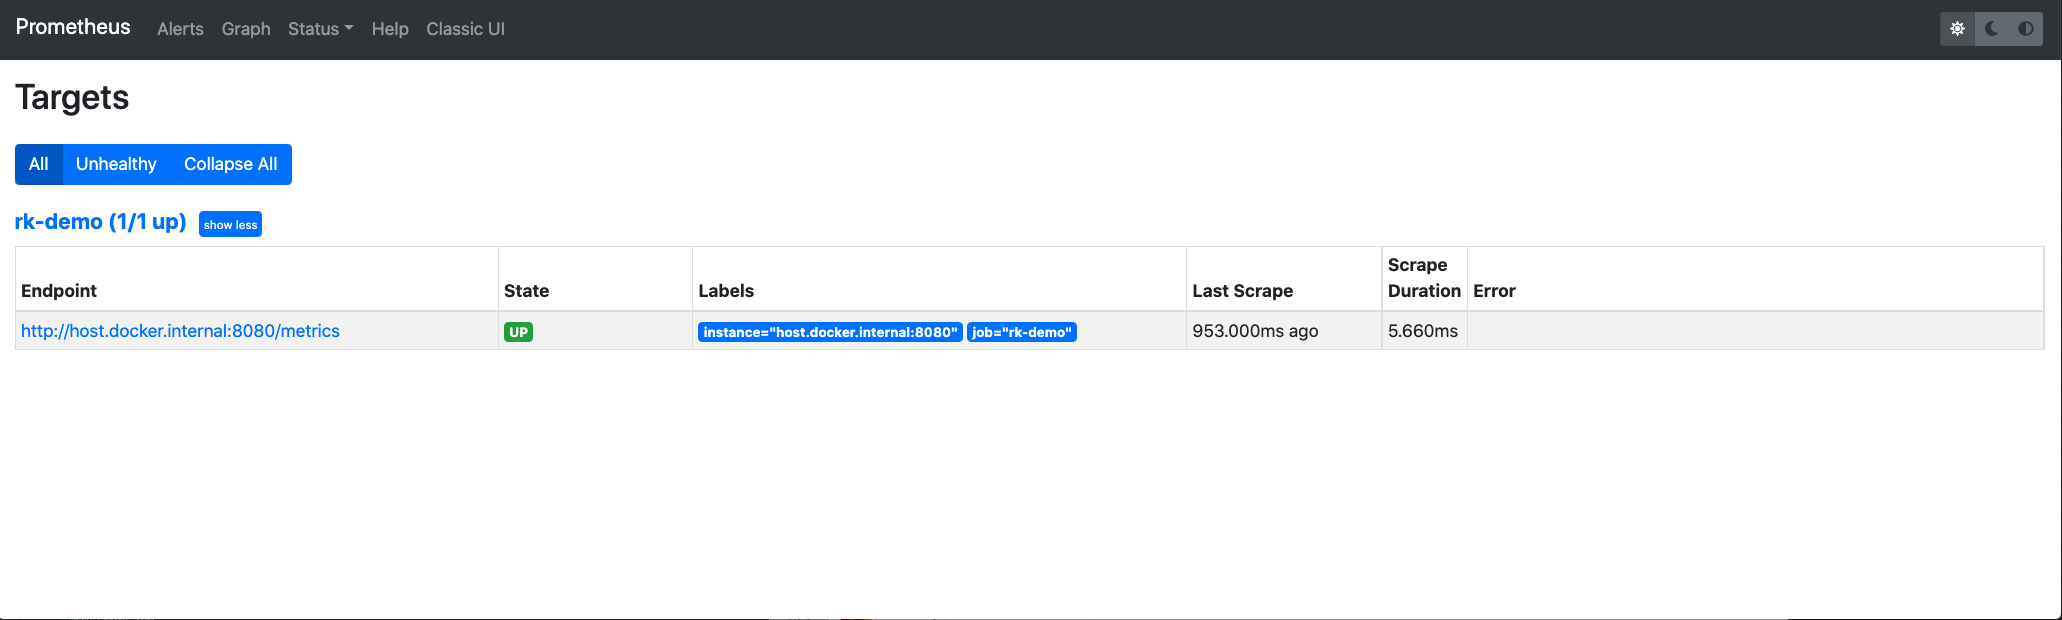
Visit: localhost:9090/targets. We can see that prometheus has pulled data every second.
4. Start Grafana
Grafana uses 3000 ports by default.
$ docker run -p 3000:3000 --name grafana grafana/grafana
Visit: localhost:3000
At this time, grafana will let you log in. The default user name and password are as follows.
User name: admin Password: admin
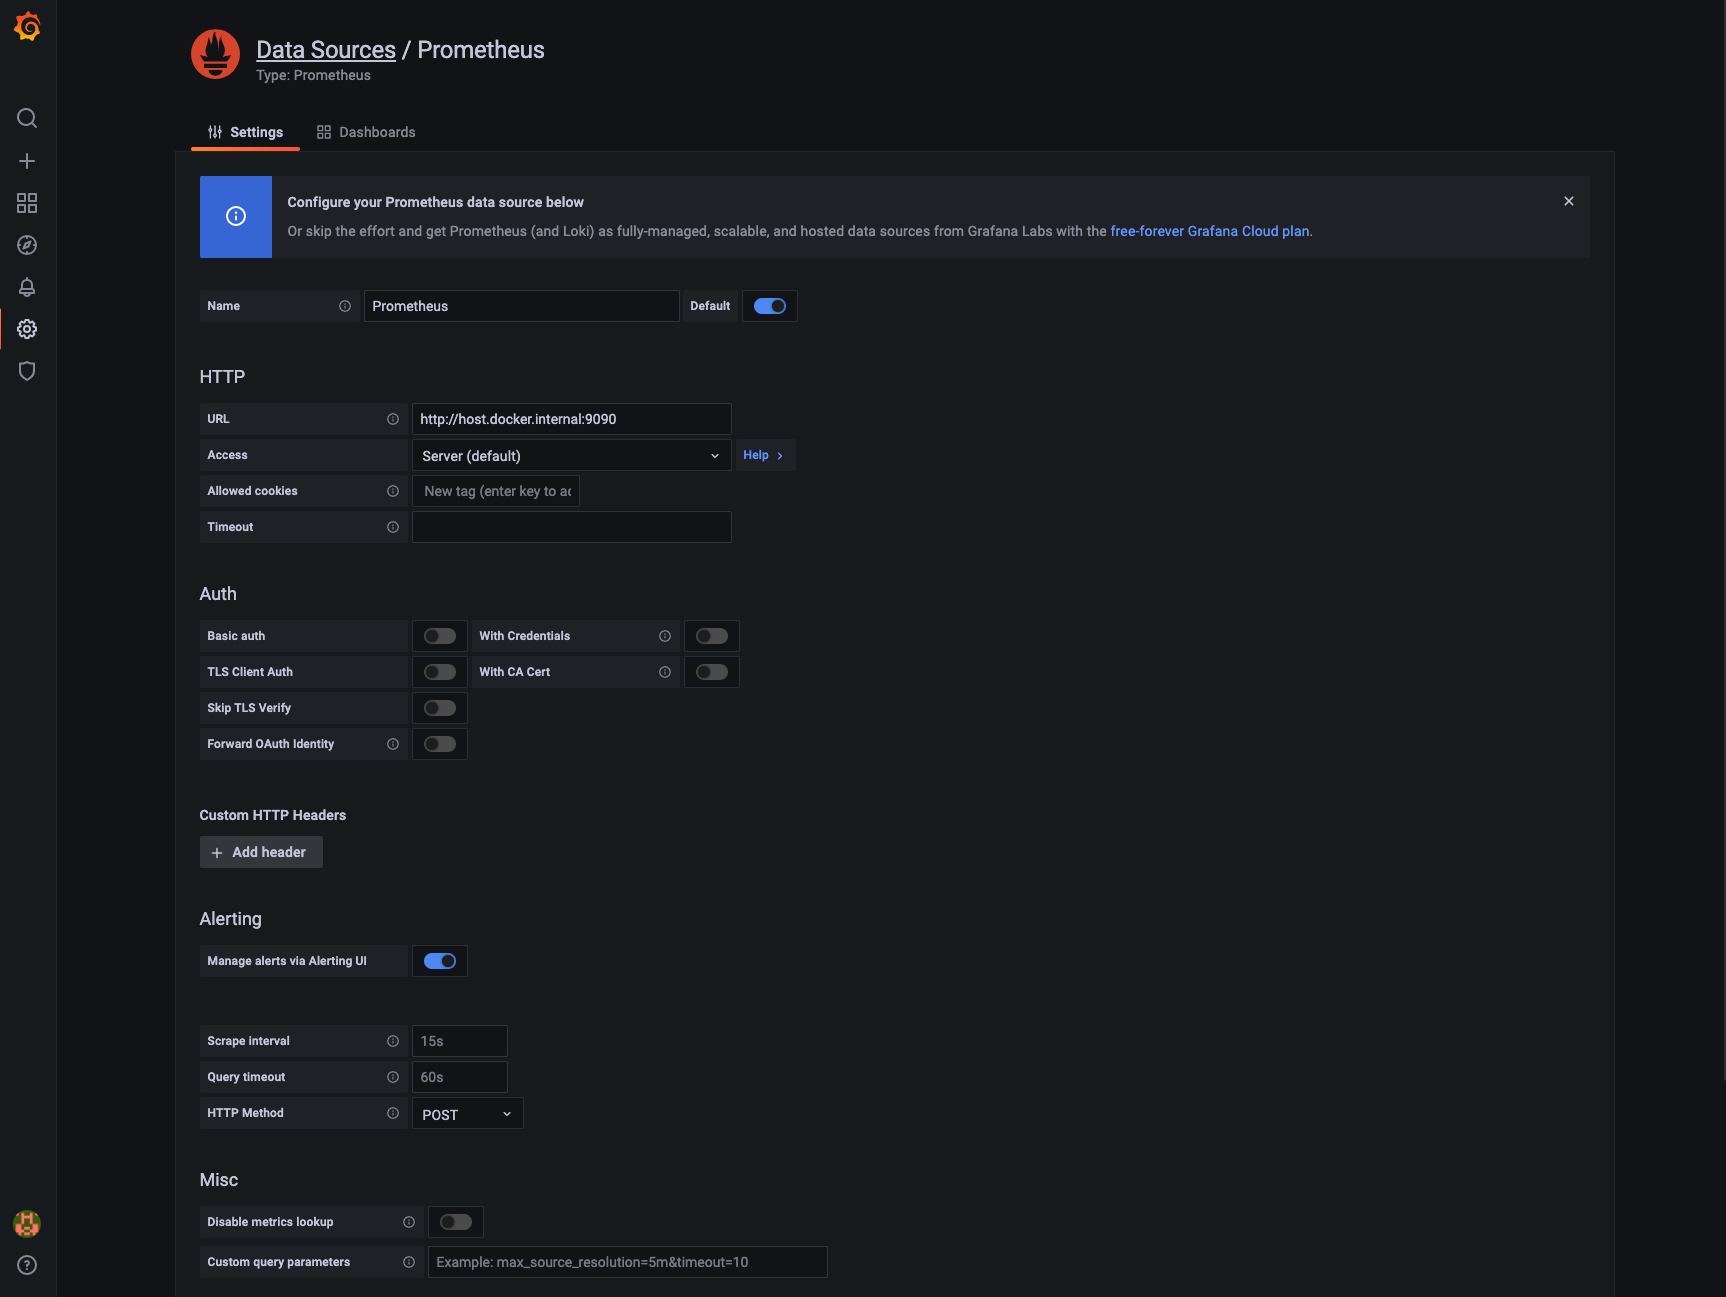
5. Add Prometheus data source in Grafana
Grafana is just a Web UI tool. In order to see the data report, we tell grafana where to find Prometheus.
Select Prometheus as the data source.

Filling in the Prometheus address is the same as above. Because Grafana runs in Docker, we do not use localhost:9090, but host Docker. internal:9090.
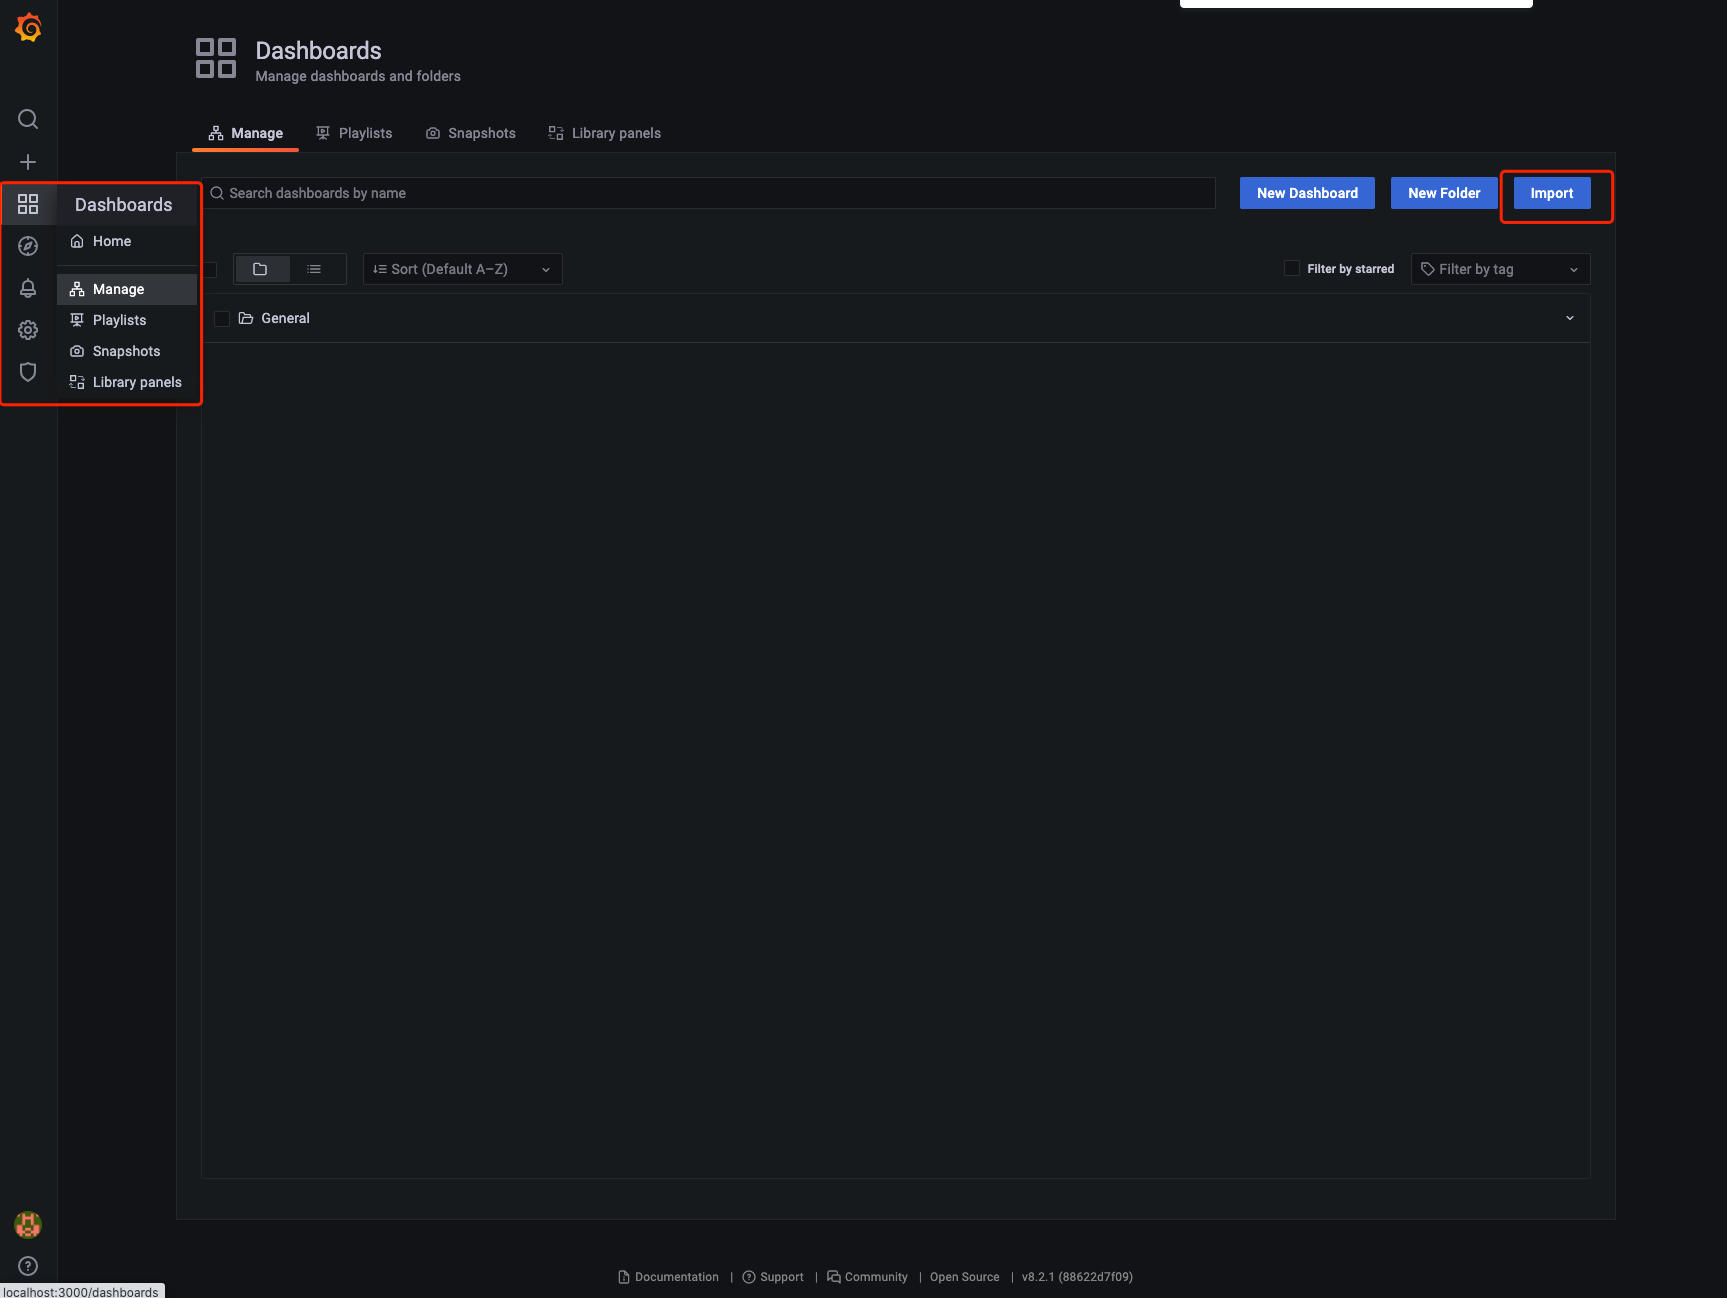
6. Import Dashboard
We can edit Grafana Dashboard by ourselves, but this is not an easy task. For services started with rk boot, we provide the default [free] Grafana Dashboard template.
Note that the Dashboard imported here only matches the service created according to the above logic.
Why? Because rk boot uses rk by default_< Entry name >_ XXX as the metrics name of prometheus.
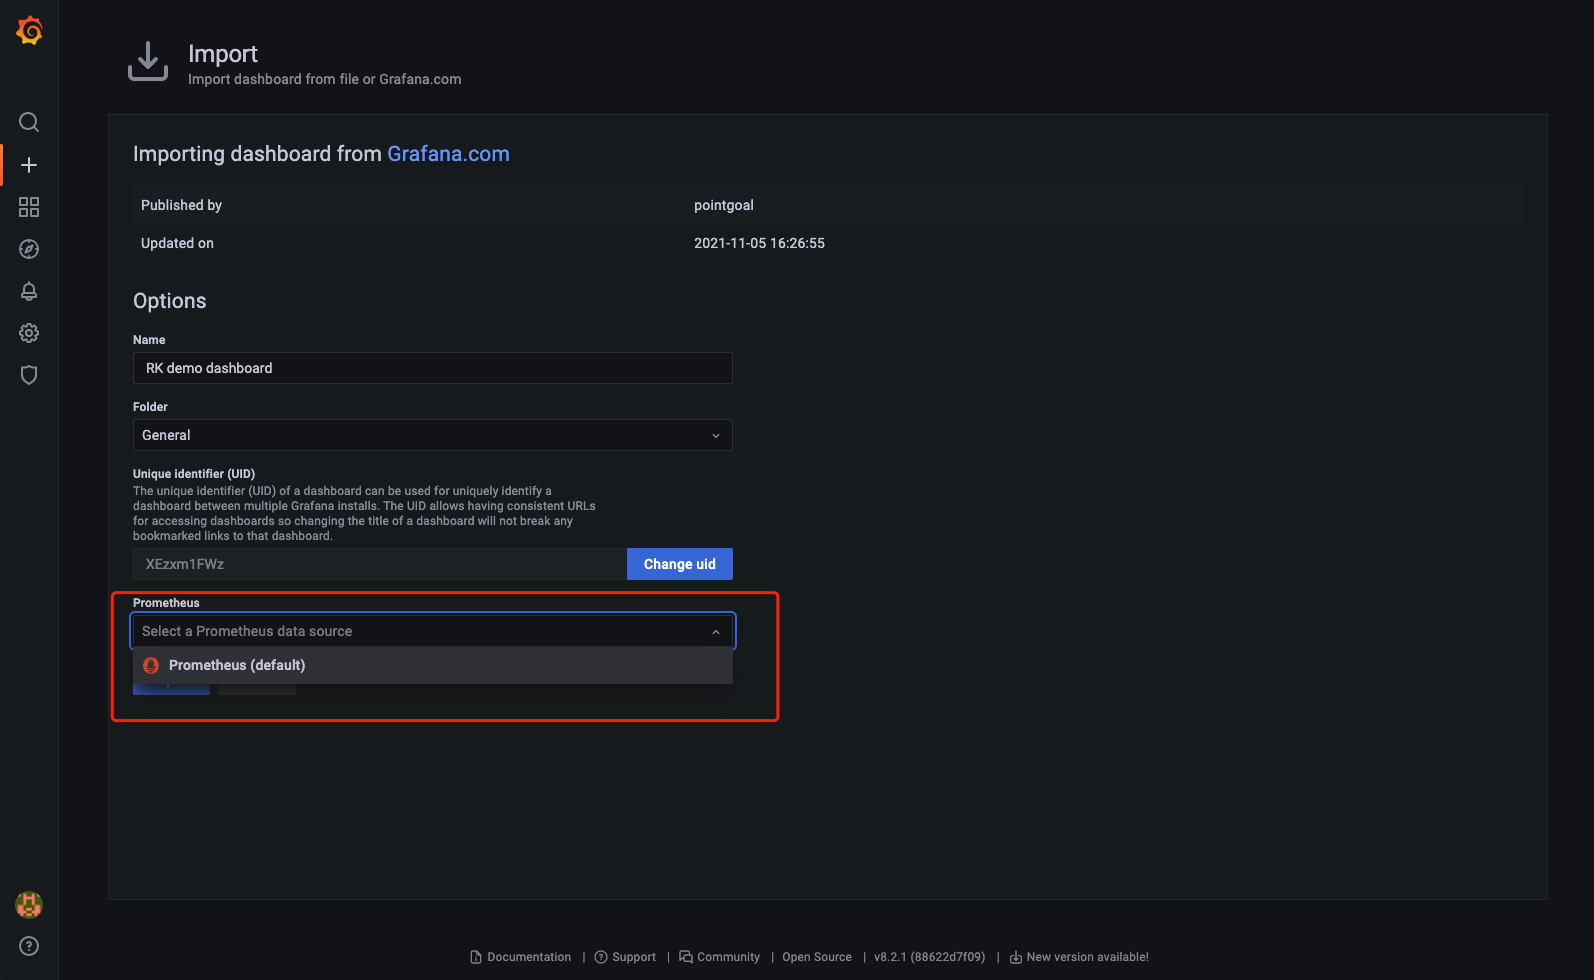
Move to Dashboard import page
Import No. 15111 Dashboard, which is defined in: https://grafana.com/grafana/dashboards/15111
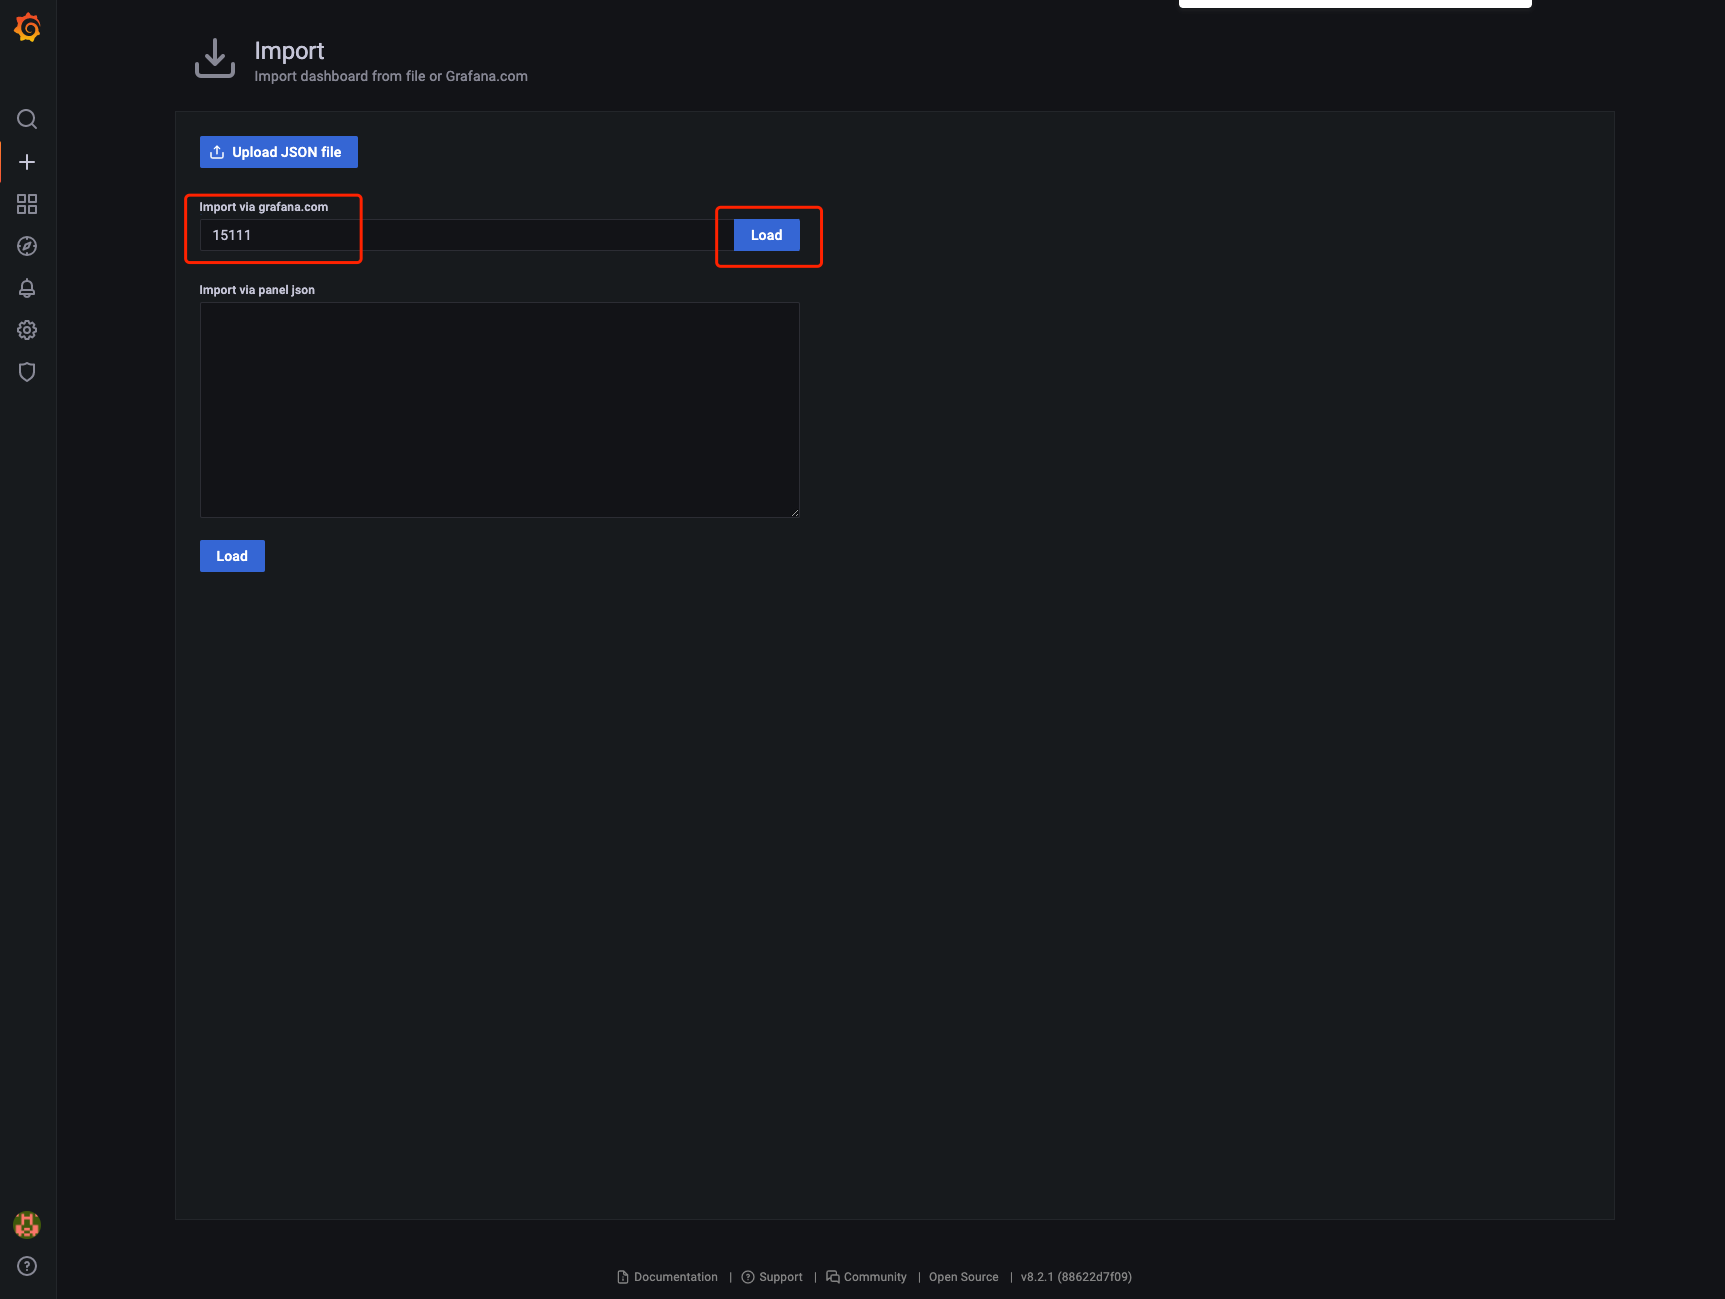
Specify the Prometheus data source, which is the Prometheus we configured above.
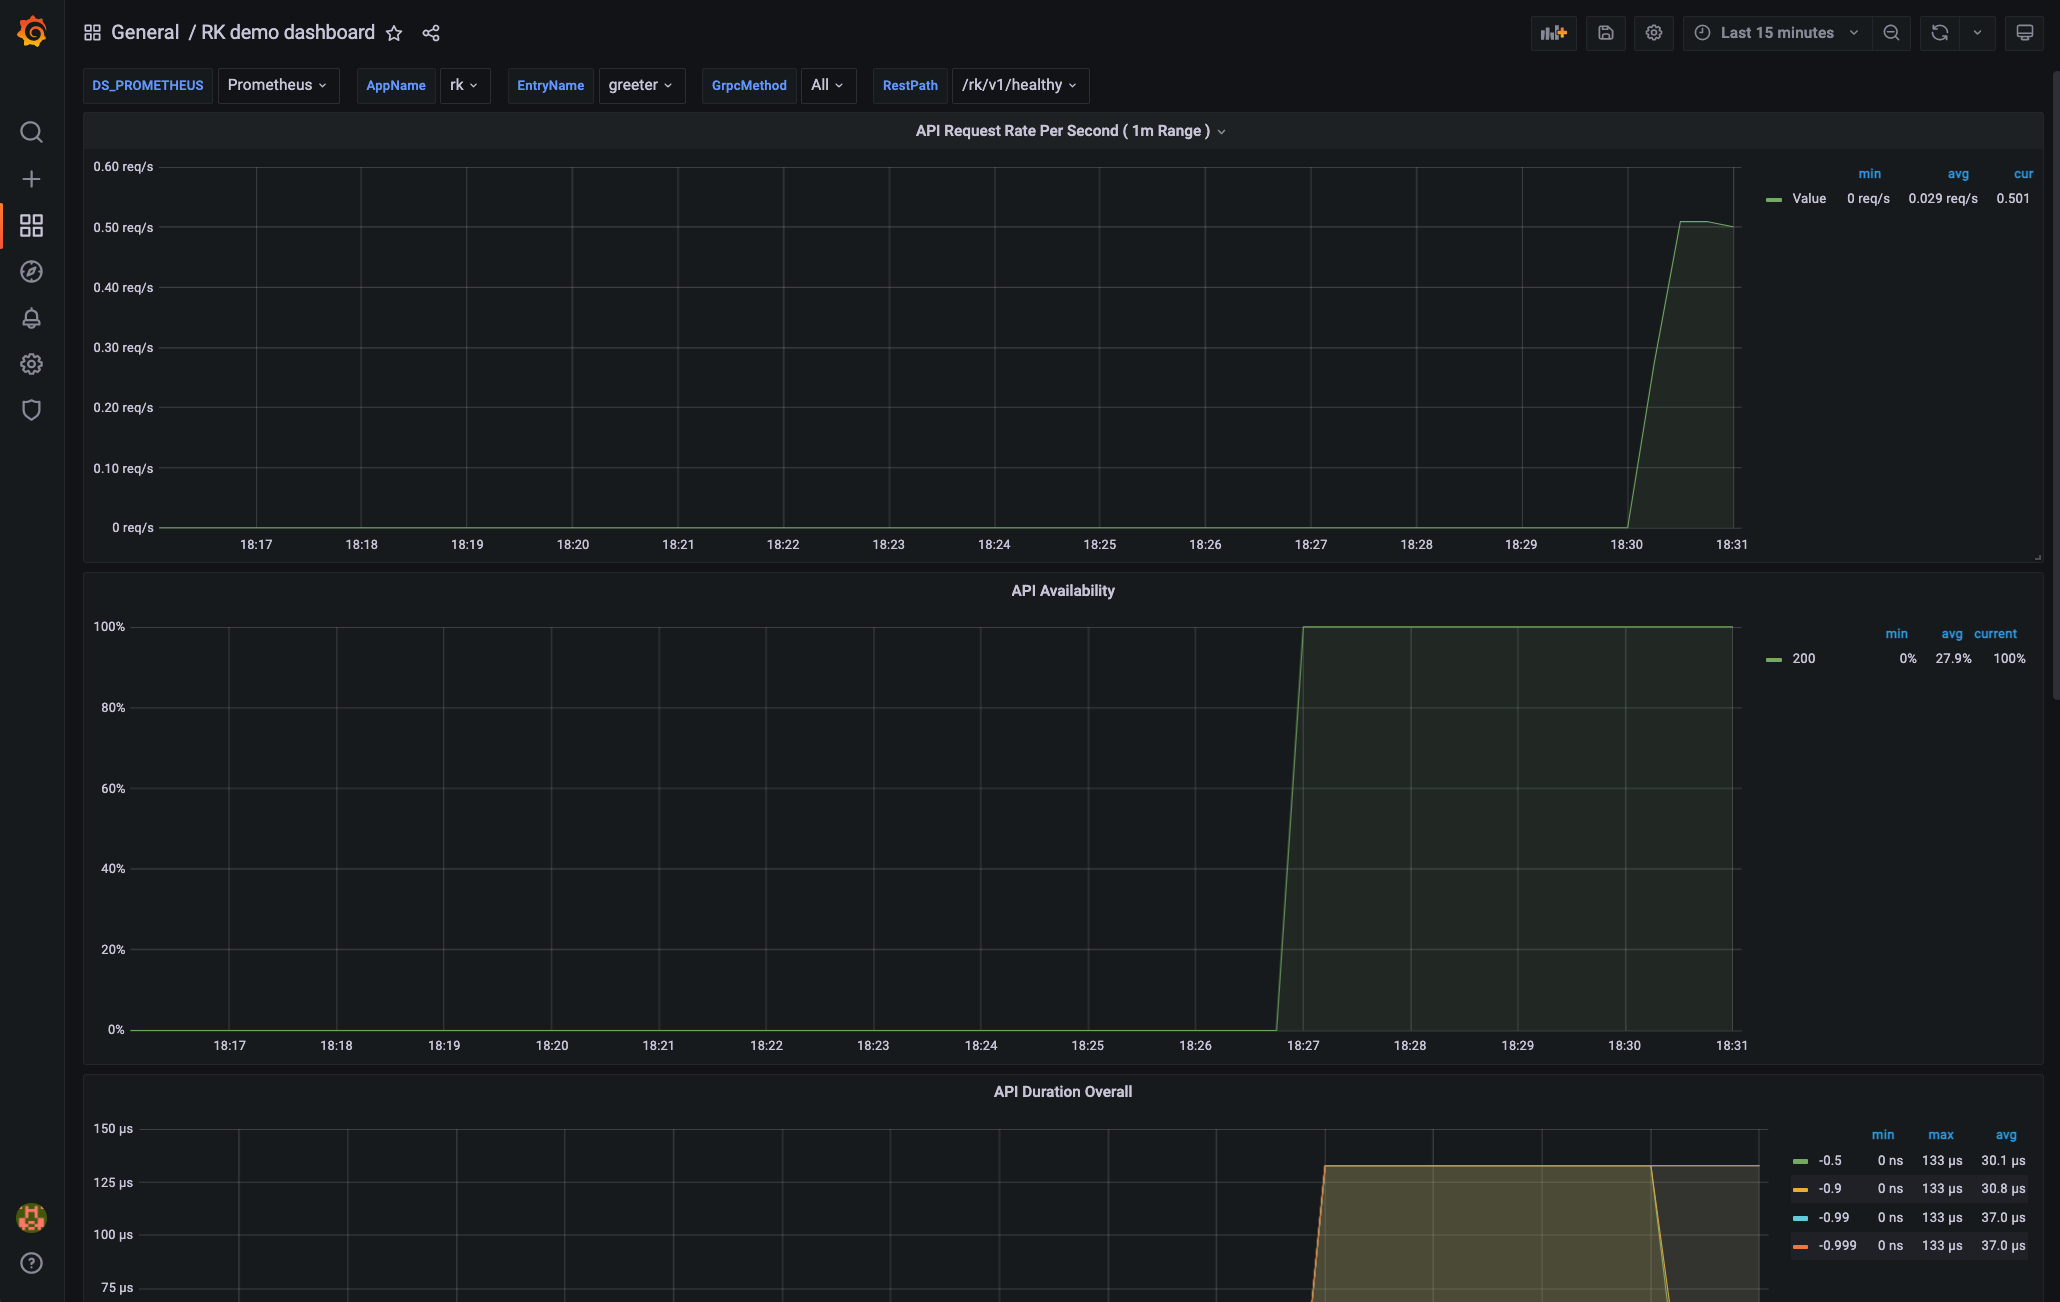
Start monitoring
be careful! If the number of requests is too small, it will be displayed as 0. Please send more requests.
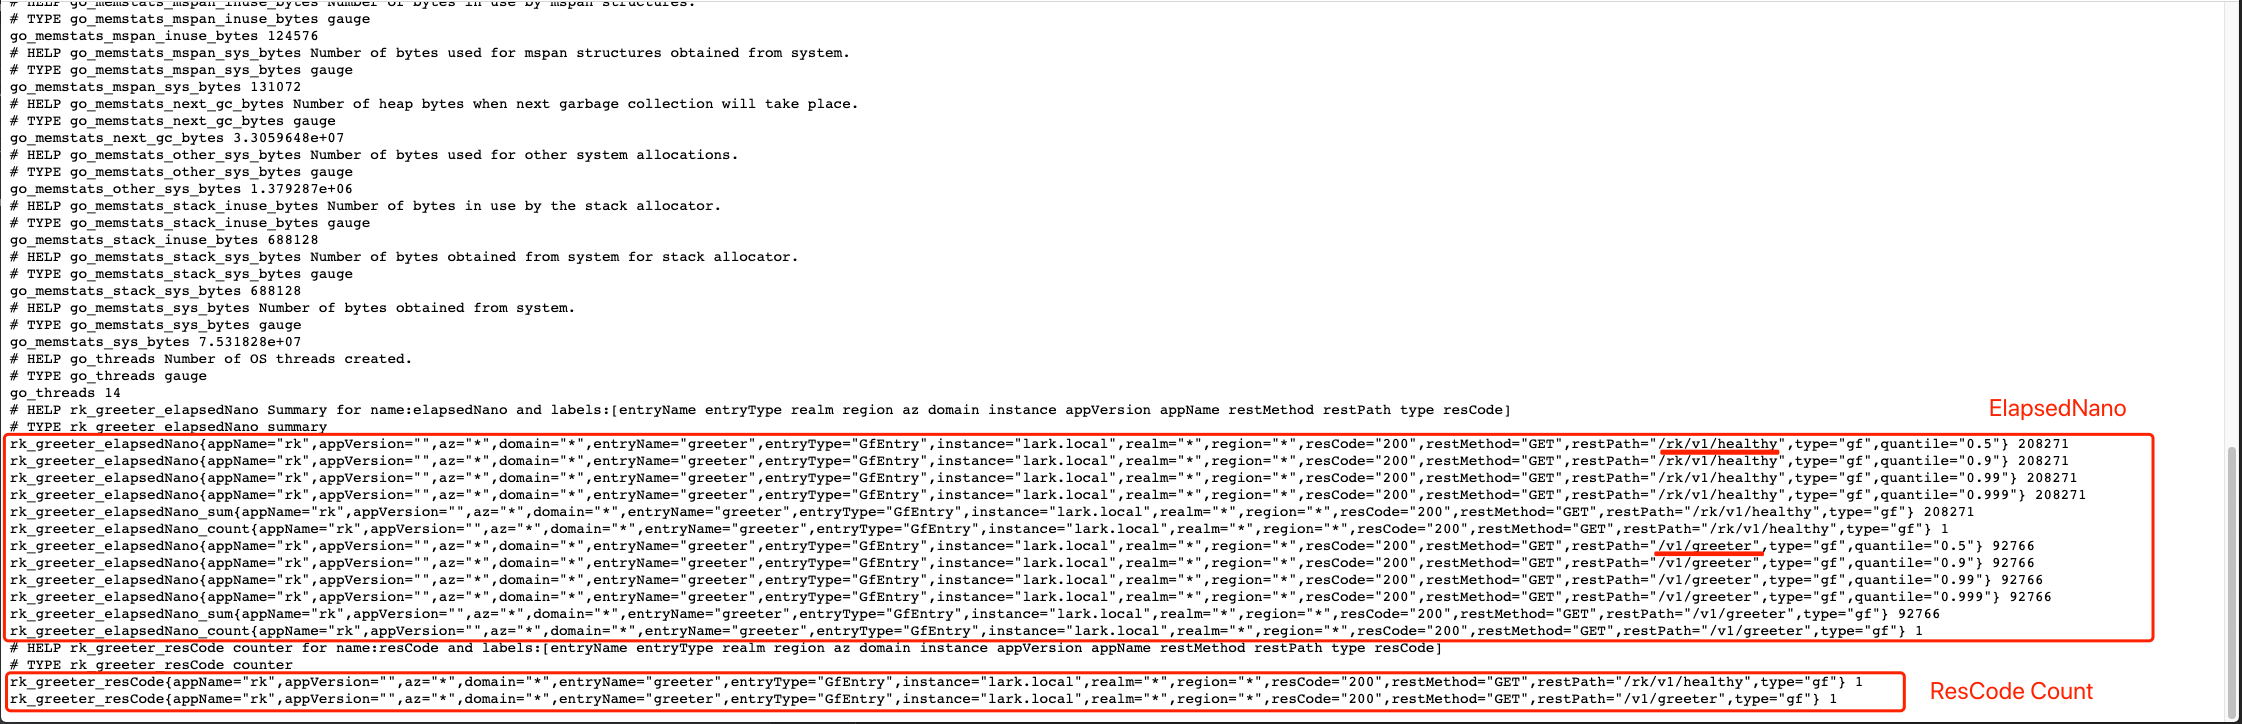
concept
We can already get monitoring data from Grafana. Now look at the middleware in rk boot and what types of monitoring data have been added.
The monitoring interceptor will record the following monitoring by default.
| Monitoring item | data type | details |
|---|---|---|
| elapsedNano | Summary | RPC time consuming |
| resCode | Counter | Counter based on RPC return code |
| errors | Counter | RPC error based counters |
The above three monitoring items have the following labels.
| label | details |
|---|---|
| entryName | Gin entry name |
| entryType | Gin entry type |
| realm | Environment variable: REALM, eg: rk |
| region | Environment variable: REGION, eg: beijing |
| az | Environment variable: AZ, eg: beijing-1 |
| domain | Environment variable: DOMAIN, eg: prod |
| instance | Local Hostname |
| appVersion | from AppInfoEntry obtain |
| appName | from AppInfoEntry obtain |
| restMethod | Http method. eg: GET |
| restPath | Http path. eg: /rk/v1/healthy |
| type | Service type. eg: Gin |
| resCode | Return code, eg: OK |