brief introduction
Tracking profiling is not available for most services.But if you encounter the following problems, you might as well try:
- Suspect which partnership is slow
- System call problem
- Collaborative scheduling problems (chan interaction, mutex, semaphore, etc.)
- It is suspected that gc (Garbage-Collect) affects service performance
- Network Blocking
- Wait
To be frank, you can see what each collaboration is doing at some point by following the analysis.
Trace data is the first requirement for tracing analysis.You can either insert a trace into your code or download it via pprof as mentioned in the previous section.
Example
Code
The following is a direct code insertion to get trace. Content can involve network requests, asynchronous execution of collaborations, and so on.
package main

import (
	"io/ioutil"
	"math/rand"
	"net/http"
	"os"
	"runtime/trace"
	"strconv"
	"sync"
	"time"
)


var wg sync.WaitGroup
var httpClient = &http.Client{Timeout: 30 * time.Second}

func SleepSomeTime() time.Duration{
	return time.Microsecond * time.Duration(rand.Int()%1000)
}

func create(readChan chan int) {
	defer wg.Done()
	for i := 0; i < 500; i++ {
		readChan <- getBodySize()
		SleepSomeTime()
	}
	close(readChan)
}

func convert(readChan chan int, output chan string) {
	defer wg.Done()
	for readChan := range readChan {
		output <- strconv.Itoa(readChan)
		SleepSomeTime()
	}
	close(output)
}

func outputStr(output chan string) {
	defer wg.Done()
	for _ = range output {
		// do nothing
		SleepSomeTime()
	}
}

// Get taobao page size
func getBodySize() int {
	resp, _ := httpClient.Get("https://taobao.com")
	res, _ := ioutil.ReadAll(resp.Body)
	_ = resp.Body.Close()
	return len(res)
}

func run() {
	readChan, output := make(chan int), make(chan string)
	wg.Add(3)
	go create(readChan)
	go convert(readChan, output)
	go outputStr(output)
}

func main() {
	f, _ := os.Create("trace.out")
	defer f.Close()
	_ = trace.Start(f)
	defer trace.Stop()
	run()
	wg.Wait()
}
Compile, execute, and start trace;
[~/blog]$ go build trace_example.go
[~/blog]$ ./trace_example
[~/blog]$ go tool trace -http=":8000" trace_example trace.out
2020/04/15 17:34:48 Parsing trace...
2020/04/15 17:34:50 Splitting trace...
2020/04/15 17:34:51 Opening browser. Trace viewer is listening on http://0.0.0.0:8000
Then open your browser and access port 8000.
Trace function
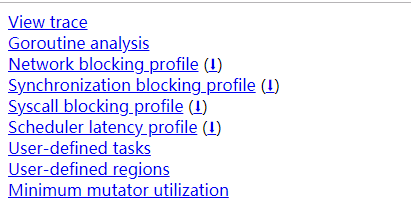
Where:
View trace: View trace (my example above is short in time, so there are no segments, by time slices)
Goroutine analysis:Goroutine analysis
Network blocking profile: Overview of network congestion
Synchronization blocking profile: Synchronization blocking profile
Syscall blocking profile: overview of system call blocking
Scheduler latency profile: Schedule latency profile
User defined tasks: User defined tasks
User defined regions: User defined regions
Minimum mutator utilization: Minimum Mutator utilization (mostly GC evaluation criteria, not understood for the time being)
goroutine scheduling analysis
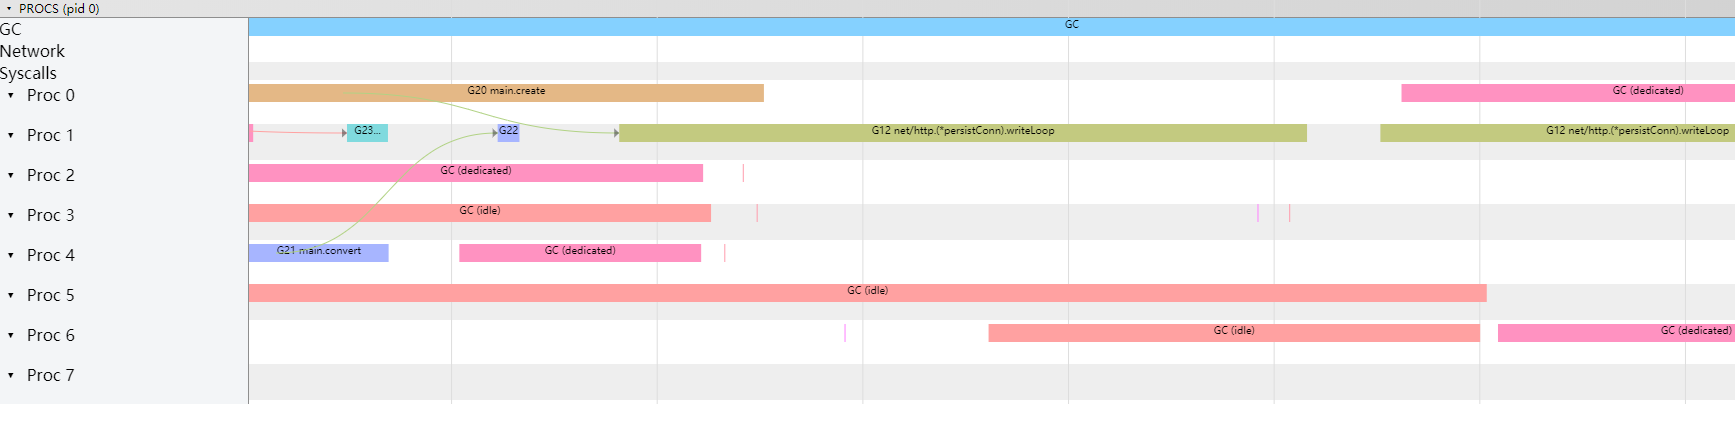
The following figure contains two events:
- The network-related main.create triggers the network write protocol, the network write protocol writeLoop, and waits for the network to return.
- GC-related operations
Below is the web request to the data, triggered from epoll, and then the readLoop protocol responds, directly triggering the execution of the main.create protocol.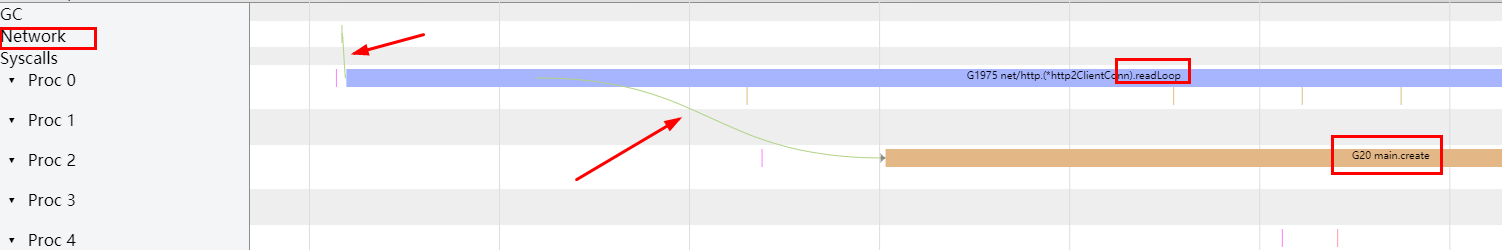
Of course, we can also filter out the collaboration for specific analysis, enter from Goroutine analysis, and select the specific collaboration for analysis: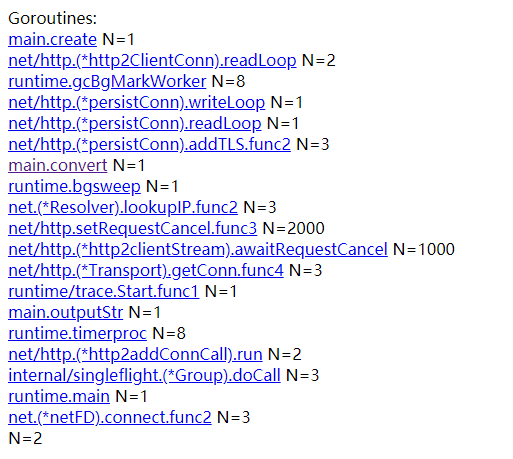
We chose to analyze the main.create process (a slightly more complex one with more things to analyze)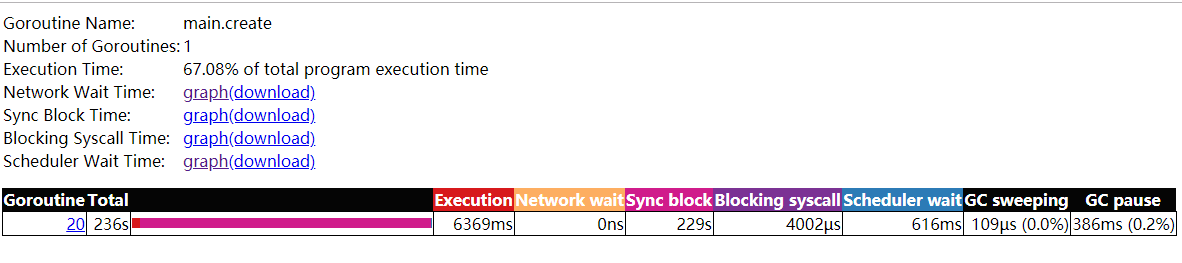
As you can see from the diagram, network wakes up the readLoop protocol, which in turn notifies the main.create protocol.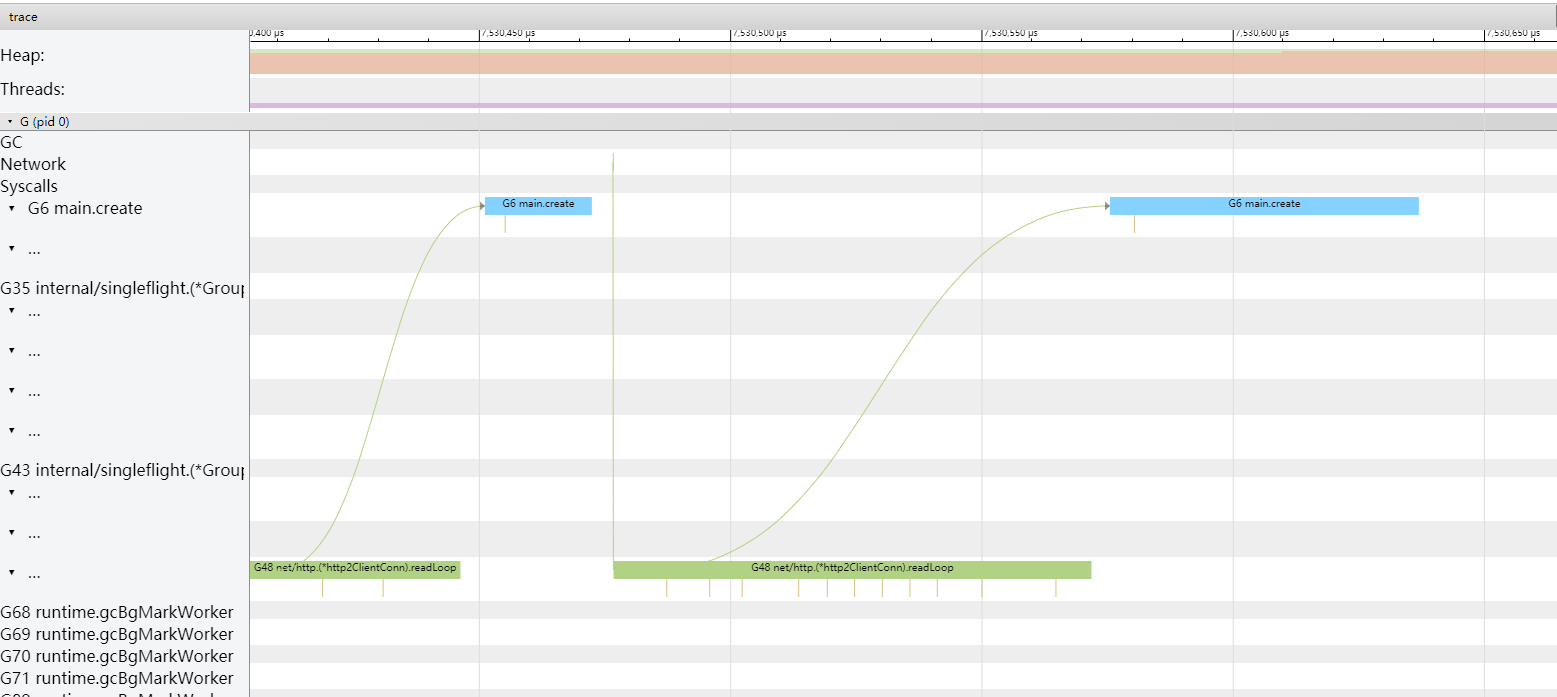
Of course, we can also choose the main.convert protocol.You can see that the collaboration is awakened by main.create (because the data is provided to chan)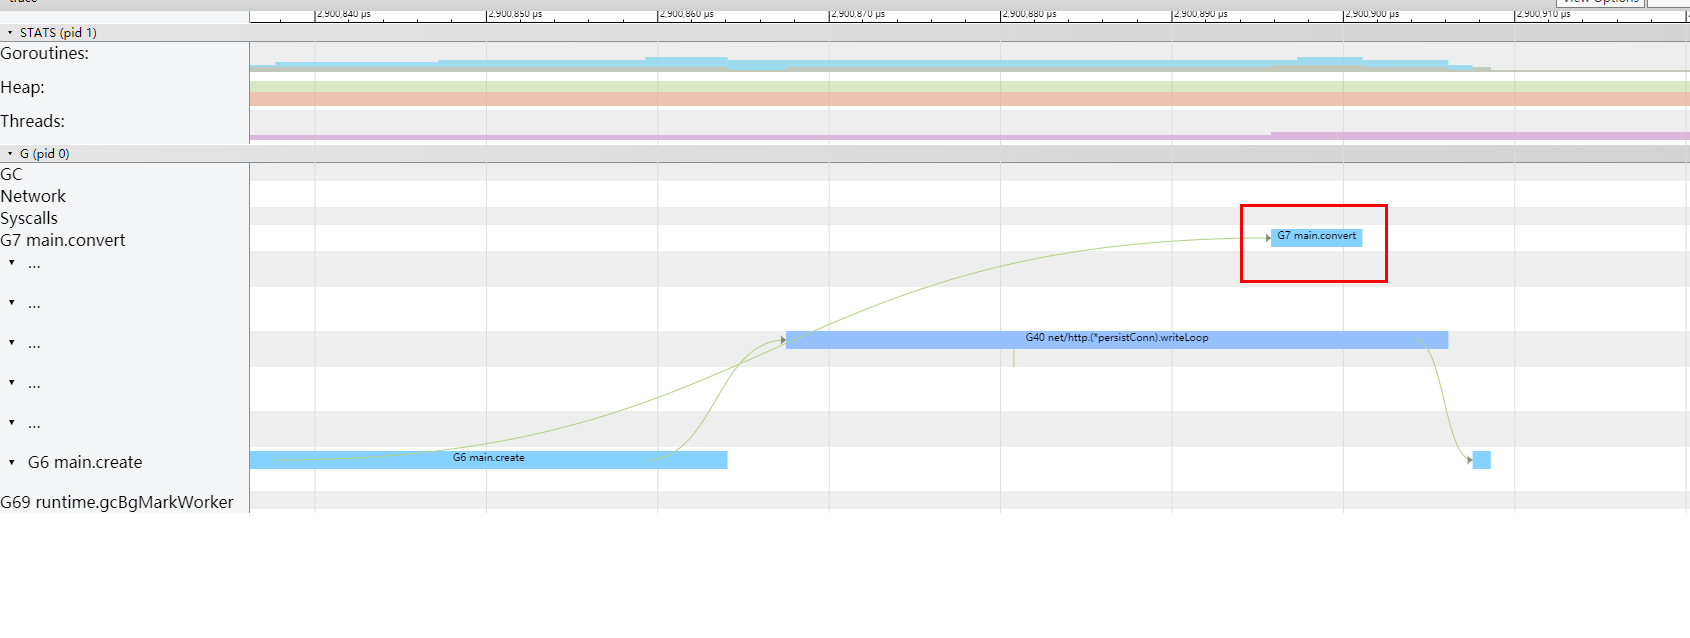
In addition to analyzing goroutine scheduling, you can also do network congestion analysis, asynchronous congestion analysis, system scheduling congestion analysis, and collaborative scheduling congestion analysis (figure below)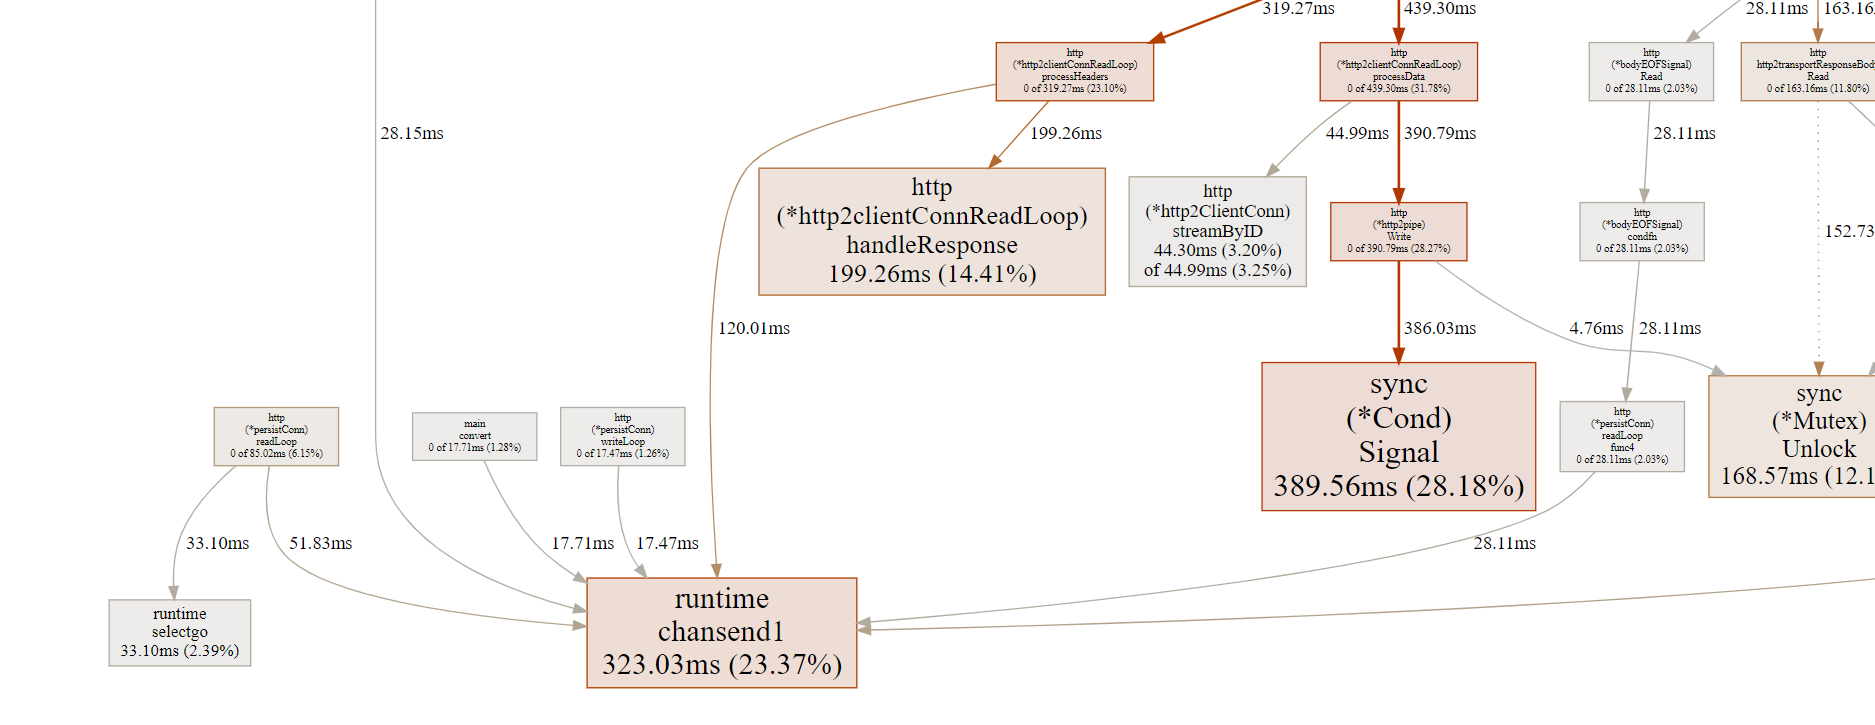
Customize Task and Region
Of course, you can also specify task and Region for analysis. Here is an official example:
//filepath:  src/runtime/trace/trace.go
ctx, task := trace.NewTask(ctx, "makeCappuccino")
trace.Log(ctx, "orderID", orderID)

milk := make(chan bool)
espresso := make(chan bool)

go func() {
        trace.WithRegion(ctx, "steamMilk", steamMilk)
        milk <- true
}()
go func() {
        trace.WithRegion(ctx, "extractCoffee", extractCoffee)
        espresso <- true
}()
go func() {
        defer task.End() // When assemble is done, the order is complete.
        <-espresso
        <-milk
        trace.WithRegion(ctx, "mixMilkCoffee", mixMilkCoffee)
}()
MMU Diagram
In addition, a Minimum Mutator Utilization graph (mmu graph) is provided.
mmu diagram, the number axis is the percentage of cpu a service can occupy (gc operations for other times)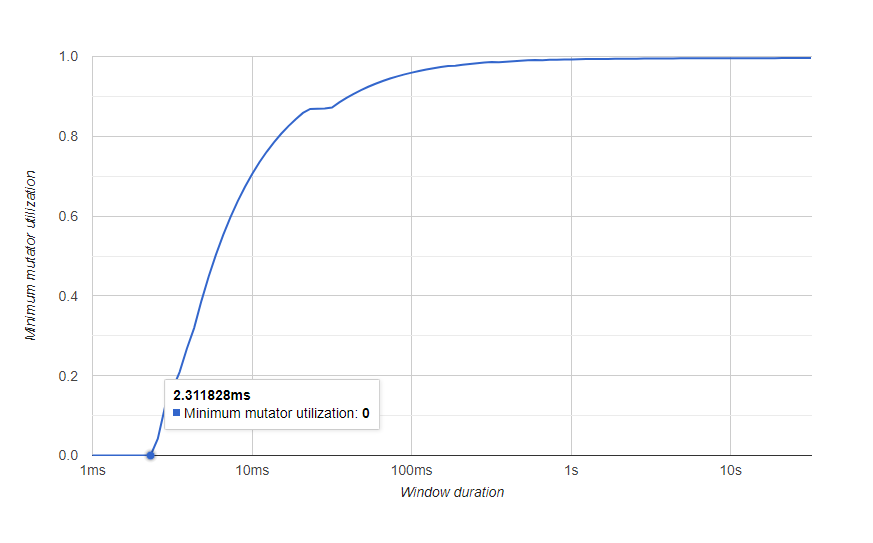
As you can see from the diagram, after 2ms, the available cpu rises gradually to nearly 100%. So gc is not under pressure.
Key Reminders
- You must use chrome, and a higher version will not work.I'm using 76.
- trace files are large, and may be hundreds of megabytes in a few minutes, so make sure the network is good, or use your local machine for verification.
- Fabrication is w zoom in, s zoom out, a move left, d move right
- Interpretation of the mmu diagram of gc (note, not yet available) https://www.cs.cmu.edu/~guyb/papers/gc2001.pdf