Recently, we are using Grafana to show the data of elastic search. Next, I will use elastic search as the data source in Grafana to draw the IO diagram of the network and the IO diagram of the disk
- System: centos7.x, ip: A
Installing grafana
$ yum install https://s3-us-west-2.amazonaws.com/grafana-releases/release/grafana-4.6.3-1.x86_64.rpm
Add grafana server to system boot entry and boot:
$ systemctl enable grafana-server.service
$ systemctl daemon-reload //#Reload systemd and scan for new or changed units
$ systemctl start grafana-server
$ systemctl status grafana-server
Then enter in the browser: http://A:3000, both user and password are admin
es correlation
- es related operations are all operated in kibnan
- New index and mapping in es:
PUT /test?pretty   //New index
POST test/test_type/_mapping   //Add mapping, where there must be a field of type date
{
    "test_type": {
            "properties": {
                "appId": {
                    "type": "keyword"
                },
                "createTime": {
                    "type": "date"
                },
                "detail": {
                    "type": "keyword"
                },
                "ip": {
                    "type": "keyword"
                },
                "level": {
                    "type": "keyword"
                },
                "module": {
                    "type": "keyword"
                },
                "tag": {
                    "type": "keyword"
                },
                "threadName": {
                    "type": "keyword"
                },
                "type": {
                    "type": "keyword"
                }
            }
        }
}
- Insert data into:
PUT test/test_type/1
{
    "createTime": "2019-05-09T11:58:41+0800",
    "ip": "2345332",
    "appId": "11000000",
    "threadName": "Thrad-acceptor-2",
    "level": "error",
    "type": "eror",
    "tag": "ta1",
    "module": "mdule1",
    "detail": "soe description"
}
The date type here, because the default date in es is utc time, because the difference between utc and Beijing time is 8 hours. If only time is inserted here, Then it will be displayed in 8 hours . Therefore, it is necessary to change utc time to Beijing time. The insertion above is after the change.
grafana interface configuration
-
First add data source, as shown in the figure
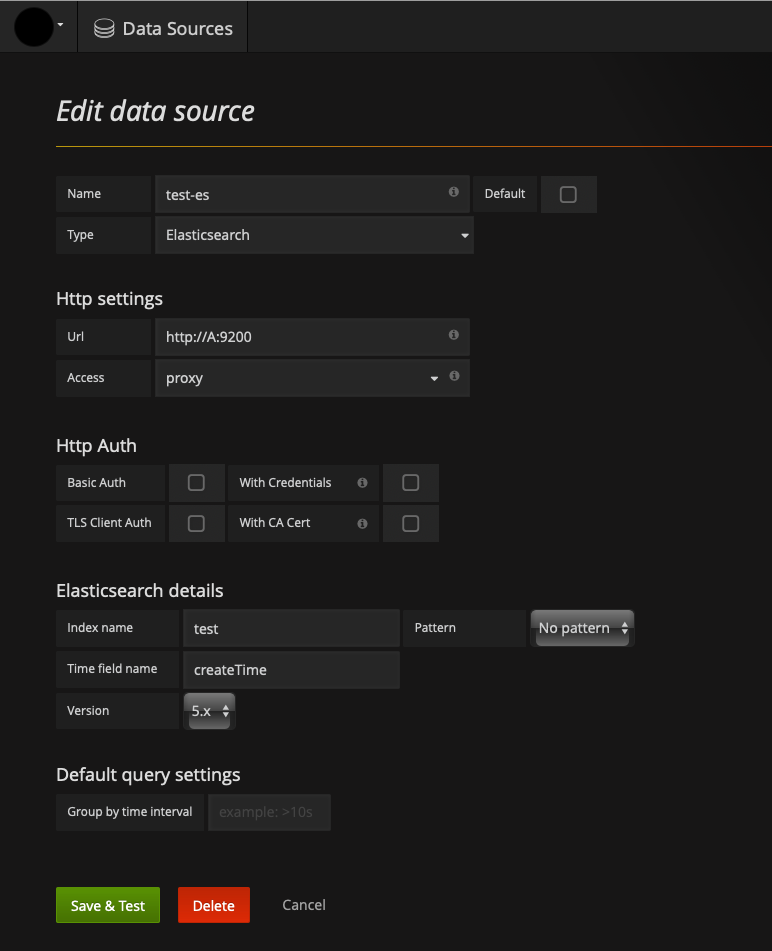
-
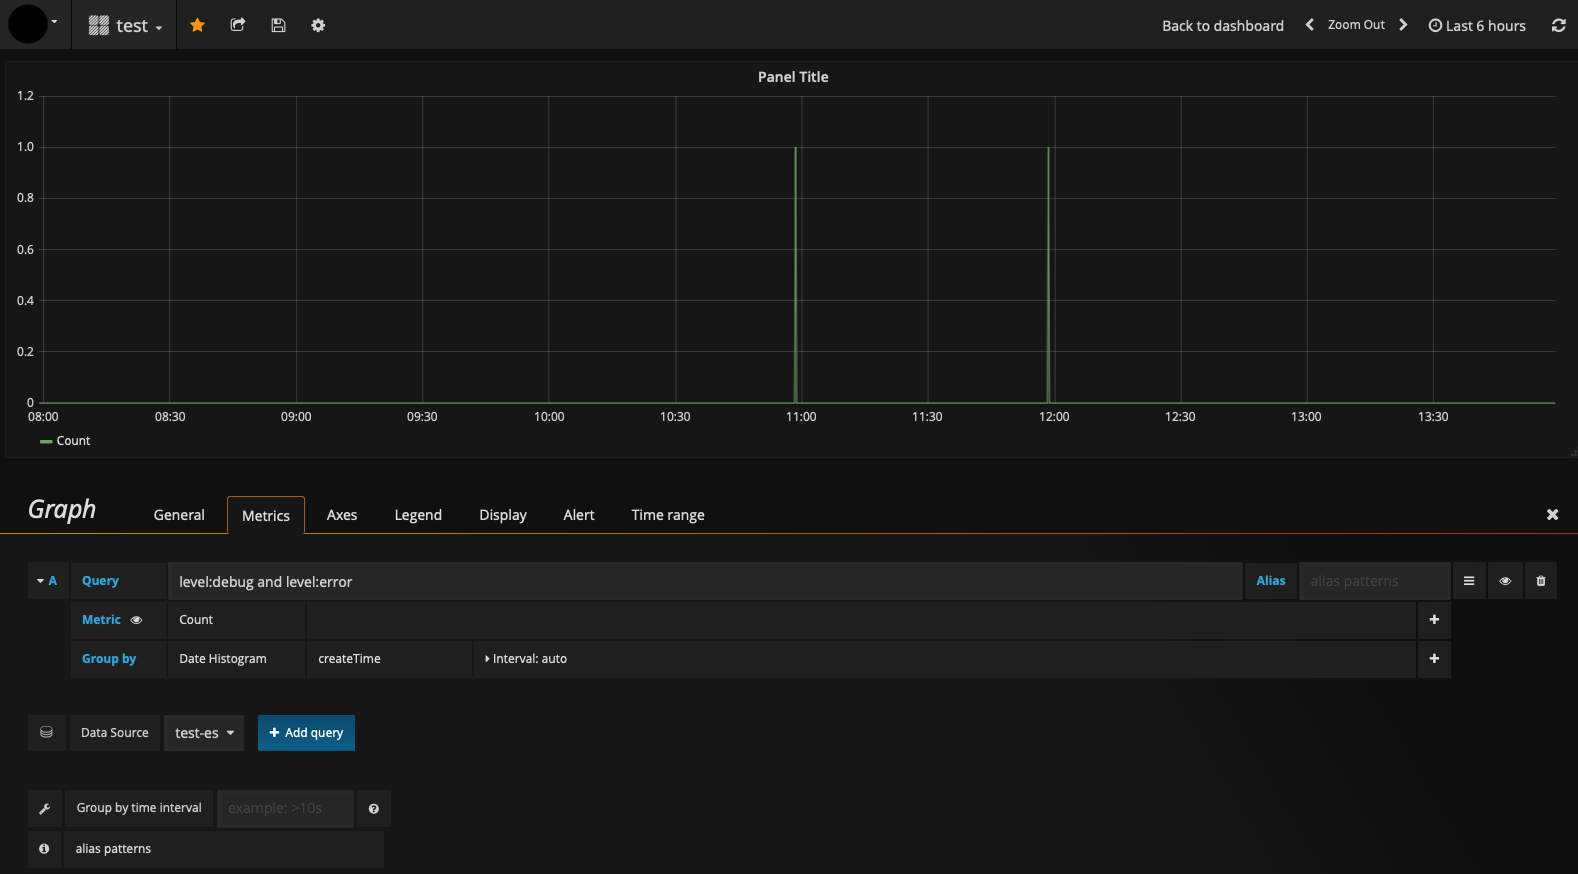
Then add dashboards, as shown in the figure below