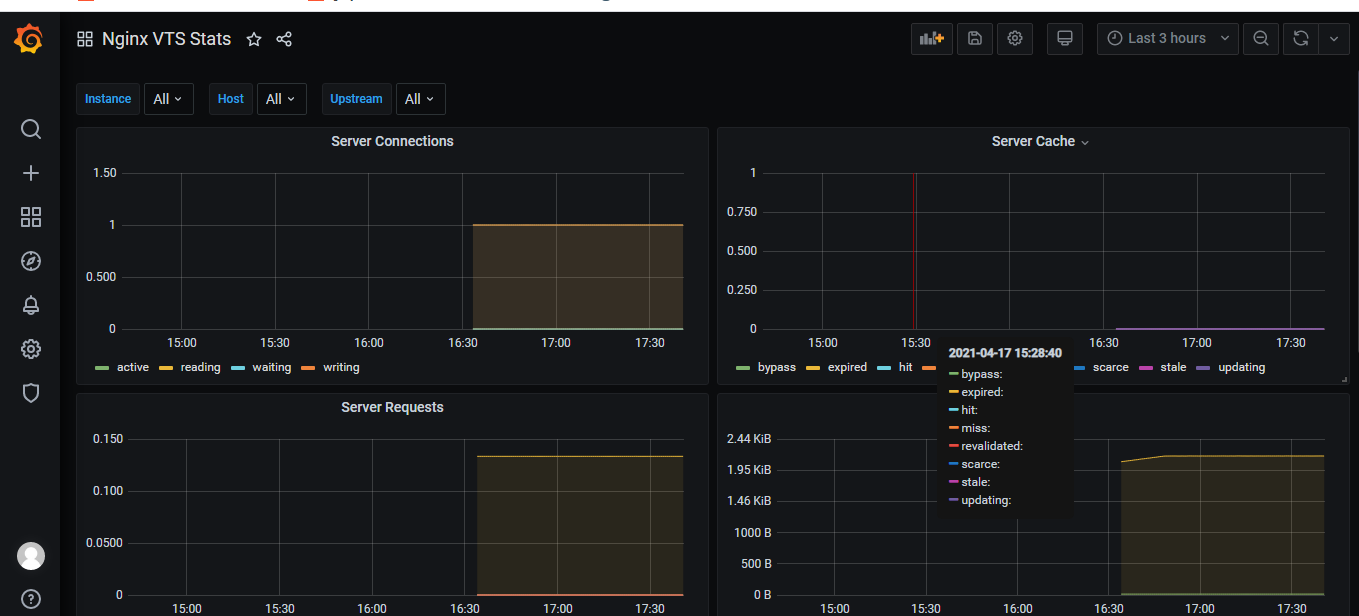
1, Install java project
Install jdk and tomcat. Please refer to the article
Configuring multiple tomcat on one linux server
2, Installing nginx
Please refer to the article
Linux Installation nginx steps
3, Install nginx VTS export
1. Install git
yum install git -y
2. Install nginx VTS export
git clone https://gitee.com/mirrors/nginx-module-vts.git
When compiling nginx, the – add module parameter is added. Where should the path be consistent
3. Enter nginx Directory:
cd nginx-1.19.9
Execute command:
./configure --prefix=/usr/local/nginx --with-http_stub_status_module --with-http_ssl_module --add-module=/opt/nginx-module-vts/
make
make install
4. Download version 0.10.3
Download address:
https://github.com/hnlq715/nginx-vts-exporter/releases
Or:
wget https://github.com/hnlq715/nginx-vts-exporter/releases/download/v0.10.3/nginx-vts-exporter-0.10.3.linux-amd64.tar.gz
tar -xzvf nginx-vts-exporter-0.10.3.linux-amd64.tar.gz
4, Configure nginx
Modify configuration
vim /usr/local/nginx/conf/nginx.conf
Add the following
vhost_traffic_status_zone; vhost_traffic_status_filter_by_host on;
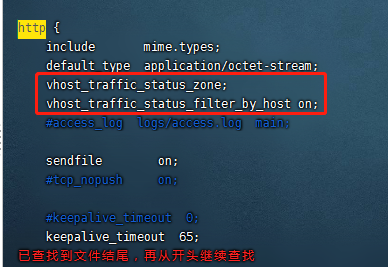
Add content:
location /status {
vhost_traffic_status_display; vhost_traffic_status_display_format html;
}
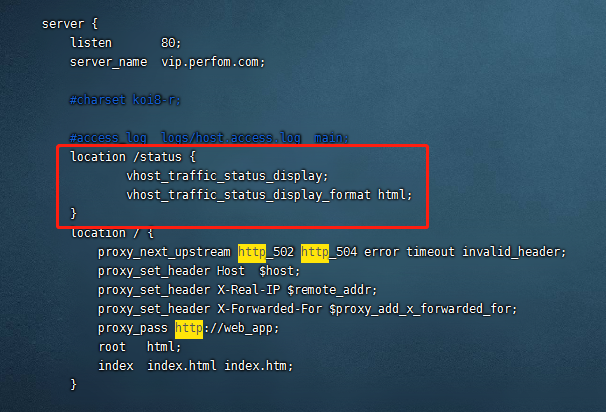
vhost_traffic_status_filter_by_host on; Enable this function and configure multiple servers in nginx_ Name yes, according to
Different servers_ Name performs traffic statistics. Otherwise, all traffic is calculated to the first server by default_ Name
Verify whether the modification of nginx configuration file is correct. If it occurs, request modification according to the error
/usr/local/nginx/sbin/nginx -t
Reload nginx configuration file
/usr/local/nginx/sbin/nginx -s reload
5, Start nginx VTS export
Enter the folder:
cd nginx-vts-exporter-0.10.3.linux-amd64/
Execute commands and run in the background
nohup ./nginx-vts-exporter -nginx.scrape_uri=http://localhost/status/format/json &
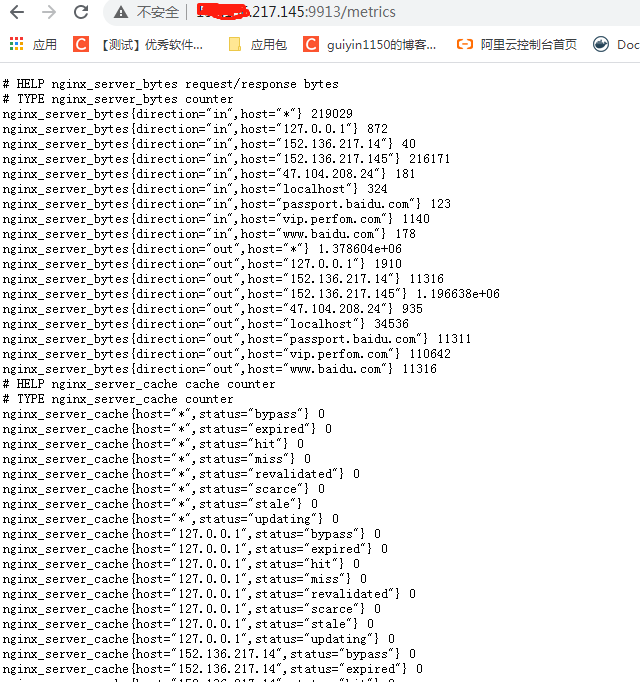
After starting the service, you can access it through the browser http://ip Address: 9913/metrics check whether nginx data is collected
Note: if the page cannot be accessed, the nginx VTS service department is normal. Please confirm the service and network; If you can access it, but the page only
There are a few lines of data, indicating that no monitoring data has been collected. Please repeat the above installation of nginx and the following configuration of nginx
Successful interface:
6, Install promethus
1. Download address: https://github.com/prometheus/prometheus/releases/
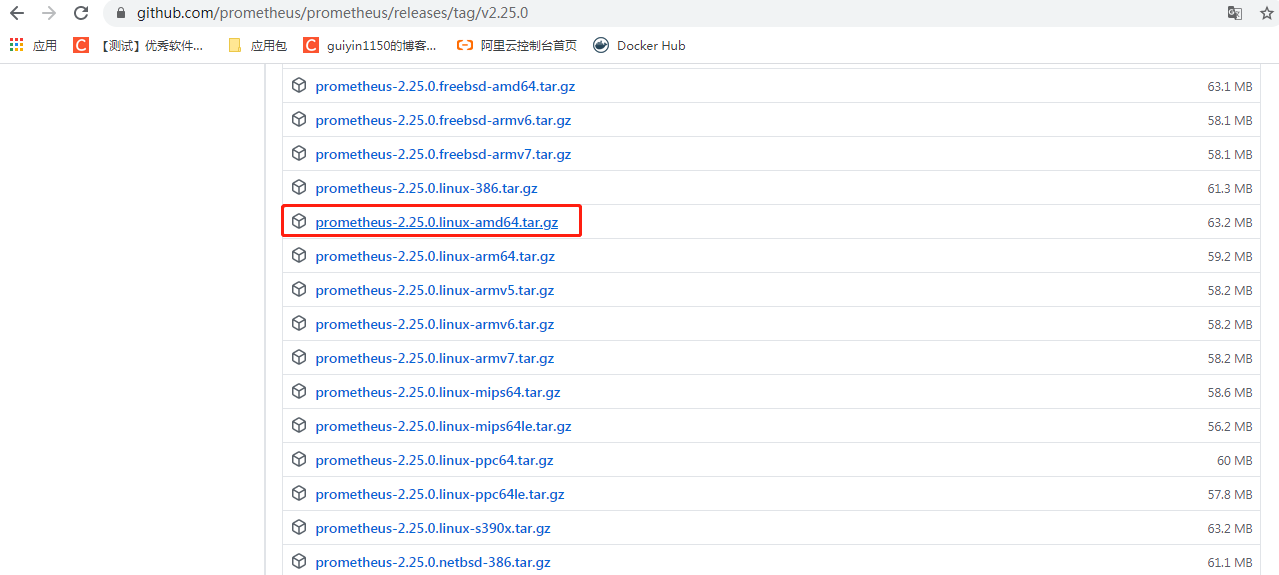
Decompression:
tar -xzvf prometheus-2.25.0.linux-amd64.tar.gz
#Enter the extracted folder
cd prometheus-2.25.0.linux-amd64/
Start service:
./prometheus
2. Modify Promethus Yaml file
Enter the folder extracted by promethus:
vim prometheus.yml
Add the following:
- job_name: 'nginx-vts'
  static_configs:
  - targets: ['Monitored machine ip:9913']
As follows:
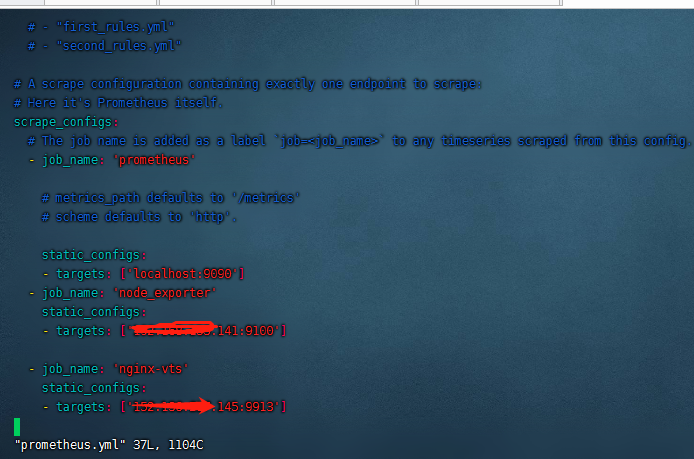
The configuration file of prometheus has been modified. You need to restart prometheus to take effect
First check whether the prometheus service is started. If it is started, please stop it first
In the extracted folder of prometheus, start the prometheus service
Execute commands started in the background:
nohup ./prometheus &
7, Installing grafana
Download address: https://grafana.com/grafana/download

Install grafana:
yum install grafana-7.4.2-1.x86_64.rpm
Installation is complete upon execution:

Start the command systemctl restart grafana server
systemctl restart grafana-server
After successful installation, start the grafana service, which can be accessed by browser http://ip:3000 All account passwords are admin login
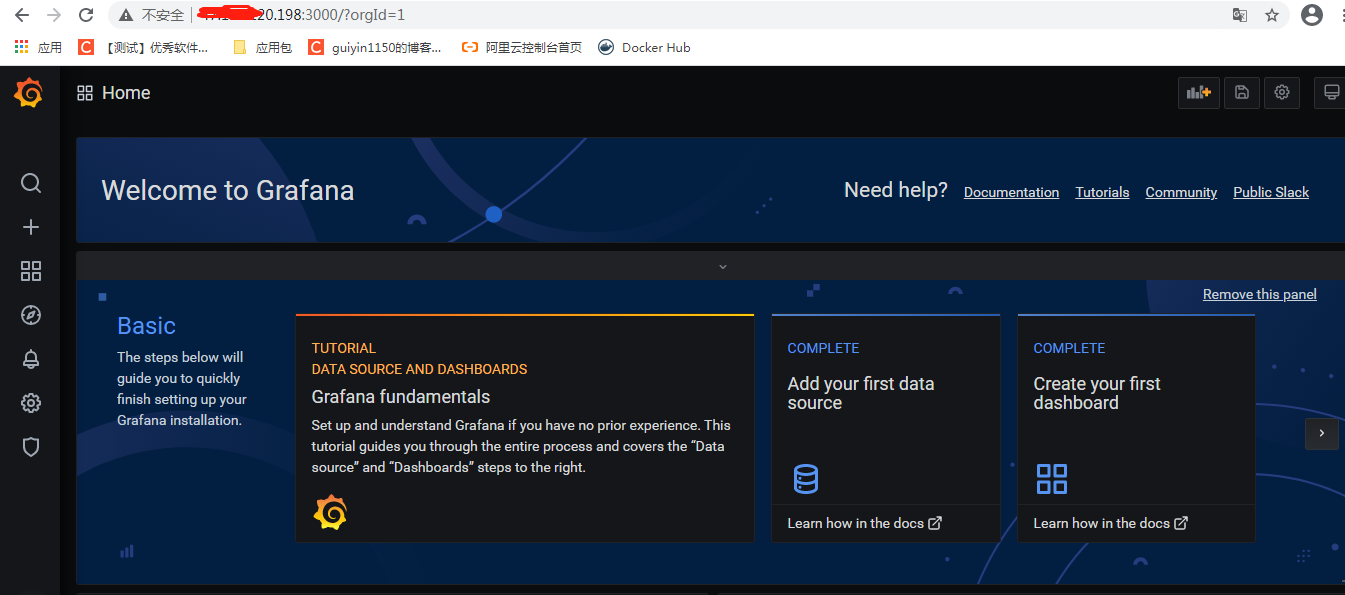
grafana add prometheus data source
Log in to grafana, enter add data source and select prometheus
You only need to fill in the URL address of the HTTP page: http://localhost:9090 localhost represents the machine ip of prometheus, but
Then click Save & test at the bottom of the page. If the prompt on the page is green, it indicates that the data source is added successfully.
Import template
Click import in the grafana menu, enter 2949 in the first text box on the page, and then click load panel to be imported.
In the jump page, you can adjust the time period in the upper right corner to see the data chart in the page.
