catalogue
1. Introduction to canvas label
4. Case: drawing a table in canvas
8. Case: draw a pie chart based on a set of data
1, Introduction to canvas
Canvas is a new label provided by HTML5 < canvas > < / Canvas >, which is similar to div. it is a rectangular canvas. It can support JavaScript to draw on it and control each pixel; Canvas has a variety of drawing paths, rectangles, circles, characters and methods of adding images, which can make the page more colorful. At present, canvas is widely used in games, ecarts, advertising and other fields.
2, Drawing basis
1. Introduction to canvas label
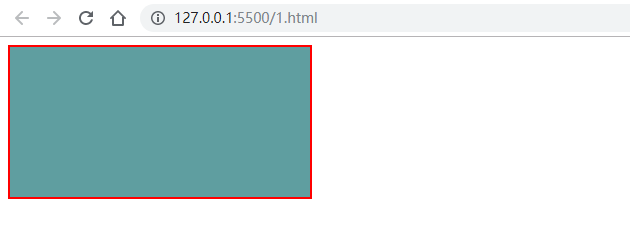
Canvas is actually an ordinary HTML tag that needs to be closed. You can set the width, height and background color attributes, but the width and height unit must be px, otherwise it will be ignored; A canvas defaults to 300 * 150 pixels.
It should be noted that the width and height of the canvas element must be set with its own attributes, rather than using the CSS selector to control the width and height of the canvas, otherwise the image will be stretched, and CSS can be used for other attributes except width and height. The following is a simple case:
<!DOCTYPE html>
<html>

<head>
  <meta charset="UTF-8">
  <title>canvas label</title>
  <style>
    #can1 {
      background-color: cadetblue;
      border: 2px solid red;
    }
  </style>
</head>

<body>
  <!-- Set width and height usage canvas Label properties -->
  <canvas id="can1" width="300px" height="150px"></canvas>
</body>

</html>
The effect is as follows:
2. canvas Context
Context is the context of canvas, that is, the drawing environment. It is the entry or collection of all drawing operation APIs; Canvas itself can't draw any content and needs to be operated by JavaScript. Context is the interface for JavaScript to operate canvas.
There are two steps to get the context: first get the canvas tag, and then get the context of the tag;
<script>
  // 1.DOM operation to obtain canvas tag
  var canvas = document.getElementById('can1');
  // 2. Get the context of canvas (2d rendering)
  var ctx = canvas.getContext('2d');
</script>
After obtaining the canvas context, you can draw graphics on the canvas; Context related attributes are as follows:
(ctx is the variable name of the obtained Context defined by the blogger, which can be changed at will. ctx is used for the following descriptions)
-
ctx.moveTo(x,y); Move the brush to the coordinate (x, y) position
-
ctx.lineTo(x,y); Draw a line from the current position to the coordinate (x, y) position
-
ctx.closePath(); Close path, close line
-
ctx.lineWidth; line width
-
ctx.strokeStyle; Stroke color must be used before stroke
-
ctx.stroke(); Render a straight line, equivalent to stroke
-
ctx.fillStyle; Fill color, which must be used before filling
-
ctx.fill(); Fill, black by default
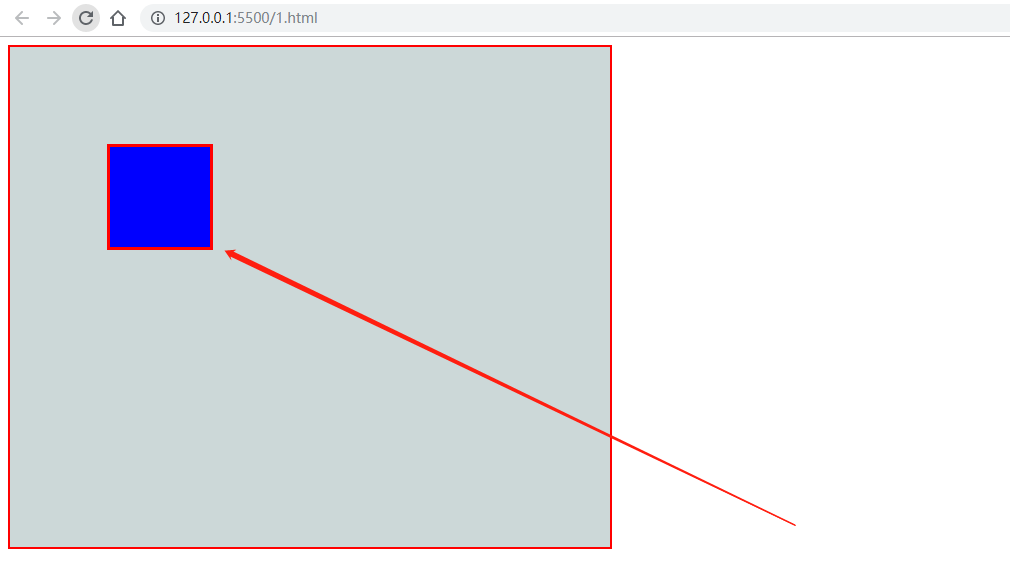
Next, we combine these attributes to draw a simple square:
<!DOCTYPE html>
<html>

<head>
  <meta charset="UTF-8">
  <title>canvas label</title>
  <style>
    #can1 {
      background-color: rgb(204, 216, 216);
      border: 2px solid red;
    }
  </style>
</head>

<body>
  <!-- Set width and height usage canvas Label properties -->
  <canvas id="can1" width="600px" height="500px"></canvas>
</body>

<script>
  // DOM operation to get canvas tag
  var canvas = document.getElementById('can1');
  // Get the context of canvas (2d rendering)
  var ctx = canvas.getContext('2d');
  // Draw a rectangle
  ctx.moveTo(100, 100); //Move the brush to coordinate 100
  ctx.lineTo(200, 100); //Draw a line from the brush position to coordinates 200 and 100
  ctx.lineTo(200, 200); //Draw a line from the current position to 200
  ctx.lineTo(100, 200); //. from current location
  ctx.closePath(); //Closed line

  ctx.lineWidth = 6; //line width

  ctx.strokeStyle = 'red'; //stroke color
  ctx.stroke(); //Render line (stroke)

  ctx.fillStyle = 'blue'; //fill color
  ctx.fill(); //fill
</script>

</html>
The effect is as follows:
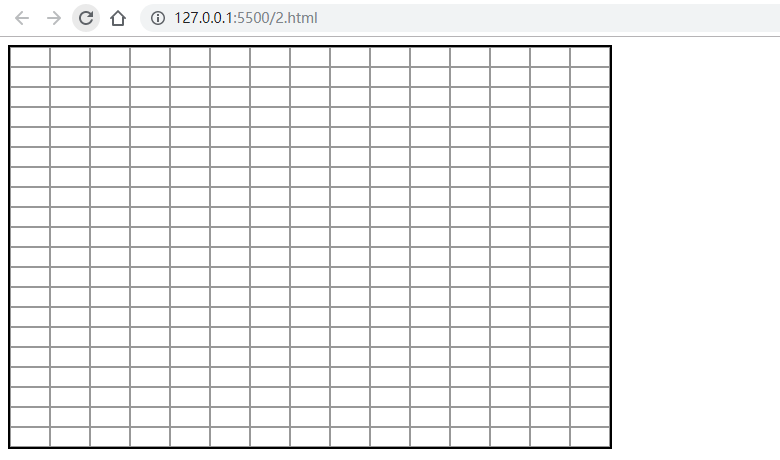
4. Case: drawing a table in canvas
<!DOCTYPE html>
<html>

<head>
  <meta charset="UTF-8">
  <title>Case: drawing tables</title>
  <style></style>
</head>

<body>
  <div>
    <canvas id="table"></canvas>
  </div>
</body>
<script>
  (function () {
    var canvas = document.getElementById('table'); //Get canvas tag
    var ctx = canvas.getContext('2d'); //Get context

    //Set the width, height and border of the canvas (the border can also be set using CSS selector)
    canvas.width = 600;
    canvas.height = 400;
    canvas.style.border = '2px solid #000';
    //Set context style
    ctx.lineWidth = .5;
    ctx.strokeStyle = '#999';

    //Draw table
    var rect_hei = 20; //Define the height of each row 20px
    var rect_wit = 40; //Define each column width 40px

    for (var i = 0; i < canvas.width / rect_hei; i++) { //Circular drawing
      //Draw horizontal lines
      ctx.moveTo(0, i * rect_hei); //Starting from the position where the x-axis is 0, horizontal lines are drawn every other row height
      ctx.lineTo(canvas.width, i * rect_hei);
      ctx.stroke();

      //Draw vertical line
      ctx.moveTo(i * rect_wit, 0); //Starting from the position where the y-axis is 0, vertical lines are drawn every other column width
      ctx.lineTo(i * rect_wit, canvas.height);
      ctx.stroke();
    }
  }())
</script>

</html>
The effect is as follows:
5. beginPath status of canvas
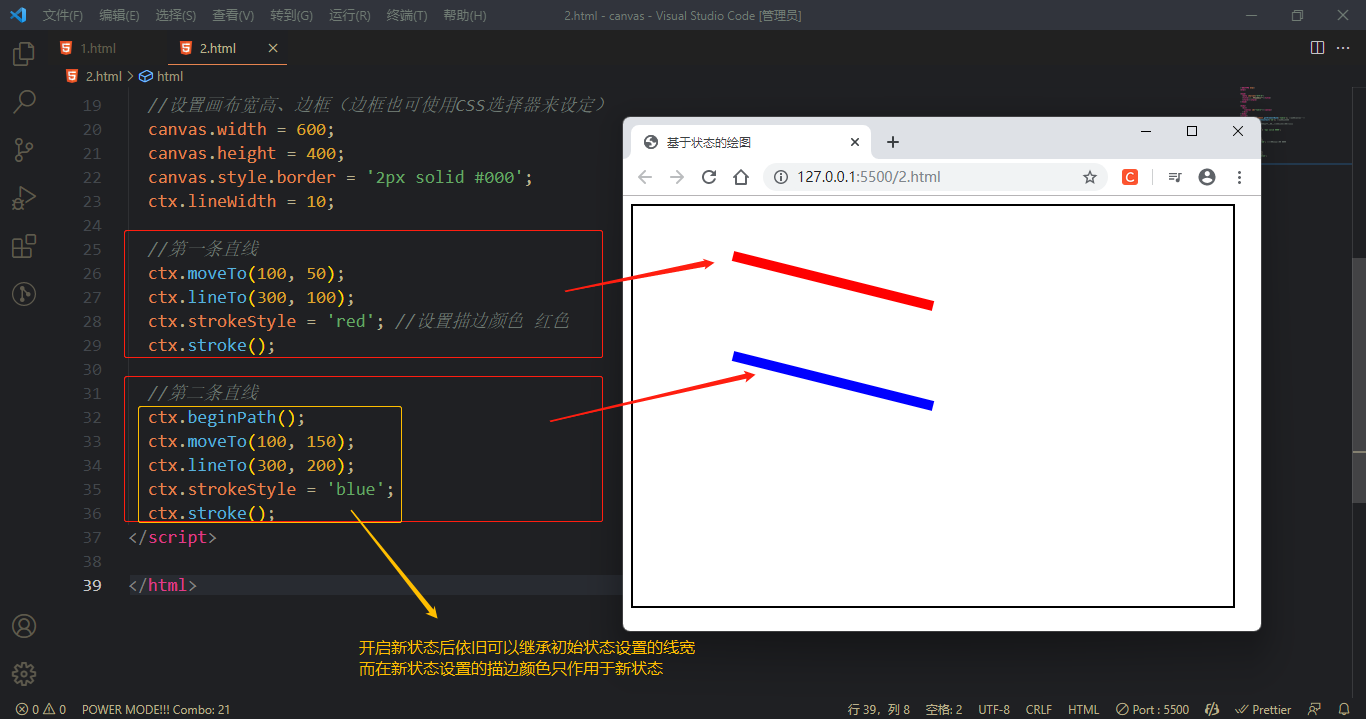
You need to know that drawing graphics in canvas is based on state, which means that if the stroke color attribute strokeStyle has been set to a certain color, then all lines will be this color in subsequent drawing; If the stroke color is set again, all lines will become the latest color, and the previous settings will be overwritten, so different colors cannot be achieved. As follows:
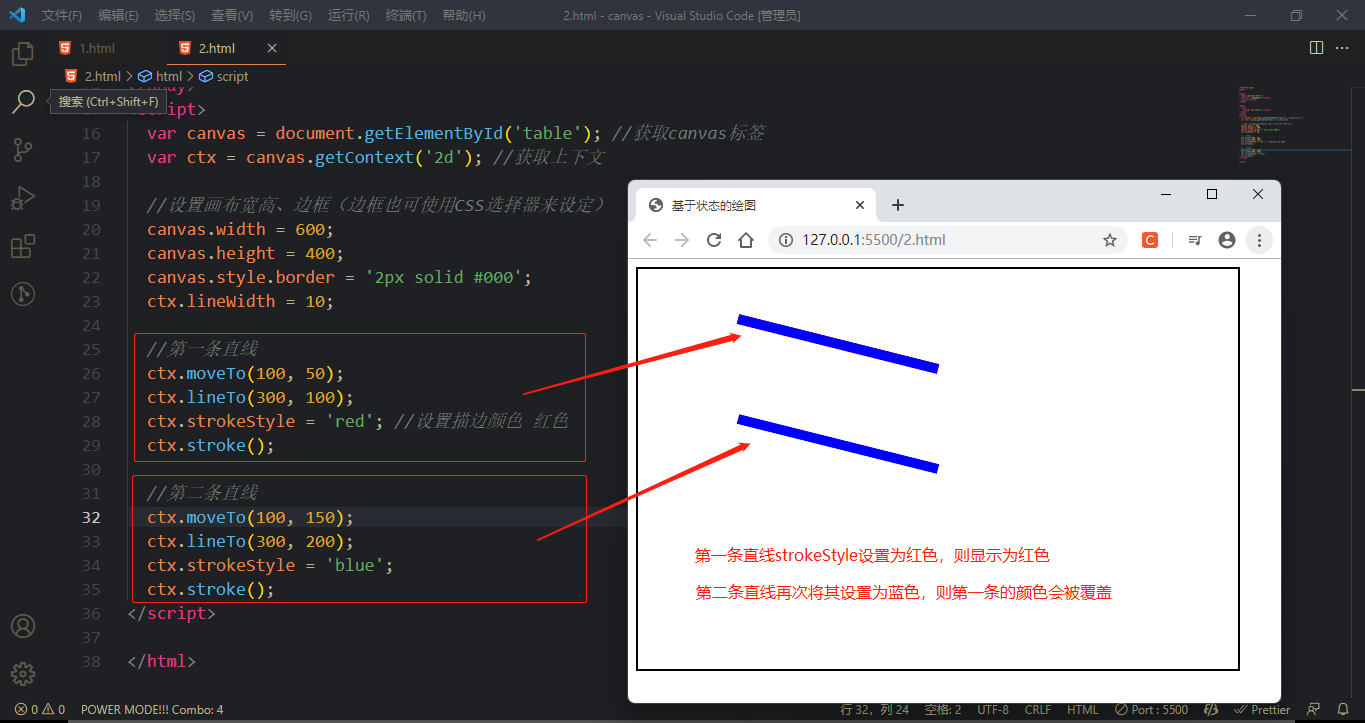
At this time, in order to draw lines of different colors, you need to use beginPath to open a new state;
- ctx.beginPath(); Open the drawing in the new state, and the previous settings will not be overwritten; The new state can inherit the style of the previous state, but the style set in the new state can only be used in the new state.
The following cases:
6. Draw rectangle rect
If you just draw a rectangle step by step according to the steps: starting point -- > drawing line -- > drawing edge, it will be too troublesome. canvas also provides a quick method rect for drawing a rectangle, and provides various attributes. The syntax is as follows:
- ctx.rect(x, y, width, height); x. Y is the coordinate of the upper left corner of the rectangle, and the width and height are in pixels px. This syntax only specifies the path of the rectangle without filling and stroking.
- ctx.strokeRect(x, y, width, height); Stroke rectangle, a combination of drawing and stroke.
- ctx.fillRect(x, y, width, height); Fill rectangle, combining drawing and filling
- ctx.clearRect(x, y, width, height); Clear the rectangle, which is equivalent to an eraser. All images within the rectangle will be erased.
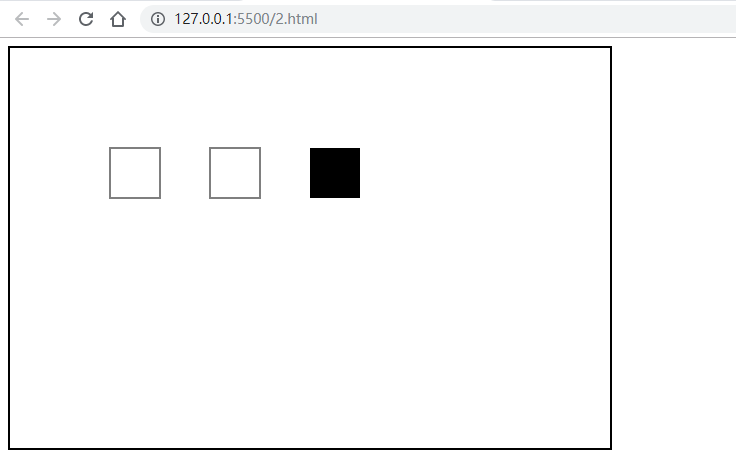
We use rect syntax to draw a rectangle, and only need one sentence of code:
<!DOCTYPE html>
<html>

<head>
  <meta charset="UTF-8">
  <title>draw rectangle</title>
  <style></style>
</head>

<body>
  <div>
    <canvas id="table"></canvas>
  </div>
</body>
<script>
  var canvas = document.getElementById('table'); //Get canvas tag
  var ctx = canvas.getContext('2d'); //Get context

  //Set the width, height and border of the canvas (the border can also be set using CSS selector)
  canvas.width = 600;
  canvas.height = 400;
  canvas.style.border = '2px solid #000';

  //Quick draw rectangle
  ctx.rect(100, 100, 50, 50);
  ctx.stroke();

  //Stroke rectangle
  ctx.strokeRect(200, 100, 50, 50);

  //Fill rectangle
  ctx.fillRect(300, 100, 50, 50);
</script>

</html>
The effect is as follows:
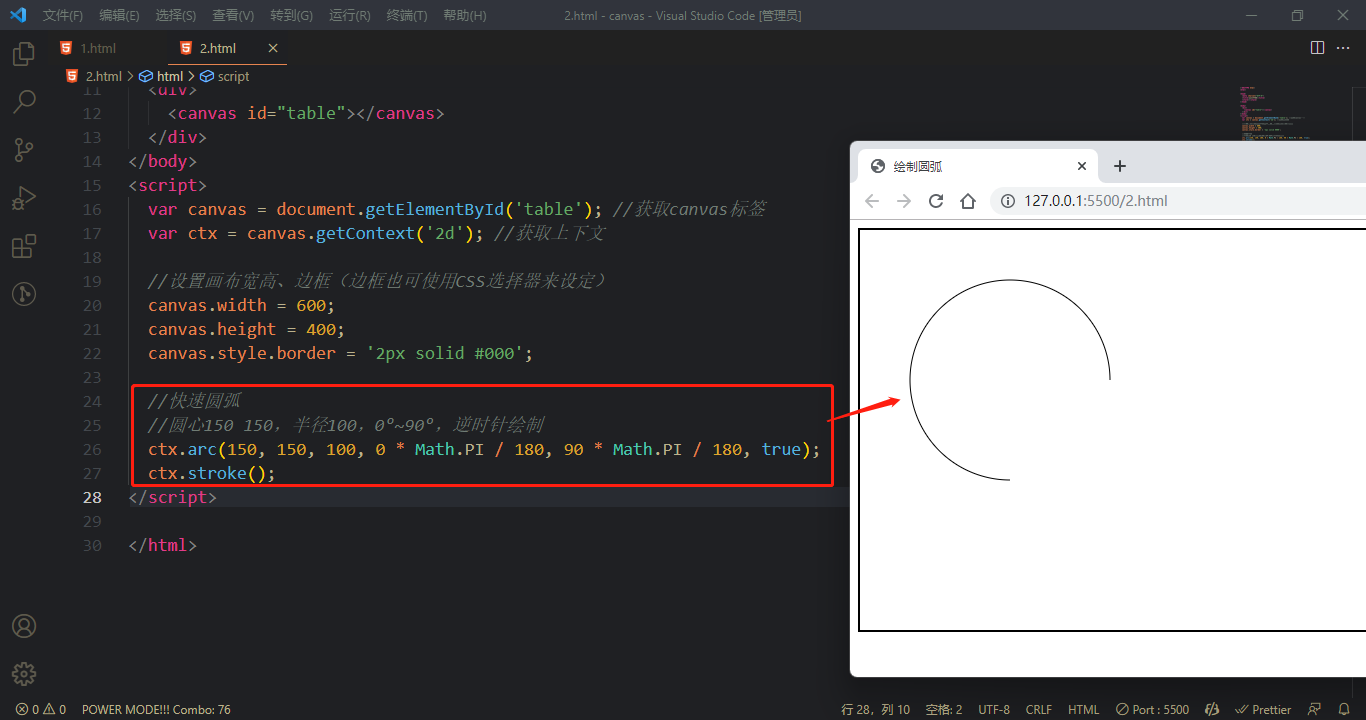
7. Draw circular arc
- ctx.arc(x,y,r,sAngle,eAngle,counterclockwise); x. Y is the coordinate of the center point of the circle; R radius; The starting angle of sangle is 0 degrees from the center of the circle to the rightmost point, and increases clockwise; Eagle end angle, pay attention to the radian Π (180°); Counter clockwise: whether it is counterclockwise, true is counterclockwise, false is clockwise.
Next, we use arc to draw an arc. The effect is as follows:
(tip: conversion formula between radian and angle, angle = Degree * math.pi/180)
8. Case: draw a pie chart based on a set of data
<!DOCTYPE html>
<html>

<head>
  <meta charset="UTF-8">
  <title>Draw pie chart</title>
  <style></style>
</head>

<body>
  <div>
    <canvas id="table"></canvas>
  </div>
</body>
<script>
  var canvas = document.getElementById('table'); //Get canvas tag
  var ctx = canvas.getContext('2d'); //Get context

  //Set the width, height and border of the canvas (the border can also be set using CSS selector)
  canvas.width = 600;
  canvas.height = 400;
  canvas.style.border = '2px solid #000';

  //Define pie chart data
  var data = [{
      'value': 0.2,
      'color': '#149985',
      'title': 'city A'
    },
    {
      'value': 0.3,
      'color': 'red',
      'title': 'city B'
    },
    {
      'value': 0.4,
      'color': 'blue',
      'title': 'city C'
    },
    {
      'value': 0.1,
      'color': '#999999',
      'title': 'city D'
    },
  ]

  //Draw pie chart
  var tempAngle = -90; //Draw from - 90 °
  for (var i = 0; i < data.length; i++) {
    ctx.beginPath(); //Each cycle draws a different sector, so a new state must be turned on
    ctx.moveTo(200, 200); //Each time, go back to the center point and start drawing
    var angle = data[i].value * 360; //Angle of each sector
    ctx.fillStyle = data[i].color; //The color fill is traversed according to the data
    var startAngle = tempAngle * Math.PI / 180; //Starting angle
    var endAngle = (tempAngle + angle) * Math.PI / 180; //End angle of each time = start angle + sector angle
    ctx.arc(200, 200, 100, startAngle, endAngle);
    tempAngle = tempAngle + angle; //After each drawing, the starting angle of the sector is the original angle plus the angle of the sector
    ctx.fill();
  }
</script>

</html>
The case effect is as follows:
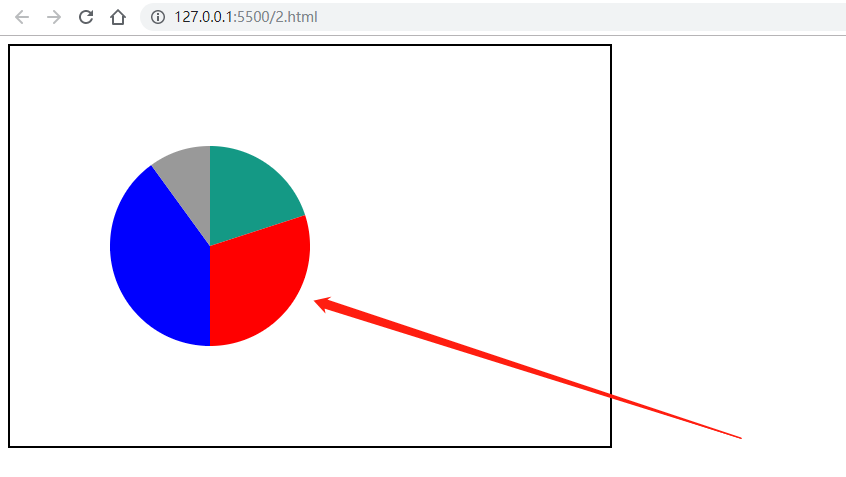
See the lower part of the pie chart
Summary: basic steps of canvas drawing
- Get context: canvas getContext('2d');
- Start new state drawing: CTX beginPath()
- Brush start point: CTX moveTo(x, y)
- Sketch lines: CTX lineTo(x, y)
- Closed path: CTX closePath();
- Stroke: CTX stroke();