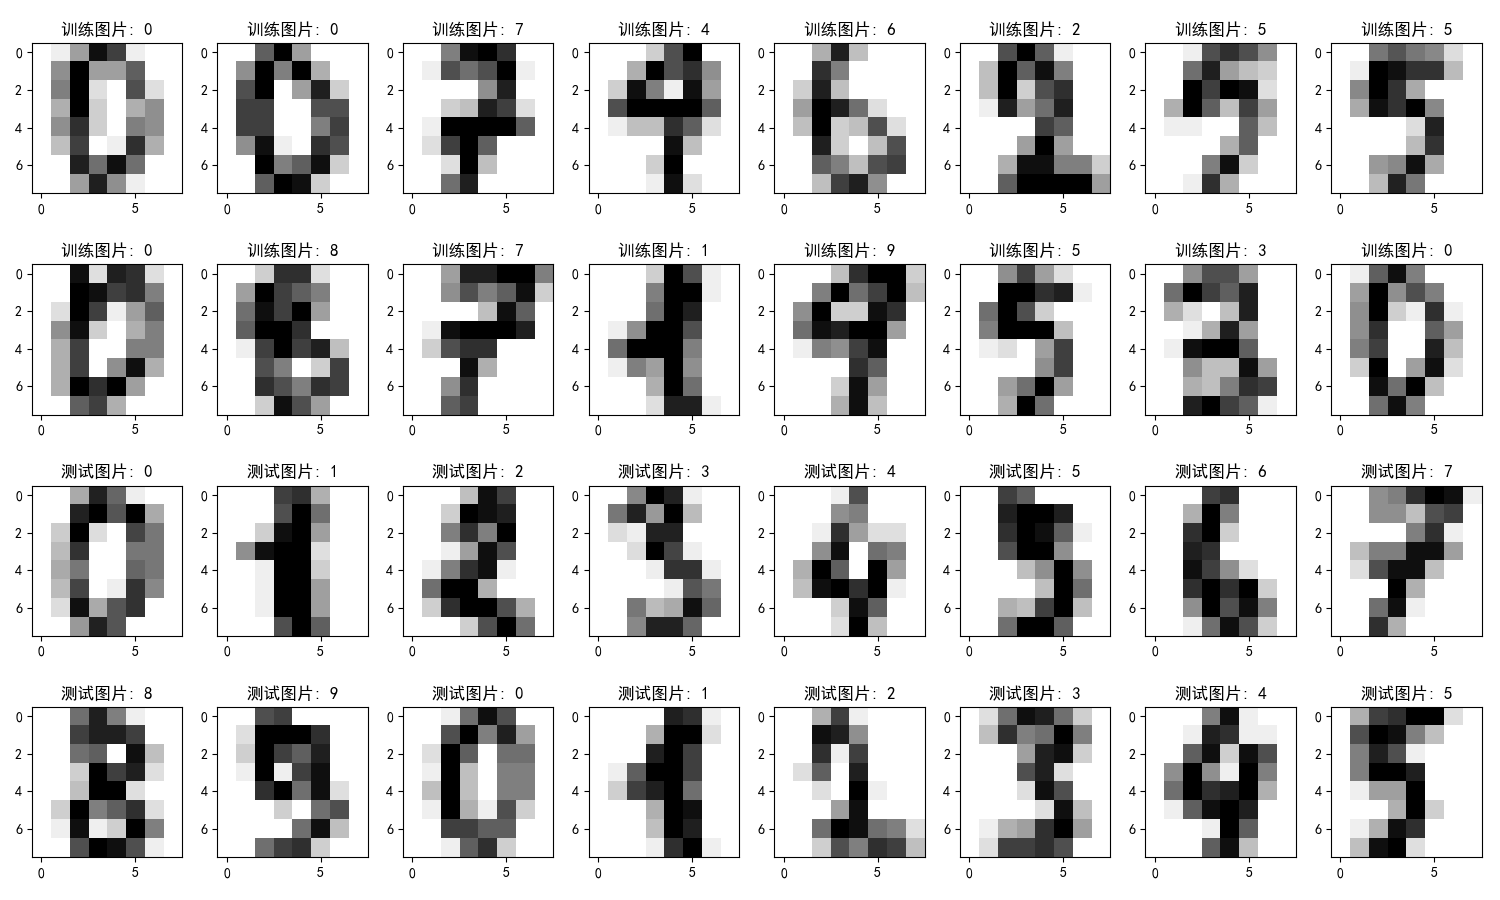
Here are some images of the training and test sets
SVM model code (parameters are adjusted):
#!/usr/bin/python
# -*- coding:utf-8 -*-
import numpy as np
import pandas as pd
from sklearn import svm
import matplotlib.colors
import matplotlib.pyplot as plt
from PIL import Image
from sklearn.metrics import accuracy_score
import os
from sklearn.model_selection import GridSearchCV
from time import time
def show_accuracy(a, b, tip):
acc = a.ravel() == b.ravel()
print(tip + 'Accuracy:%.2f%%' % (100 * np.mean(acc)))
def save_image(im, i):
im *= (256 / 17)
im = 255 - im
a = im.astype(np.uint8)
output_path = './HandWritten'
if not os.path.exists(output_path):
os.mkdir(output_path)
Image.fromarray(a).resize(size=(100, 100)).save(output_path + ('\\%d.png' % i))
if __name__ == "__main__":
print('Load Training File Start...')
data = pd.read_csv('optdigits.tra', header=None)
x, y = data[list(range(64))], data[64]
x, y = x.values, y.values # Convert to numpy form and return the numpy representation of DataFrame.
images = x.reshape(-1, 8, 8) # I don't know how many lines. Anyway, each line is an 8 * 8 matrix, corresponding to the picture
print('images.shape = ', images.shape)
y = y.ravel().astype(np.int)
print('Load Test Data Start...')
data = np.loadtxt('optdigits.tes', dtype=np.float, delimiter=',')
x_test, y_test = np.split(data, (-1,), axis=1) # axis=1 split data by row direction, i.e. horizontal direction
print(y_test.shape)
images_test = x_test.reshape(-1, 8, 8)
y_test = y_test.ravel().astype(np.int)
print('Load Data OK...')
# x, x_test, y, y_test = train_test_split(x, y, test_size=0.4, random_state=1)
# images = x.reshape(-1, 8, 8)
# images_test = x_test.reshape(-1, 8, 8)
matplotlib.rcParams['font.sans-serif'] = ['SimHei']
matplotlib.rcParams['axes.unicode_minus'] = False
plt.figure(figsize=(15, 9), facecolor='w')
for index, image in enumerate(images[:16]):
plt.subplot(4, 8, index + 1)
plt.imshow(image, cmap=plt.cm.gray_r, interpolation='nearest')
plt.title('Training pictures: %i' % y[index])
for index, image in enumerate(images_test[:16]):
plt.subplot(4, 8, index + 17)
plt.imshow(image, cmap=plt.cm.gray_r, interpolation='nearest')
save_image(image.copy(), index)
plt.title('Test picture: %i' % y_test[index])
plt.tight_layout()
plt.show()
params = {'C':np.logspace(0, 3, 7), 'gamma':np.logspace(-5, 0, 11)}
model = GridSearchCV(svm.SVC(kernel='rbf'), param_grid=params, cv=3)
#model = svm.SVC(C=1, kernel='rbf', gamma=0.001)
print('Start Learning...')
t0 = time()
model.fit(x, y)
t1 = time()
t = t1 - t0
print('train+CV Time consuming:%d Minute%.3f second' % (int(t / 60), t - 60 * int(t / 60)))
print ('Optimal parameters:\t', model.best_params_)
# clf.fit(x, y)
print('Learning is OK...')
print('Training set accuracy:', accuracy_score(y, model.predict(x)))
y_hat = model.predict(x_test)
print('Test set accuracy:', accuracy_score(y_test, model.predict(x_test)))
print(y_hat)
print(y_test)
err_images = images_test[y_test != y_hat]
err_y_hat = y_hat[y_test != y_hat]
err_y = y_test[y_test != y_hat]
print(err_y_hat)
print(err_y)
plt.figure(figsize=(10, 8), facecolor='w')
for index, image in enumerate(err_images):
if index >= 12:
break
plt.subplot(3, 4, index + 1)
plt.imshow(image, cmap=plt.cm.gray_r, interpolation='nearest')
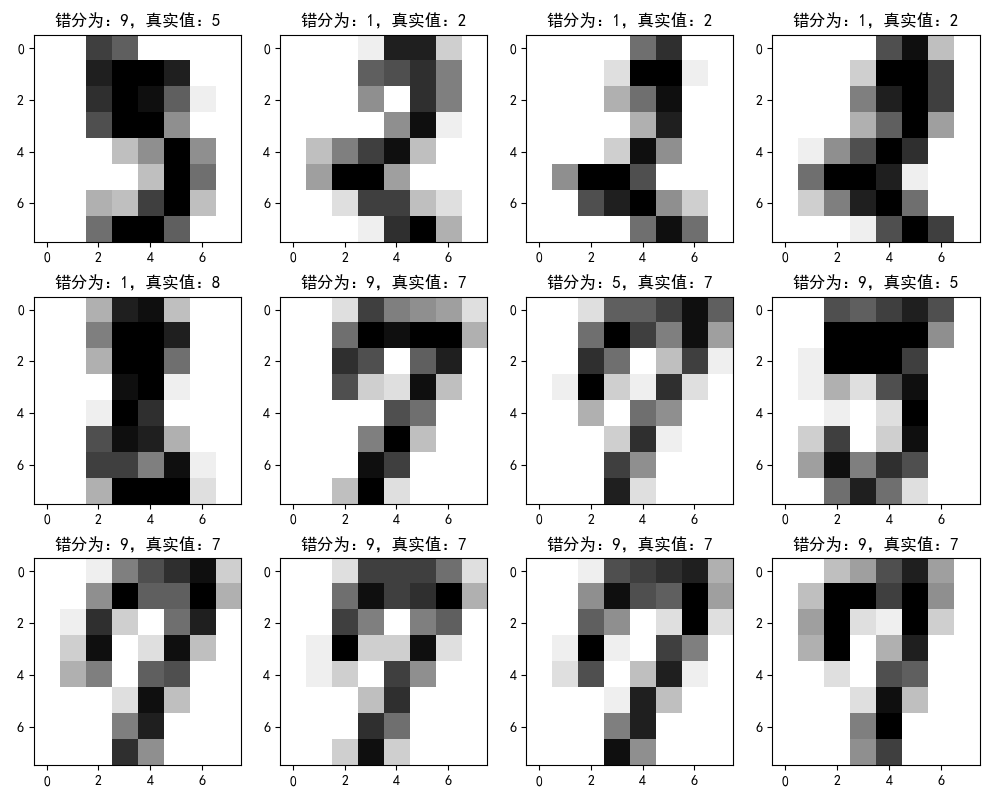
plt.title('Mistakes are divided into:%i,True value:%i' % (err_y_hat[index], err_y[index]))
plt.tight_layout()
plt.show()
Result:
Training time: 4 minutes 40.544 seconds
Optimal parameters: {'C': 10.0, 'gamma': 0.001}
Training set accuracy: 1.0
Test set accuracy: 0.9827490261547023
Here's an example of a recognition error (no one can see the number...) :
XGBOOST model (with parameters adjusted):
import pandas as pd
import xgboost as xgb
import numpy as np
from time import time
from sklearn.model_selection import GridSearchCV
from sklearn.metrics import accuracy_score
def show_accuracy(a, b, tip):
    acc = a.ravel() == b.ravel()
    print(tip + 'Accuracy:%.2f%%' % (100 * np.mean(acc)))

if __name__ == '__main__':
    print('Load Training File Start...')
    data = pd.read_csv('optdigits.tra', header=None)
    x, y = data[list(range(64))], data[64]
    x, y = x.values, y.values  # Convert to numpy form and return the numpy representation of DataFrame.
    images = x.reshape(-1, 8, 8)  # Get the matrix corresponding to the picture
    print('images.shape = ', images.shape)
    y = y.ravel().astype(np.int)  # Pull a row vector from a column vector

    print('Load Test Data Start...')
    data = np.loadtxt('optdigits.tes', dtype=np.float, delimiter=',')
    x_test, y_test = np.split(data, (-1,), axis=1)  # axis=1 split data by row direction, i.e. horizontal direction
    print(y_test.shape)
    images_test = x_test.reshape(-1, 8, 8)
    y_test = y_test.ravel().astype(np.int)
    print('Load Data OK...')

    t0 = time()
    #xgb model parameters
    params = {'objective': 'multi:softmax',  # Defining multiple classification problems
              'num_class': 10,  # Class number
              'eta': 0.1,  # Learning rate
              'silent': 1  # Print intermediate results or not, 1 is not to print
              }
    # train = xgb.DMatrix(x, label=y)
    # test = xgb.DMatrix(x_test, label=y_test)
    num_round = 5
    #bst = xgb.train(params, train, num_round)
    cv_params = {'eta': [0.1, 0.01],'n_estimators': np.linspace(100, 600, 20, dtype=int)}
    gbm = xgb.XGBClassifier(**params)
    #Training model
    opt_clf = GridSearchCV(estimator=gbm, param_grid=cv_params, cv=3)
    opt_clf.fit(x, y)
    #pred = opt_clf.predict(x_test)
    t1 = time()
    t = t1 - t0
    print('Training model time consumption:%d Minute%.3f second' % (int(t / 60), t - 60 * int(t / 60)))
    print('Optimal parameters:\t', opt_clf.best_params_)
    #accuracy = accuracy_score(y_test, pred)
    print('Training set accuracy: ', accuracy_score(y, opt_clf.predict(x)))
    print('Test set accuracy: ',accuracy_score(y_test, opt_clf.predict(x_test)))

    # #
    # t0 = time()
    # #The value of n ﹣ estimators has called out the optimal value 1390
    # cv_params = {'n_estimators': np.linspace(100, 1000, 10, dtype=int)}
    # regress_model = xgb.XGBRegressor(max_depth=5, learning_rate=0.1, n_estimators=187, silent=False, objective='multi:softmax')
    # model = GridSearchCV(regress_model, param_grid=cv_params, verbose=2, refit=True, cv=5, n_jobs=-1)
    # model.fit(x,y)
    #
    # t1 = time()
    # t = t1 - t0
    # print('training model time:% d minutes%. 3f seconds'% (int(t / 60), t - 60 * int(t / 60)))
    # print('best parameter: \ t ', model. Best params')
    # # Forecast test set
    # y_hat = model.predict(x)
    # Show ABCD availability (y, y ABCD training sets)
    #
    # y_hat_test = model.predict(x_test)
    # Show UU availability (y UU test, y UU hat UU test, "test set")
    # #print('accuracy score of training set: ', accuracy score (y, model. Predict (x)))
    # #print('accuracy score of test set: ', accuracy score (y'test, model. Predict (x'test)))
Result:
Training model time: 29 minutes 59.371 seconds
Optimal parameters: {'eta': 0.1, 'n'estimators': 284}
Training set accuracy: 1.0
Test set accuracy: 0.9671675013912076
Conclusion:
From the final running results, we can see that SVM is better than xgboost, and the running time of SVM is faster than xgboost.
The main reason why xgboost takes a lot of time is the parameter adjustment. If the parameter is not adjusted, the model can be trained quickly. However, because GridSearchCV() is used to adjust the parameter of n ˊ estimators, the running time is greatly increased, so the value of parameter cv is better to be reduced, not to mention that the running time is too slow. In this experiment, cv is set to 3, which takes half an hour to run Come on, the final result is not as good as SVM.