hellochart's Detailed Explanation (2) Pie Charts
The use of HelloChart graphics frameworks and various rendering effects were introduced before.
http://blog.csdn.net/wenzhi20102321/article/details/73133718
No detailed description of various graphic designs has been given before.
This paper focuses on the design of hellochart pie chart.
Effect:
A little carton! Please see the picture below.
Overview map:
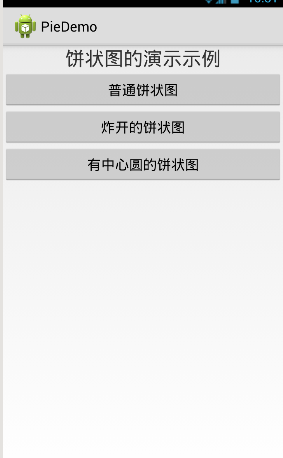
A total of three basic graphics are displayed, in fact, by setting attributes can become a variety of graphics styles!
The first simple pie chart sets very few attributes:
Simple pie chart
Set a few random numbers in, and then display the scale of the pie chart according to the size of the values. 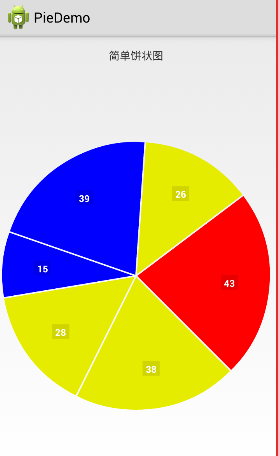
Fried pie chart
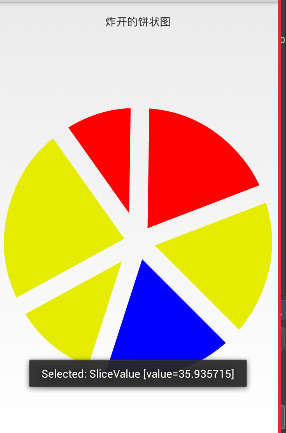
The code, like a simple pie chart, modifies an attribute and turns lines into blown-up graphics.
A pie chart with a central circle
The data transmitted here is a group of student scores:
int[] num = {88, 44, 66, 98, 45, 65, 65, 45, 32, 99, 89, 100, 2, 33, 44, 12, 33, 65, 45, 32, 99, 88,0};
Sector-shaped display of area-wide text:
String [] range String = {below 60,""60-80,""80-90,""above 90"}; // Label display for each range
Effect: 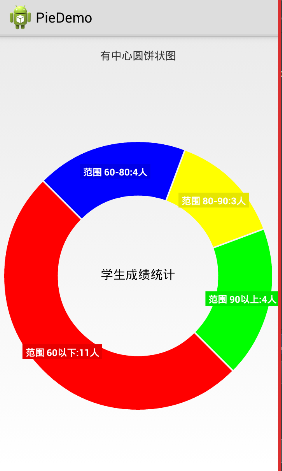
Instructions on the use of pie charts
(1) Depend on hellochart or import jar packages
Dependency and jar packages can be found on the official website, and there are jar packages in my project (later).
(2) Layout documents
//This is my own jar package. The package name is different from the official website, but the class name is exactly the same.
  <com.lwz.chart.hellocharts.view.PieChartView
            android:layout_height="match_parent"
            android:layout_width="match_parent"
            android:id="@+id/pieChart"
            />
(3) Code
// Learn to use simple pie chart code
 package com.lwz.pie;

import android.app.Activity;
import android.graphics.Typeface;
import android.os.Bundle;
import android.widget.TextView;
import android.widget.Toast;
import com.lwz.chart.hellocharts.listener.PieChartOnValueSelectListener;
import com.lwz.chart.hellocharts.model.PieChartData;
import com.lwz.chart.hellocharts.model.SliceValue;
import com.lwz.chart.hellocharts.util.ChartUtils;
import com.lwz.chart.hellocharts.view.PieChartView;

import java.util.ArrayList;
import java.util.List;

/**
 * Display of ordinary pie chart
 */
public class SimplePieActivity extends Activity {

    private PieChartView pieChart;     //Pie chart View
    private PieChartData data;         //Storage of data

    private boolean hasLabels = true;                   //Is there a slogan?
    private boolean hasLabelsOutside = false;           //Is there a slogan outside the fan?
    private boolean hasCenterCircle = false;            //Is there a central circle?
    private boolean hasCenterText1 = false;             //Is there a central text?
    private boolean hasCenterText2 = false;             //Is there a central text 2
    private boolean isExploded = false;                  //Is it a blown-up image?
    private boolean hasLabelForSelected = false;         //Selected sector display slogan

    @Override
    public void onCreate(Bundle savedInstanceState) {
        super.onCreate(savedInstanceState);
        setContentView(R.layout.simple_pie_activity);
        String title = getIntent().getStringExtra("title");
        TextView tv_title = (TextView) findViewById(R.id.tv_title);
        tv_title.setText("" + title);
        initView();
        initEvent();
        initData();
    }

    private void initView() {
        pieChart = (PieChartView) findViewById(R.id.pieChart);

    }

    private void initEvent() {
        pieChart.setOnValueTouchListener(new ValueTouchListener());

    }

    private void initData() {
        generateData();

    }


    /**
     * Configuration data
     */
    private void generateData() {
        int numValues = 6;   //Number of sectors

        //Collection of sectoral data
        List<SliceValue> values = new ArrayList<SliceValue>();
        for (int i = 0; i < numValues; ++i) {
            SliceValue sliceValue = new SliceValue((float) Math.random() * 30 + 15, ChartUtils.pickColor());
            values.add(sliceValue);
        }

        data = new PieChartData(values);
        data.setHasLabels(hasLabels);
        data.setHasLabelsOnlyForSelected(hasLabelForSelected);
        data.setHasLabelsOutside(hasLabelsOutside);
        data.setHasCenterCircle(hasCenterCircle);

        if (isExploded) {
            data.setSlicesSpacing(24);
        }

        if (hasCenterText1) {
            data.setCenterText1("Hello!");

            // Get roboto-italic font. //Typeface is used to set fonts!
            Typeface tf = Typeface.createFromAsset(getAssets(), "Roboto-Italic.ttf");
            data.setCenterText1Typeface(tf);

            // Get font size from dimens.xml and convert it to sp(library uses sp values).
            data.setCenterText1FontSize(ChartUtils.px2sp(getResources().getDisplayMetrics().scaledDensity,
                    (int) getResources().getDimension(R.dimen.pie_chart_text1_size)));
        }

        if (hasCenterText2) {
            data.setCenterText2("Charts (Roboto Italic)");

            Typeface tf = Typeface.createFromAsset(getAssets(), "Roboto-Italic.ttf");

            data.setCenterText2Typeface(tf);
            data.setCenterText2FontSize(ChartUtils.px2sp(getResources().getDisplayMetrics().scaledDensity,
                    (int) getResources().getDimension(R.dimen.pie_chart_text2_size)));
        }

        pieChart.setPieChartData(data);
    }


    /**
     * Click Monitor
     */
    private class ValueTouchListener implements PieChartOnValueSelectListener {

        @Override
        public void onValueSelected(int arcIndex, SliceValue value) {
            Toast.makeText(SimplePieActivity.this, "Selected: " + value, Toast.LENGTH_SHORT).show();
        }

        @Override
        public void onValueDeselected() {

        }

    }

}
Look at the meaning of some attributes above, the annotations above are almost known.
But some people are not clear about the distribution of radians and the text display on the radians.
    //Key Codes for Setting Arc Number and Arc Display Text
     List<SliceValue> values = new ArrayList<SliceValue>();
        for (int i = 0; i < numValues; ++i) {
            //Judging how many degrees each data range occupies 360 degrees
            SliceValue sliceValue = new SliceValue(value, colors[i]);//In SliceValue construction method, two parameters are passed on. The first is the number of angles and the second is the color of arc display.
            sliceValue.setLabel("****"); //Set up the text for sector display
            values.add(sliceValue);
        }
The pie chart is the simplest and easiest to use in hellochart.
You can also run it first, see the effect of my code, and then replace the data.
Project source address: https://github.com/liwenzhi/HelloChartPieDemo