start
Pie chart, a very common chart, can be easily rendered by using any chart library. However, our company's interactive ideas are strange and the layout is unpredictable. The pie chart itself is not changeable, but the supporting legends are changeable and can not be restored by turning over the ecarts configuration documents. There are two ways to choose. One is to tell the interaction that it can not be realized, Persuade the interaction to follow the layout of the chart library, but the general interaction may torture your soul. Why can others do it, but you can't? So I choose the second one and make one myself.
It is very simple to implement a pie chart with canvas, so this paper will review some knowledge points of canvas and take a look at the results of this time when introducing the implementation of using vue to simulate an ecarts pie chart:
Layout and initialization
The layout is very simple, just a div container and a canvas element.
<template>
  <div class="chartContainer" ref="container">
    <canvas ref="canvas"></canvas>
  </div>
</template>
The width and height of the container should be set through its own attributes width and height. It is best not to use css to set the width and height of the canvas, because the default width and height of the canvas is 300 * 150. Using css will not change the original width and height of the canvas, but will stretch it to the css width and height you set, so deformation will occur.
// Set to container width and height
let { width, height } = this.$refs.container.getBoundingClientRect()
let canvas = this.$refs.canvas
canvas.width = width
canvas.height = height
The drawing APIs are hung in the drawing context of canvas, so get the following first:
this.ctx = canvas.getContext("2d")The default origin of the canvas coordinate system is in the upper left corner, and the pie chart is generally drawn in the middle of the canvas, so the center of the circle should be converted and set to the center point of the canvas every time an arc is drawn. In this example, it is not troublesome to convert only one center point, but it is troublesome to convert all in more complex scenes, so in order to avoid, You can use the translate method to set the coordinate system origin of the canvas to the center point of the canvas:
this.centerX = width / 2
this.centerY = height / 2
this.ctx.translate(this.centerX, this.centerY)
Next, we need to calculate the radius of the pie chart. It is too full to look good, so it is tentatively 90% of the short side of the canvas area:
this.radius = Math.min(width, height) / 2 * 0.9
Finally, take a look at the structure of the data to be rendered:
this.data = [
{
name: 'name',
num: 10,
color: ''// colour
},
// ...
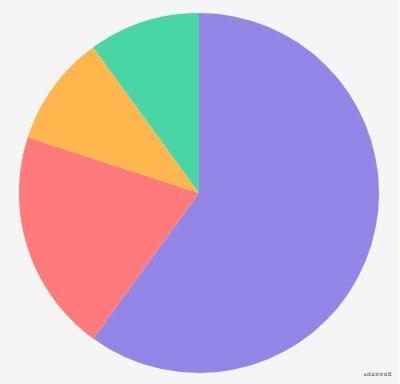
]Pie chart
Pie chart is actually a circle composed of a pile of sectors with different areas. Arc method is used to draw circles and sectors. It has six parameters, namely, circle center x, circle center y, radius r, arc start radian, arc end radian, counterclockwise or clockwise.
The area of the sector represents the proportion of data, which can be expressed by the proportion of angle, so it needs to be converted into radian. The formula of angle to radian is radian = angle * (Math.PI/180).
// Traverse the data for conversion. total is the sum of all data
let curTotalAngle = 0
let r = Math.PI / 180
this.data.forEach((item, index) => {
    let curAngle = (item.num / total) * 360
    let cruEndAngle = curTotalAngle + curAngle
    this.$set(this.data[index], 'angle', [curTotalAngle, cruEndAngle])// angle
    this.$set(this.data[index], 'radian', [curTotalAngle * r, cruEndAngle * r])// radian
    curTotalAngle += curAngle
});
After converting to radians, traverse the angleData for fan drawing:
// Function renderPie
this.data.forEach((item, index) => {
this.ctx.beginPath()
this.ctx.moveTo(0, 0)
this.ctx.fillStyle = item.color
let startRadian = item.radian[0] - Math.PI/2
let endRadian = item.radian[1] - Math.PI/2
this.ctx.arc(0, 0, this.radius, startRadian, endRadian)
this.ctx.fill()
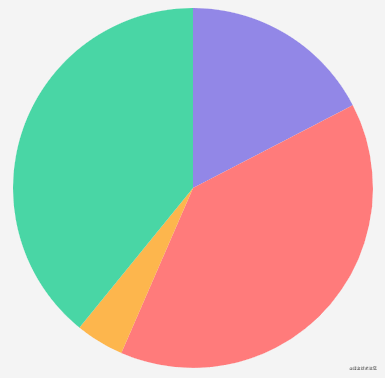
});The effects are as follows:
The beginPath method is used to start a new path. It will clear all the sub paths of the current path. Otherwise, calling the fill method to close the path will connect all the sub paths from beginning to end. That's not what we want.
In addition, the moveTo method is used to move the starting point of the new path to the coordinate origin. Why do you want this? You can't see the effect first:
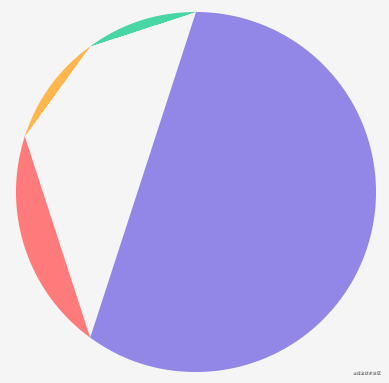
The reason is that the arc method only draws an arc, so connecting its end to end is the above effect, but the sector needs to be closed together with the center of the circle. When calling the arc method, if there is already a sub path on the current path, a segment will be used to connect the end of the current sub path with the starting point of the arc, so we first move the starting point of the path to the center of the circle, In this way, what is finally closed is a sector.
As for why the start radian and end radian are reduced, math Pi / 2, because 0 radian is in the positive direction of the x axis, that is, the right, but generally we think the starting point is at the top, so subtract 1 / 4 circle to move its starting point to the top.
animation
When we use the ecarts pie chart, we will find that it will have a short animation when rendering:
The basic principle of using canvas to realize animation is to constantly change the drawing data and then refresh the canvas. It sounds like nonsense, so one implementation method is to dynamically modify the radian of the arc at the end of the current drawing, from 0 to 2 * math PI, so that we can achieve this slowly increasing effect, but here we use another method, using the clip method.
clip is used to create a clipping path in the current path. After clipping, subsequent drawing information will only appear in the clipping path. Based on this, we can create a change from 0 radians to 2 * math PI radian sector clipping area can achieve this animation effect.
Let's take a look at how to clear the canvas:
this.ctx.clearRect(-this.centerX, -this.centerY, this.width, this.height)
The clearRect method is used to clear all the drawn content within the wide width height h eight range starting from (x,y). The clearing principle is to set the pixels in this range to be transparent. Because the origin is moved to the center of the canvas, the upper left corner of the canvas is (- this.centerX, -this.centerY).
The open source community has many animation libraries to choose from, but because we only need a simple animation function, it is not necessary to introduce a library, so we can simply write one ourselves.
// Animation curve function. For more functions, please refer to: http://robertpenner.com/easing/
// t: current time, b: begInnIng value, c: change In value, d: duration
const ease = {
    // bounce
    easeOutBounce(t, b, c, d) {
        if ((t /= d) < (1 / 2.75)) {
            return c * (7.5625 * t * t) + b;
        } else if (t < (2 / 2.75)) {
            return c * (7.5625 * (t -= (1.5 / 2.75)) * t + .75) + b;
        } else if (t < (2.5 / 2.75)) {
            return c * (7.5625 * (t -= (2.25 / 2.75)) * t + .9375) + b;
        } else {
            return c * (7.5625 * (t -= (2.625 / 2.75)) * t + .984375) + b;
        }
    },
    // Slow in slow out
    easeInOut(t, b, c, d) {
        if ((t /= d / 2) < 1) return c / 2 * t * t * t + b
        return c / 2 * ((t -= 2) * t * t + 2) + b
    }
}
/*
    Animation function
    from: Starting value
    to: target value
    dur: Transition time, ms
    callback: Real time callback function
    done: Callback function at the end of animation
    easing: Animation curve function
*/
function move(from, to, dur = 500, callback = () => {}, done = () => {}, easing = 'easeInOut') {
    let difference = to - from
    let startTime = Date.now()
    let isStop = false
    let timer = null
    let run = () => {
        if (isStop) {
            return false
        }
        let curTime = Date.now()
        let durationTime = curTime - startTime
        // Call the jog function to calculate the current scale
        let ratio = ease[easing](durationTime, 0, 1, dur)
        ratio = ratio > 1 ? 1 : ratio
        let step = difference * ratio + from
        callback && callback(step)
        if (ratio < 1) {
            timer = window.requestAnimationFrame(run)
        } else {
            done && done()
        }
    }
    run()
    return () => {
        isStop = true
        cancelAnimationFrame(timer)
    }
}
With the animation function, it is easy to realize the change of the sector:
// Reason from - 0.5 to 1.5 and subtract math. When drawing the sector above Same as pi / 2
move(-0.5, 1.5, 1000, (cur) => {
    this.ctx.save()
    // Draw fan cut path
    this.ctx.beginPath()
    this.ctx.moveTo(0, 0)
    this.ctx.arc(
        0,
        0,
        this.radius,
        -0.5 * Math.PI,
        cur * Math.PI// The end arc becomes larger and larger
    )
    this.ctx.closePath()
    // Draw after cutting
    this.ctx.clip()
    this.renderPie()
    this.ctx.restore()
});
The effects are as follows:
The save and restore methods are used here. The save method is used to save the current drawing state. If you modify the state later and call the restore method, you can restore to the previously saved state. These two methods are saved through the stack, so multiple can be saved, as long as the restore method is correctly corresponding in canvas, Drawing status includes: current transformation matrix, current cutting area, current dotted line list, and drawing style attributes.
These two methods are used here because if there is already a clipping region, the clipping region will be set to the intersection of the current clipping region and the current path when calling the clip method. Therefore, the clipping region may become smaller and smaller. To be safe, it will be placed between the save and restore methods when using the clip method.
Highlight over mouse
Another effect of ecarts pie chart is that the sector where the mouse moves up will be highlighted. In fact, it is also a small animation. The highlight principle is that the radius of this sector becomes larger. According to the previous routine, just give the change value of the radius to the animation function to run.
However, before that, you need to know which sector the mouse is moved to, and bind the mouse movement event to the element first:
<template>
  <div class="chartContainer" ref="container">
    <canvas ref="chart" @mousemove="onCanvasMousemove"></canvas>
  </div>
</template>
Obtain whether a coordinate point is within a path. isPointInPath can be used to detect whether a point is within the current path. Note that it is the current path. Therefore, we can add this detection to the previous loop method of traversing and drawing sectors:
renderPie (checkHover, x, y) {
    let hoverIndex = null// ++
    this.data.forEach((item, index) => {
        this.ctx.beginPath()
        this.ctx.moveTo(0, 0)
        this.ctx.fillStyle = item.color
        let startRadian = item.radian[0] - Math.PI/2
        let endRadian = item.radian[1] - Math.PI/2
        this.ctx.arc(0, 0, this.radius, startRadian, endRadian)
        // this.ctx.fill();--
        // ++
        if (checkHover) {
            if (hoverIndex === null && this.ctx.isPointInPath(x, y)) {
                hoverIndex = index
            }
        } else {
            this.ctx.fill()
        }
    })
    // ++
    if (checkHover) {
        return hoverIndex
    }
}
So what we need to do in the onCanvasMousemove method is to calculate the above (x,y) and then call this method:
onCanvasMousemove(e) {
    let rect = this.$refs.canvas.getBoundingClientRect()
    let x = e.clientX - rect.left
    let y = e.clientY - rect.top
    // Detect the current sector
    this.curHoverIndex = this.getHoverAngleIndex(x, y)
}
After the index of the sector is obtained, the radius of the sector can be moved. If the radius becomes larger, it can be multiplied by a multiple, such as 0.1 times. Then we can transition the multiple from 0 to 0.1 through the animation function, modify the half diameter value in the above traversal drawing sector method, and constantly refresh and redraw.
However, before that, add a field to the data structure defined above:
this.data = [
    {
        name: 'name',
        num: 10,
        color: '',
        hoverDrawRatio: 0// This field represents the multiple of the current fan drawing
    },
    // ...
]
The reason for adding a multiple field to each sector is that the multiple of not only one sector is changing at the same time. For example, when I quickly move from one sector to another, the radius of this sector is increasing and the radius of the previous sector is still recovering, so it will change at the same time.
onCanvasMousemove(e) {
       // ...
    // Detect the current sector
    this.curHoverIndex = this.getHoverAngleIndex(x, y)
    // Let's move
    if (this.curHoverIndex !== null) {
        move(
            this.data[hoverIndex].hoverDrawRatio,// The default is 0
            0.1,
            300,
            (cur) => {
                // Modify the multiple of the sector in real time
                this.data[hoverIndex].hoverDrawRatio = cur
                // Redraw
                this.renderPie()
            },
            null,
            "easeOutBounce"// Refer to ECharts and select bounce animation here
        )
    }
}
// Gets the sector index to which the mouse is moved
getHoverAngleIndex(x, y) {
    this.ctx.save()
    let index = this.renderPie(true, x, y)
    this.ctx.restore()
    return index
}
Next, modify the drawing function:
renderPie (checkHover, x, y) {
    let hoverIndex = null
    this.data.forEach((item, index) => {
        this.ctx.beginPath()
        this.ctx.moveTo(0, 0)
        this.ctx.fillStyle = item.color
        let startRadian = item.radian[0] - Math.PI/2
        let endRadian = item.radian[1] - Math.PI/2
        // this.ctx.arc(0, 0, this.radius, startRadian, endRadian)--
        // The radius is changed from dead to plus the magnification of the current sector
        let _radius = this.radius + this.radius * item.hoverDrawRatio
        this.ctx.arc(0, 0, _radius, startRadian, endRadian)
        if (checkHover) {
            if (hoverIndex === null && this.ctx.isPointInPath(x, y)) {
                hoverIndex = index
            }
        } else {
            this.ctx.fill()
        }
    });
    if (checkHover) {
        return hoverIndex
    }
}
However, the above code will not achieve the expected effect, and there is a problem to be solved. Moving onCanvasMousemove in the same sector will continue to trigger and detect the current index and call the move method. It may be that an animation has not ended, and moving in the same sector only needs to be animated once, so you need to make a judgment:
onCanvasMousemove(e) {
       // ...
    this.curHoverIndex = this.getHoverAngleIndex(x, y)
    if (this.curHoverIndex !== null) {
        // Add a field to record the last sector index
        if (this.lastHoverIndex !== this.curHoverIndex) {// ++
            this.lastHoverIndex = this.curHoverIndex// ++
            move(
                this.data[hoverIndex].hoverDrawRatio,
                0.1,
                300,
                (cur) => {
                    this.data[hoverIndex].hoverDrawRatio = cur
                    this.renderPie()
                },
                null,
                "easeOutBounce"
            )
        }
    } else {// ++
        this.lastHoverIndex = null
    }
}
Finally, add the animation method of changing from large to back. Traverse the data to determine which sector's current magnification is not 0, and then add an animation to it. The call position of this method is in the onCanvasMousemove function, because when you move from one sector to another, or from the inside to the outside of the circle, you need to judge whether to restore:
resume() {
this.data.forEach((item, index) => {
if (
index !== this.curHoverIndex &&// The sector where the current mouse is located does not need to be restored
item.hoverDrawRatio !== 0 &&// The current sector magnification is not 0, which means it needs to be restored
this.data[index].stop === null// Because this method will be called continuously during the movement of the mouse, it is not necessary to repeat to judge whether the current sector is already in the animation. The stop field also needs to be added to the above data structure
) {
this.data[index].stop = move(
item.hoverDrawRatio,
0,
300,
(cur) => {
this.data[index].hoverDrawRatio = cur;
this.renderPie();
},
() => {
this.data[index].hoverDrawRatio = 0;
this.data[index].stop = null;
},
"easeOutBounce"
);
}
});
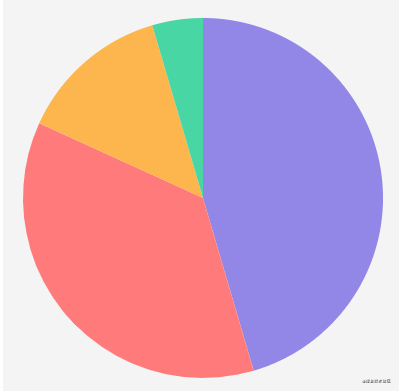
},The effects are as follows:
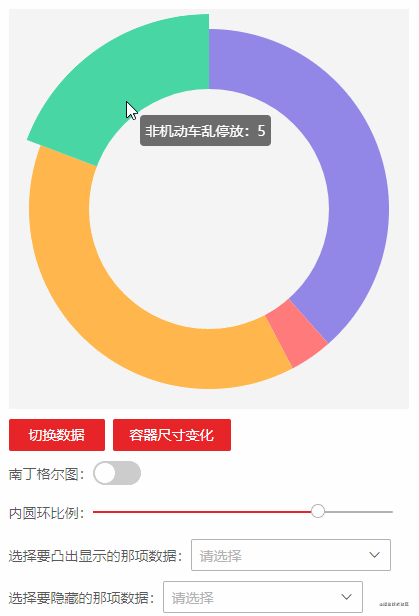
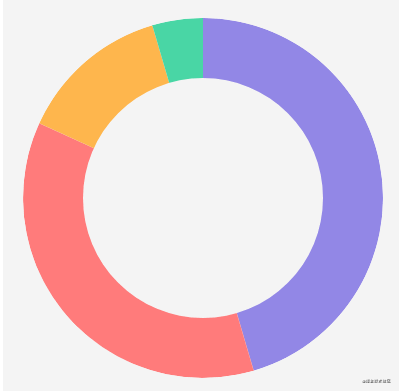
Ring graph
The ring chart is actually a hole dug in the middle of the pie chart. You can also use the clip method to create a ring path:
The so-called ring is a large circle and a small circle, but there will be two regions, one is the inner region of the small circle, and the other is the region between the small circle and the big circle. How can the clip method know which region to cut? The clip method actually has parameters. clip(fillRule), which represents the algorithm type to judge whether a point is in or out of the path, The default is to use the non-zero wrapping principle, and the other is the parity wrapping principle. The non-zero wrapping principle is very simple, that is, draw a line segment outward in an area. This line segment will have an intersection with the path. When it intersects with the clockwise line segment, it will increase by 1, and when it intersects with the counterclockwise line segment, it will decrease by 1. Finally, see whether the counter is 0. If it is 0, it will not be filled, and if it is not 0, it will be filled.
If we use two arc methods to draw two circular paths, what we need to fill here is the ring part, so if we draw a line from the ring to the outside with only one intersection, it will certainly be filled, but the final counter of the line segment drawn from the inside of the small circle is 1 + 1 = 2, and it will also be filled if it is not 0, so it is not a ring but a big circle, Therefore, one of the circular paths needs to be set counterclockwise through the last parameter of the arc method:
clipPath() {
    this.ctx.beginPath()
    this.ctx.arc(0, 0, this.radiusInner, 0, Math.PI * 2)// Inner circle clockwise
    this.ctx.arc(0, 0, this.radius, 0, Math.PI * 2, true)// Outer circle counterclockwise
    this.ctx.closePath()
    this.ctx.clip()
}
This method is called before calling the method of traversing the fan sector renderPie.
// Wrap as a new function, and replace all previous calls to renderPie to draw with drawPie
drawPie() {
    this.clear()
    this.ctx.save()
    // Crop torus region
    this.clipPath()
    // Draw a ring
    this.renderPie()
    this.ctx.restore()
}
There is a problem that the radius of the outer circle of the cutting ring is radius, but if a sector is enlarged, it will not be displayed. Therefore, it is necessary to traverse the sector data in real time to obtain the current maximum radius. You can use the calculation attribute to do this:
{
    computed: {
        hoverRadius() {
            let max = null
            this.data.forEach((item) => {
                if (max === null) {
                    max = item.hoverDrawRatio
                } else {
                    if (item.hoverDrawRatio > max) {
                        max = item.hoverDrawRatio
                    }
                }
            })
            return this.radius + this.radius * max
        }
    }
}
The effects are as follows:
It can be seen that there is a bug in the figure above, that is, moving the mouse to the inner circle will still trigger the protruding animation effect. The solution is very simple. In the previous getHoverAngleIndex method, we first check whether the mouse moves to the inner circle. If so, we won't carry out subsequent fan-shaped detection:
getHoverAngleIndex(x, y) {
    this.ctx.save();
    // Move to the inner circle without triggering, create a path with the size of the inner circle, and call the isPointInPath method for detection
    if (this.checkHoverInInnerCircle(x, y))
        return null;
    }
    let index = this.renderPie(true, x, y);
    this.ctx.restore();
    return index;
}
Nightingale rose
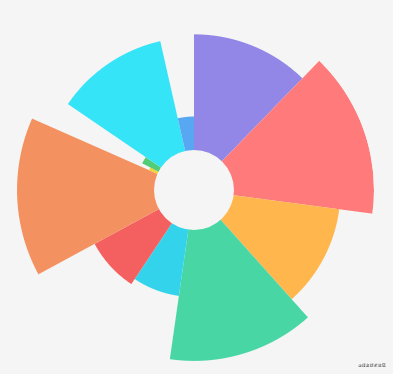
Finally, let's realize the Nightingale rose chart. It is clear from a person named Nightingale that it is a circular histogram, which is equivalent to pulling a cylindrical chart into a circle and using the fan-shaped radius to represent the size of the data. In fact, the implementation is to distinguish the fan-shaped radius in the ring chart by proportion.
The renderPie method is to be modified. The drawn radius can be multiplied by a unified radius and their respective proportion:
renderPie (checkHover, x, y) {
let hoverIndex = null
this.data.forEach((item, index) => {
// ...
// let _radius = this.radius + this.radius * item.hoverDrawRatio --
// this.ctx.arc(0, 0, _radius, startRadian, endRadian)
// ++
// The size proportion of the sector and the largest sector is converted into the proportion of the ring
let nightingaleRadius =
(1 - item.num / this.max) * // The remaining part of the ring minus the proportion
(this.radius - this.radiusInner)// The size of the ring
let _radius = this.radius - nightingaleRadius// Subtract the excess from the radius of the outer circle
let _radius = _radius + _radius * item.hoverDrawRatio
this.ctx.arc(0, 0, _radius, startRadian, endRadian)
// ...
});
// ...
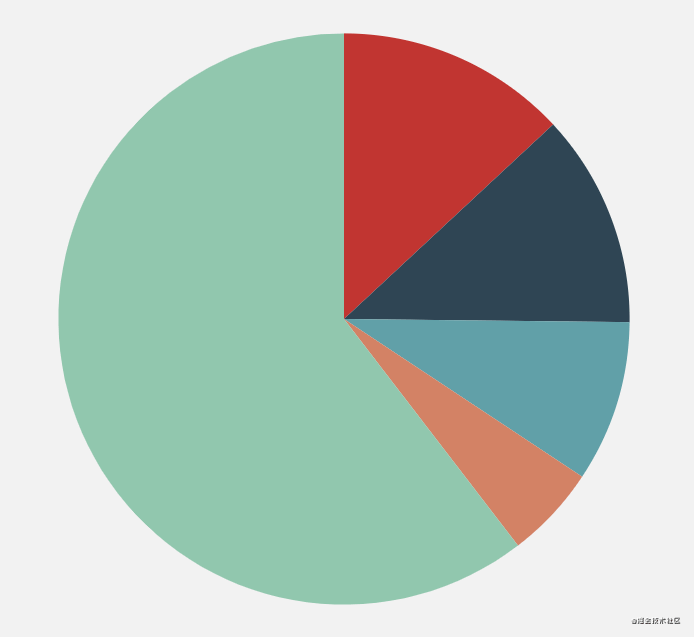
}The effects are as follows:
summary
This paper reviews some basic knowledge of canvas through a simple pie chart. Canvas also has many useful and advanced features. For example, isPointInStroke can be used to detect whether a point is on a path. Matrix transformation also supports rotation and scaling, and can also be used to process images. Those interested can understand it by themselves.
Code uploaded to github: https://github.com/wanglin2/pieChart