1: Background
I believe that many friends took down a dump file after encountering various wonderful problems in the application, worked hard for a long time, and finally found a suspicious method on the call stack of a thread, but windbg often displays the method code in the form of assembly. Unfortunately, today's assembly, How many code farmers like us can understand it? 😂😂😂
Then comes the sharp question, how to convert these assembly codes into C# source code. If not, it's better to convert them into IL code. At least I can try to understand them with my efforts...
In this article, I'll share how to extract the method source code in dump.
2: Extract source code from dump file
1. Case demonstration
For the convenience of demonstration, I use netcore 3.1 wrote a simple demo with the following code:
namespace ConsoleApp6
{
    class Program
    {
        static void Main(string[] args)
        {
            Run();
        }

        static void Run()
        {
            Console.WriteLine("hello world!");
            Console.ReadLine();
        }
    }
}
After running the program, use task manager, adplus and procdump to grab dump.
2. Use lm + savemodule command to extract
If your program is simple enough, you can directly use lm to obtain all modules in the program, and then use savemodule to export the modules as exe/dll physical files, as shown below:
- Extract all modules using lm
0:000> lm
start             end                 module name
000002c2`264b0000 000002c2`264b8000   ConsoleApp6_2c2264b0000   (deferred)
00007ff7`e4a50000 00007ff7`e4a7f000   ConsoleApp6   (deferred)
00007ffa`a4b50000 00007ffa`a546d000   System_Private_CoreLib   (deferred)
00007ffa`a5470000 00007ffa`a59df000   coreclr    (deferred)
00007ffa`df070000 00007ffa`df1b2000   clrjit     (deferred)
...
You can vaguely see that I have one called ConsoleApp6_2c2264b0000 module, which is the consoleapp6 I want to extract Exe, by the way, that annoying ConsoleApp6 (deferred) is a PE file. How do I know? Just give it a try 😁
- Extract using savemodule
You can see from the first row of console eapp6 above_ The start ing address of 2c2264b0000 is 000002c2264b0000, and then export it to E:\dump with savemodule.
0:000> !savemodule 000002c2`264b0000 E:\dump\ConsoleApp6.exe
3 sections in file
section 0 - VA=2000, VASize=6c4, FileAddr=200, FileSize=800
section 1 - VA=4000, VASize=564, FileAddr=a00, FileSize=600
section 2 - VA=6000, VASize=c, FileAddr=1000, FileSize=200
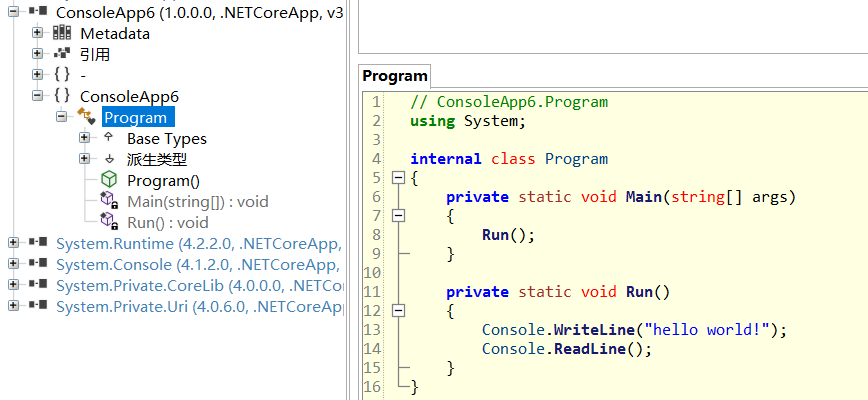
Then you can see that there is an additional consoleapp6 in E:\dump exe 🐂, With this thing, it's much easier to see the source code. You can decompile it directly with ILSpy.

3. Use dumpdomain/module + savemodule to extract
In the actual development, your program may be very complex. You can't find the Module directly by using lm. The best way is to find the Module you want by following the diagram. Remember the relationship between AppDomain, assembly and Module mentioned in CLR Via C#? If you want to know more about it, I suggest you look through it. I'll briefly describe here. Assembly generally includes several Module + resource files. Assembly is a dll/exe file. After the program runs, the assembly is properly placed in AppDomain.
With the above idea, can you find the module through the process AppDomain - > assembly - > module? Next, let's see how to implement it.
- use! dumpdomain find the program domain where ConsoleApp6 is located
0:000> !dumpdomain
--------------------------------------
System Domain:      00007ffaa59996f0
LowFrequencyHeap:   00007FFAA5999C58
HighFrequencyHeap:  00007FFAA5999CE8
StubHeap:           00007FFAA5999D78
Stage:              OPEN
Name:               None
--------------------------------------
Domain 1:           000002c224b6ca80
LowFrequencyHeap:   00007FFAA5999C58
HighFrequencyHeap:  00007FFAA5999CE8
StubHeap:           00007FFAA5999D78
Stage:              OPEN
Name:               clrhost
Assembly:           000002c224bf1c00 [C:\Program Files\dotnet\shared\Microsoft.NETCore.App\3.1.12\System.Private.CoreLib.dll]
ClassLoader:        000002C224B61820
  Module
  00007ffa45984020    C:\Program Files\dotnet\shared\Microsoft.NETCore.App\3.1.12\System.Private.CoreLib.dll

Assembly:           000002c224bf1980 [E:\net5\ConsoleApp3\ConsoleApp6\bin\Debug\netcoreapp3.1\ConsoleApp6.dll]
ClassLoader:        000002C224BE3F80
  Module
  00007ffa45b5f7d0    E:\net5\ConsoleApp3\ConsoleApp6\bin\Debug\netcoreapp3.1\ConsoleApp6.dll
Embarrassed, remember good words, in NET Framework has three application domains by default.
- System Domain
- Shared Domain
- Domain 1
How did you get there NET Core lost a Shard Domain 😄😄😄, Forget it first. From the figure, you can clearly see that there is my DLL e: \ net5 \ consoleapp3 \ consoleapp6 \ bin \ debug \ netcoreapp3 on Domian 1 1\ConsoleApp6. DLL and a module address 00007ffa45b5f7d0.
- use! dumpmodule get module details
0:000> !DumpModule /d 00007ffa45b5f7d0
Name: E:\net5\ConsoleApp3\ConsoleApp6\bin\Debug\netcoreapp3.1\ConsoleApp6.dll
Attributes:              PEFile SupportsUpdateableMethods
Assembly:                000002c224bf1980
BaseAddress:             000002C2264B0000
PEFile:                  000002C224BF2300
ModuleId:                00007FFA45B5FB98
ModuleIndex:             0000000000000001
LoaderHeap:              0000000000000000
TypeDefToMethodTableMap: 00007FFA45B3C8D0
TypeRefToMethodTableMap: 00007FFA45B3C8E8
MethodDefToDescMap:      00007FFA45B3C958
FieldDefToDescMap:       00007FFA45B3C978
MemberRefToDescMap:      0000000000000000
FileReferencesMap:       00007FFA45B3C988
AssemblyReferencesMap:   00007FFA45B3C990
MetaData start address:  000002C2264B2078 (1304 bytes)
From the BaseAddress: 000002C2264B0000 above, we can see that the start address of the module is 000002C2264B0000. Is it consistent with the address I just extracted with lm? Finally, export it with savemodule. For differentiation, I call it consoleapp7 Exe, as follows:
0:000> !savemodule 000002C2264B0000 E:\dump\ConsoleApp7.exe
3 sections in file
section 0 - VA=2000, VASize=6c4, FileAddr=200, FileSize=800
section 1 - VA=4000, VASize=564, FileAddr=a00, FileSize=600
section 2 - VA=6000, VASize=c, FileAddr=1000, FileSize=200

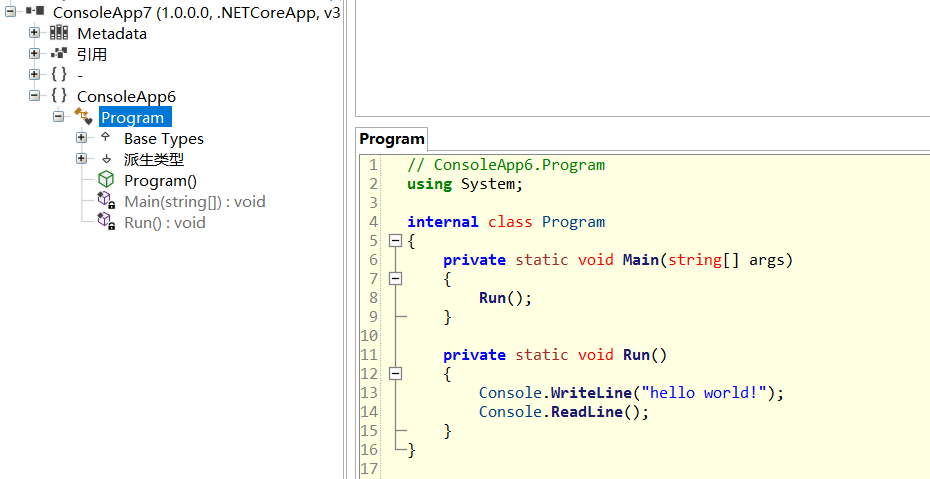
Ha ha, the rest is to decompile CosoleApp7 with ILSpy.
