How to monitor Log4j2 asynchronous logs for writing bottlenecks
In a previous article( A penetrating Log4j2 asynchronous log output blocking problem ), we analyzed the location of a classic Log4j2 asynchronous log blocking problem in detail. The main reason is that the log file is written slowly. It also deeply analyzes the principle of Log4j2 asynchronous log, and finally gives some solutions.
New question - how to better deal with this situation?
The previously proposed solution is only for the optimization of the previously located problems, but with the development of the business, the amount of logs will certainly be more. A large number of logs may lead to writing logs as a new performance bottleneck. For this situation, we need to monitor.
The first thing I think of is the indicator monitoring of the external process collection system: now all services advocate going to the cloud and realize cloud native services. For cloud services, NFS (Network File System) is likely to be used to store logs, such as EFS of AWS. This NFS can dynamically control the maximum IO load every move, but the service growth is difficult to predict perfectly, and the high concurrent business traffic basically arrives in an instant, It is difficult to evaluate the real traffic peak only through IO timing collection (for example, IO timing collection is once in 5s, but a lot of traffic suddenly arrives in a second, resulting in most threads blocking in the process. After collecting IO, it seems that the IO pressure is not large). Moreover, due to thread blocking, the CPU occupation we may see is not high. Therefore, it is difficult to really locate the log traffic problem with external timing collection indicators.
Then we consider monitoring the process itself, exposing the interface to external monitoring and regular inspection, such as the pod health inspection of K8s, etc. When the log writing pressure of the process is too high, a new instance is expanded; After startup, set the status of the process with high log pressure to temporarily offline in the registry (for example, Eureka is set to OUT_OF_SERVICE and Nacos is set to PAUSED), so that the traffic can be forwarded to other instances. After the log pressure is low, modify the status to UP and continue the service.
So how to achieve this monitoring?
The core of monitoring Log4j2 asynchronous logs - monitoring RingBuffer
According to the principle of Log4j2 asynchronous log, we know that its core is the RingBuffer data structure as the cache. We can monitor the change of its remaining size to judge the current log pressure. So how can I get it?
Relationship between Log4j2 asynchronous log and RingBuffer
Log4j2 for each asyncloger configuration, an independent RingBuffer will be created, such as the following log4j2 configuration:
<!--Omitted except loggers Configuration other than-->
 <loggers>
    <!--default logger -->
    <Asyncroot level="info" includeLocation="true">
        <appender-ref ref="console"/>
    </Asyncroot>
    <AsyncLogger name="RocketmqClient" level="error" additivity="false" includeLocation="true">
        <appender-ref ref="console"/>
    </AsyncLogger>
    <AsyncLogger name="com.alibaba.druid.pool.DruidDataSourceStatLoggerImpl" level="error" additivity="false" includeLocation="true">
        <appender-ref ref="console"/>
    </AsyncLogger>
    <AsyncLogger name="org.mybatis" level="error" additivity="false" includeLocation="true">
        <appender-ref ref="console"/>
    </AsyncLogger>
</loggers>
This configuration contains four asynclogers, and a RingBuffer will be created for each asyncloger. Log4j2 also considers the monitoring of asyncloger, so the monitoring of asyncloger is exposed as an MBean (JMX Managed Bean).
The relevant source code is as follows:
private static void registerLoggerConfigs(final LoggerContext ctx, final MBeanServer mbs, final Executor executor)
        throws InstanceAlreadyExistsException, MBeanRegistrationException, NotCompliantMBeanException {

    //Get log4j2 All configuration values under the loggers tag in the XML configuration
    final Map<String, LoggerConfig> map = ctx.getConfiguration().getLoggers();
    //Each key is actually the name of the logger
    for (final String name : map.keySet()) {
        final LoggerConfig cfg = map.get(name);
        final LoggerConfigAdmin mbean = new LoggerConfigAdmin(ctx, cfg);
        //Register a LoggerConfigAdmin for each logger
        register(mbs, mbean, mbean.getObjectName());
        //If it is an asynchronous log configuration, register a RingBufferAdmin
        if (cfg instanceof AsyncLoggerConfig) {
            final AsyncLoggerConfig async = (AsyncLoggerConfig) cfg;
            final RingBufferAdmin rbmbean = async.createRingBufferAdmin(ctx.getName());
            register(mbs, rbmbean, rbmbean.getObjectName());
        }
    }
}
Class source code of MBean created: RingBufferAdmin.java
public class RingBufferAdmin implements RingBufferAdminMBean {
    private final RingBuffer<?> ringBuffer;
    private final ObjectName objectName;
    //...  Omit other code we don't care about

    public static final String DOMAIN = "org.apache.logging.log4j2";
    String PATTERN_ASYNC_LOGGER_CONFIG = DOMAIN + ":type=%s,component=Loggers,name=%s,subtype=RingBuffer";

    //Create RingBufferAdmin. The name format conforms to the name format of Mbean
    public static RingBufferAdmin forAsyncLoggerConfig(final RingBuffer<?> ringBuffer,
            final String contextName, final String configName) {
        final String ctxName = Server.escape(contextName);
        //For RootLogger, cfgName here is an empty string
        final String cfgName = Server.escape(configName);
        final String name = String.format(PATTERN_ASYNC_LOGGER_CONFIG, ctxName, cfgName);
        return new RingBufferAdmin(ringBuffer, name);
    }

    //Gets the size of RingBuffer
    @Override
    public long getBufferSize() {
        return ringBuffer == null ? 0 : ringBuffer.getBufferSize();
    }
    //Gets the remaining size of RingBuffer
    @Override
    public long getRemainingCapacity() {
        return ringBuffer == null ? 0 : ringBuffer.remainingCapacity();
    }
    public ObjectName getObjectName() {
        return objectName;
    }
}
We can view the corresponding MBean s through JConsole:
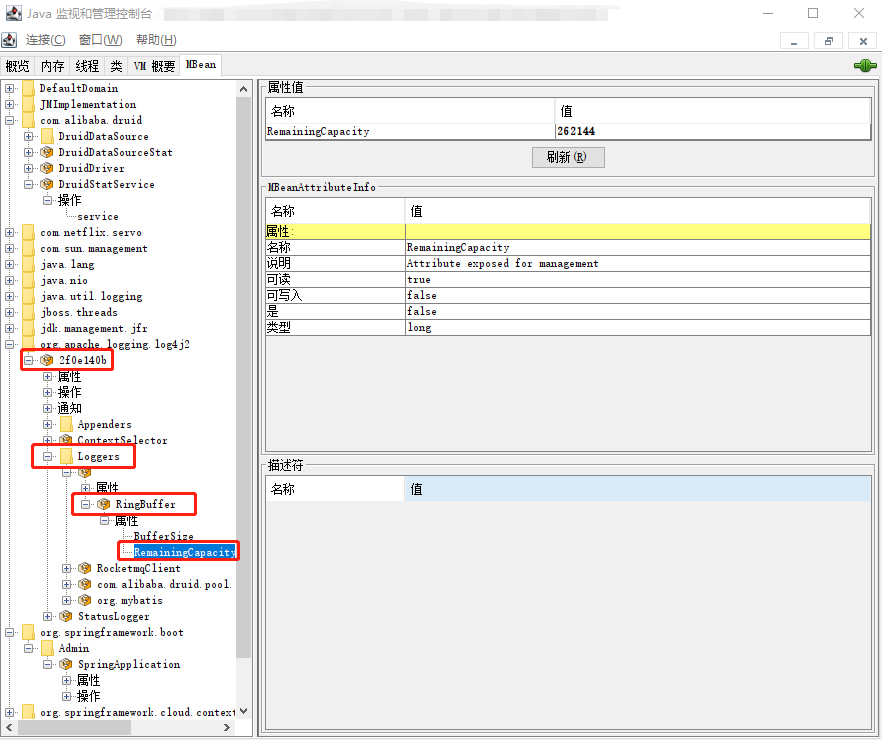
Where 2f0e140b is the name of LoggerContext.
Spring Boot + Prometheus monitors Log4j2 RingBuffer size
Our microservice project uses spring boot and integrates prometheus. We can expose the Log4j2 RingBuffer size as an indicator to prometheus through the following code:
import io.micrometer.core.instrument.Gauge;
import io.micrometer.prometheus.PrometheusMeterRegistry;
import lombok.extern.log4j.Log4j2;
import org.apache.commons.lang3.StringUtils;
import org.apache.logging.log4j.LogManager;
import org.apache.logging.log4j.core.LoggerContext;
import org.apache.logging.log4j.core.jmx.RingBufferAdminMBean;
import org.springframework.beans.factory.ObjectProvider;
import org.springframework.beans.factory.annotation.Autowired;
import org.springframework.boot.actuate.autoconfigure.metrics.export.ConditionalOnEnabledMetricsExport;
import org.springframework.context.annotation.Configuration;
import org.springframework.context.event.ContextRefreshedEvent;
import org.springframework.context.event.EventListener;

import javax.annotation.PostConstruct;
import javax.management.ObjectName;
import java.lang.management.ManagementFactory;

@Log4j2
@Configuration(proxyBeanMethods = false)
//It needs to be loaded when prometheus is introduced and the actor exposes the prometheus port
@ConditionalOnEnabledMetricsExport("prometheus")
public class Log4j2Configuration {
    @Autowired
    private ObjectProvider<PrometheusMeterRegistry> meterRegistry;
    //Initialize only once
    private volatile boolean isInitialized = false;

    //You need to register after the ApplicationContext is refreshed
    //The log configuration is initialized before the ApplicationContext is loaded
    //However, the loading of related beans of prometheus is complex, and there are many changes with the version change, so we are lazy and register after the entire ApplicationContext is refreshed
    // ApplicationContext may refresh multiple times, such as calling / Actor / refresh, and there are multiple ApplicationContext scenarios
    // For simplicity, a simple isInitialized is used to determine whether it is the first initialization, and ensure that it is initialized only once
    @EventListener(ContextRefreshedEvent.class)
    public synchronized void init() {
        if (!isInitialized) {
            //Obtain LoggerContext through LogManager to obtain configuration
            LoggerContext loggerContext = (LoggerContext) LogManager.getContext(false);
            org.apache.logging.log4j.core.config.Configuration configuration = loggerContext.getConfiguration();
            //Get the name of LoggerContext because the name of Mbean contains this
            String ctxName = loggerContext.getName();
            configuration.getLoggers().keySet().forEach(k -> {
                try {
                    //For the RootLogger, its cfgName is an empty string. For good display, we name it root in prometheus
                    String cfgName = StringUtils.isBlank(k) ? "" : k;
                    String gaugeName = StringUtils.isBlank(k) ? "root" : k;
                    Gauge.builder(gaugeName + "_logger_ring_buffer_remaining_capacity", () ->
                    {
                        try {
                            return (Number) ManagementFactory.getPlatformMBeanServer()
                                    .getAttribute(new ObjectName(
                                            //Assemble the name according to the naming method in the Log4j2 source code
                                            String.format(RingBufferAdminMBean.PATTERN_ASYNC_LOGGER_CONFIG, ctxName, cfgName)
                                            //Get the remaining size. Note that this is strictly case sensitive
                                    ), "RemainingCapacity");
                        } catch (Exception e) {
                            log.error("get {} ring buffer remaining size error", k, e);
                        }
                        return -1;
                    }).register(meterRegistry.getIfAvailable());
                } catch (Exception e) {
                    log.error("Log4j2Configuration-init error: {}", e.getMessage(), e);
                }
            });
            isInitialized = true;
        }
    }
}
After adding this code and requesting / Actor / Prometheus, you can see the corresponding return:
//Omit other
# HELP root_logger_ring_buffer_remaining_capacity
# TYPE root_logger_ring_buffer_remaining_capacity gauge
root_logger_ring_buffer_remaining_capacity 262144.0
# HELP org_mybatis_logger_ring_buffer_remaining_capacity
# TYPE org_mybatis_logger_ring_buffer_remaining_capacity gauge
org_mybatis_logger_ring_buffer_remaining_capacity 262144.0
# HELP com_alibaba_druid_pool_DruidDataSourceStatLoggerImpl_logger_ring_buffer_remaining_capacity
# TYPE com_alibaba_druid_pool_DruidDataSourceStatLoggerImpl_logger_ring_buffer_remaining_capacity gauge
com_alibaba_druid_pool_DruidDataSourceStatLoggerImpl_logger_ring_buffer_remaining_capacity 262144.0
# HELP RocketmqClient_logger_ring_buffer_remaining_capacity
# TYPE RocketmqClient_logger_ring_buffer_remaining_capacity gauge
RocketmqClient_logger_ring_buffer_remaining_capacity 262144.0
In this way, when this value is 0 for a period of time (it means that the RingBuffer is full and the log generation speed is much faster than the speed of consumption writing to the Appender), we think that the application log load is too high.