1. Introduction
Skeleton dataset is widely used in motion recognition and prediction because of its strong robustness. NTU RGB-D data is the most commonly used skeleton action dataset. Whether describing your own data in the paper or analyzing the feature change process, visualization is an essential step. This paper will use Python's Matplotlib library to visualize the skeleton data based on NTU RGB-D data set
2. Data analysis
The data set of NTU RGB-D is very standard. Its file suffix is'. skeleton '. Open it directly with Notepad. The results are as follows:

From top to bottom are the number of frames, the number of skeletons (no more than 2, that is, the action is completed by one or two people on the dataset), other skeleton information (originally referred to as' bodyID ',' clipedEdges', 'handLeftConfidence', 'handLeftState', 'handRightConfidence', 'handRightState', 'isresisted', 'leanX', 'leanY', 'trackingState') There are several joint points in a skeleton and the information of each joint point ('x ',' y ',' z ',' depthX ',' depthY ',' colorX ',' colorY ',' orientationW ',' orientationX ',' orientationY ',' orientationZ ',' trackingState ')
Among them, we only need x, y and z (2D graph only needs X and y), so our program is roughly as follows:
- Import data file
- Create a 0 populated list to store data
- Loop every frame, every skeleton and every joint point to assign data to the array
- Draw, draw skeleton nodes with scatter diagram, and draw bone connections with line diagram
- Frame by frame display
3. Code implementation
First, import the dependent package and data file path, and set the parameters
import numpy as np
import matplotlib.pyplot as plt

file_name = r'C:\Users\lenovo\Desktop\visiual/S001C001P001R001A009.skeleton'
max_V = 25 #Number of nodes
max_M = 2 #Number of skeletons
Then loop through to obtain the joint point coordinate information
with open(file_name, 'r') as fr:
    frame_num = int(fr.readline())
    point = np.zeros((3, frame_num, 25, 2))
    for frame in range(frame_num):
        person_num = int(fr.readline())
        for person in range(person_num):
            fr.readline()
            joint_num = int(fr.readline())
            for joint in range(joint_num):
                v = fr.readline().split(' ')
                if joint < max_V and person < max_M:
                    point[0,frame,joint,person] = float(v[0])#A coordinate of a joint
                    point[1,frame,joint,person] = float(v[1])
                    point[2,frame,joint,person] = float(v[2])
Prepare the drawing and select the appropriate coordinate axis according to the coordinate value
xmax= np.max(point[0, :, :, :])+ 0.5
xmin= np.min(point[0, :, :, :])- 0.5
ymax= np.max(point[1, :, :, :])+ 0.3
ymin= np.min(point[1, :, :, :])- 0.3
Judge which nodes are connected as bones by observing the data set
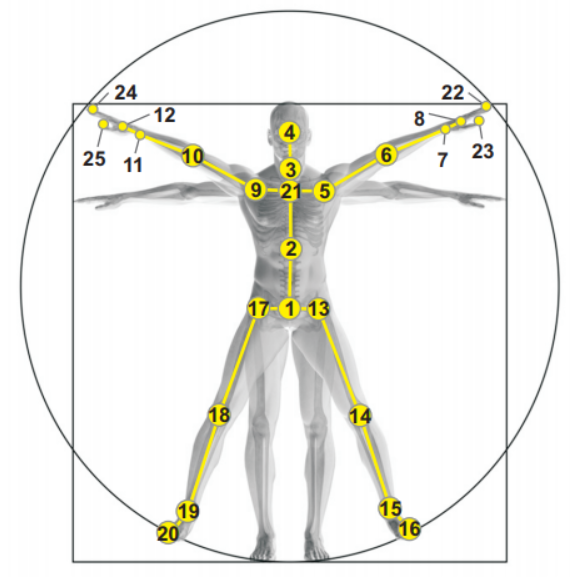
# Determine which nodes are connected as bones according to NTU skeleton structure
# Note that the sequence number starts from 0 and needs to be minus 1
arms= np.array([24,12,11,10,9,21,5,6,7,8,20])-1 #Arms
rightHand= np.array([12,25])-1 #one 's right hand
leftHand= np.array([8,23])-1 #left hand
legs= np.array([20,19,18,17,1,13,14,15,16]) - 1 #leg
body= np.array([4,3,21,2,1]) -1  #body
After setting the drawing parameters, draw the image frame by frame according to the node and connection diagram:
n= 0     # Show from frame n
m= 2 # At the end of frame m, n < m < row, this m can select a threshold less than the maximum number of frames for easy viewing. If m=1, a frame will be displayed
plt.figure()
plt.ion() #Use plt.ion() to convert the display mode of matplotlib to interactive mode. Even if plt.show() is encountered in the script, the code will continue to execute.
color_point = '#03ff' #Joint point color, which can be input into the hexadecimal palette
color_bone = 'red' #Bone color
for i in range(n, m):
    plt.cla() ## Clear axis clears the currently active axis in the current drawing. Other axes are not affected.
    plt.scatter(point[0, i, :, :], point[1, i, :, :], c=color_point, s=40.0) #Drawing joint points through scatter diagram
    #Draw the connecting line between two points through the line diagram, that is, the bone
    plt.plot(point[0, i, arms,0], point[1, i, arms,0], c=color_bone, lw=2.0)
    plt.plot(point[0, i, rightHand,0], point[1, i, rightHand,0], c=color_bone, lw=2.0)
    plt.plot(point[0, i, leftHand,0], point[1, i, leftHand,0], c=color_bone, lw=2.0)
    plt.plot(point[0, i, legs,0], point[1, i, legs,0], c=color_bone, lw=2.0)
    plt.plot(point[0, i, body,0], point[1, i, body,0], c=color_bone, lw=2.0)

    #Second skeleton, if any
    plt.plot(point[0, i, arms,1], point[1, i, arms,1], c=color_bone, lw=2.0)
    plt.plot(point[0, i, rightHand,1], point[1, i, rightHand,1], c=color_bone, lw=2.0)
    plt.plot(point[0, i, leftHand,1], point[1, i, leftHand,1], c=color_bone, lw=2.0)
    plt.plot(point[0, i, legs,1], point[1, i, legs,1], c=color_bone, lw=2.0)
    plt.plot(point[0, i, body,1], point[1, i, body,1], c=color_bone, lw=2.0)

    plt.text(xmax-0.5, ymax-0.1,'frame: {}/{}'.format(i, row-1)) #What frame is this
    plt.xlim(xmin, xmax) #Coordinate axis
    plt.ylim(ymin, ymax)
    plt.pause(0.001)

plt.ioff()
plt.show()
The result shows that the number of display frames, output color, line thickness, etc. can be adjusted according to the above drawing parameters. Here, only two frames are output:

Overall Code:
import numpy as np
import matplotlib.pyplot as plt

file_name = r'C:\Users\lenovo\Desktop\visiual/S001C001P001R001A009.skeleton'
max_V = 25 #Number of nodes
max_M = 2 #Number of skeletons
with open(file_name, 'r') as fr:
    frame_num = int(fr.readline())
    point = np.zeros((3, frame_num, 25, 2))
    for frame in range(frame_num):
        person_num = int(fr.readline())
        for person in range(person_num):
            fr.readline()
            joint_num = int(fr.readline())
            for joint in range(joint_num):
                v = fr.readline().split(' ')
                if joint < max_V and person < max_M:
                    point[0,frame,joint,person] = float(v[0])#A coordinate of a joint
                    point[1,frame,joint,person] = float(v[1])
                    point[2,frame,joint,person] = float(v[2])

print('read data done!')
print(point.shape)

#Select the appropriate coordinate axis through the maximum and minimum coordinate values
xmax= np.max(point[0, :, :, :])+ 0.5
xmin= np.min(point[0, :, :, :])- 0.5
ymax= np.max(point[1, :, :, :])+ 0.3
ymin= np.min(point[1, :, :, :])- 0.3
zmax= np.max(point[2, :, :, :])
zmin= np.min(point[2, :, :, :])

row= point.shape[1] #How many frames are there


# Determine which nodes are connected as bones according to NTU skeleton structure
# Note that the sequence number starts from 0 and needs to be minus 1
arms= np.array([24,12,11,10,9,21,5,6,7,8,20])-1 #Arms
rightHand= np.array([12,25])-1 #one 's right hand
leftHand= np.array([8,23])-1 #left hand
legs= np.array([20,19,18,17,1,13,14,15,16]) - 1 #leg
body= np.array([4,3,21,2,1]) -1  #body

n= 0     # Show from frame n
m= 2 # At the end of frame m, n < m < row, this m can select a threshold less than the maximum number of frames for easy viewing. If m=1, a frame will be displayed
plt.figure()
plt.ion() #Use plt.ion() to convert the display mode of matplotlib to interactive mode. Even if plt.show() is encountered in the script, the code will continue to execute.
color_point = '#03ff' #Joint point color, which can be input into the hexadecimal palette
color_bone = 'red' #Bone color
for i in range(n, m):
    plt.cla() ## Clear axis clears the currently active axis in the current drawing. Other axes are not affected.
    plt.scatter(point[0, i, :, :], point[1, i, :, :], c=color_point, s=40.0) #Drawing joint points through scatter diagram
    #Draw the connecting line between two points through the line diagram, that is, the bone
    plt.plot(point[0, i, arms,0], point[1, i, arms,0], c=color_bone, lw=2.0)
    plt.plot(point[0, i, rightHand,0], point[1, i, rightHand,0], c=color_bone, lw=2.0)
    plt.plot(point[0, i, leftHand,0], point[1, i, leftHand,0], c=color_bone, lw=2.0)
    plt.plot(point[0, i, legs,0], point[1, i, legs,0], c=color_bone, lw=2.0)
    plt.plot(point[0, i, body,0], point[1, i, body,0], c=color_bone, lw=2.0)

    #Second skeleton, if any
    plt.plot(point[0, i, arms,1], point[1, i, arms,1], c=color_bone, lw=2.0)
    plt.plot(point[0, i, rightHand,1], point[1, i, rightHand,1], c=color_bone, lw=2.0)
    plt.plot(point[0, i, leftHand,1], point[1, i, leftHand,1], c=color_bone, lw=2.0)
    plt.plot(point[0, i, legs,1], point[1, i, legs,1], c=color_bone, lw=2.0)
    plt.plot(point[0, i, body,1], point[1, i, body,1], c=color_bone, lw=2.0)

    plt.text(xmax-0.5, ymax-0.1,'frame: {}/{}'.format(i, row-1)) #What frame is this
    # plt.text(xmax-0.8, ymax-0.4, 'label: ' + str(label[i]))
    plt.xlim(xmin, xmax) #Coordinate axis
    plt.ylim(ymin, ymax)
    plt.pause(0.001)

plt.ioff()
plt.show()
4. Description
Part of the code refers to the blogger of the blog Garden https://www.cnblogs.com/picassooo/p/14044566.html , slightly modified and annotated
The core idea of this code is to draw joint points using scatter diagram and bones using straight-line diagram. If there are different image requirements, please refer to Matplotlib library to adjust the parameters by yourself.