We all know the importance of data. Even in a small project, we may use several charts to display. I need to use charts in the process of project construction recently. At last, I chose the echarts chart library. Why choose echarts? First, it's easy to start, second, it can almost meet all our development needs. Third, echarts should be made in China One of the best visual libraries.
Without much nonsense, let's see how to use echarts in Vue's projects.
The first method, directly introducing echarts
Install ecrats project dependencies
npm install echarts --save

//perhaps
npm install echarts -S
If there is no scientific Internet friends can use the domestic Taobao image.
npm install -g cnpm --registry=https://registry.npm.taobao.org

cnpm install echarts -S
Global introduction
After our installation, we can introduce ecrats globally in main.js
import echarts from "echarts";
Vue.prototype.$echarts = echarts;
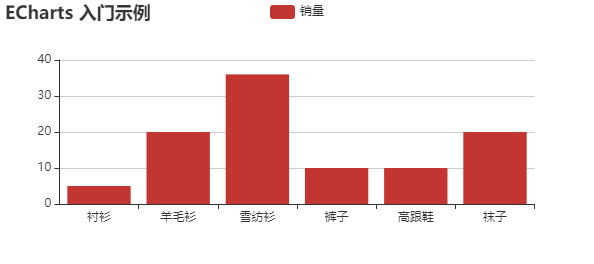
Create charts
<template>
  <div id="app">
    <div id="main" style="width: 600px;height:400px;"></div>
  </div>
</template>
export default {
  name: "app",
  methods: {
    drawChart() {
      //Initialize the echarts instance based on the prepared dom
      let myChart = this.$echarts.init(document.getElementById("main"));
      //Specify configuration items and data for the chart
      let option = {
        title: {
          text: "ECharts Introductory example"
        },
        tooltip: {},
        legend: {
          data: ["Sales volume"]
        },
        xAxis: {
          data: ["shirt", "Cardigan", "Chiffon shirt", "trousers", "High-heeled shoes", "Socks"]
        },
        yAxis: {},
        series: [
          {
            name: "Sales volume",
            type: "bar",
            data: [5, 20, 36, 10, 10, 20]
          }
        ]
      };
      //Use the configuration items and data just specified to display the chart.
      myChart.setOption(option);
    }
  },
  mounted() {
    this.drawChart();
  }
};
</script>
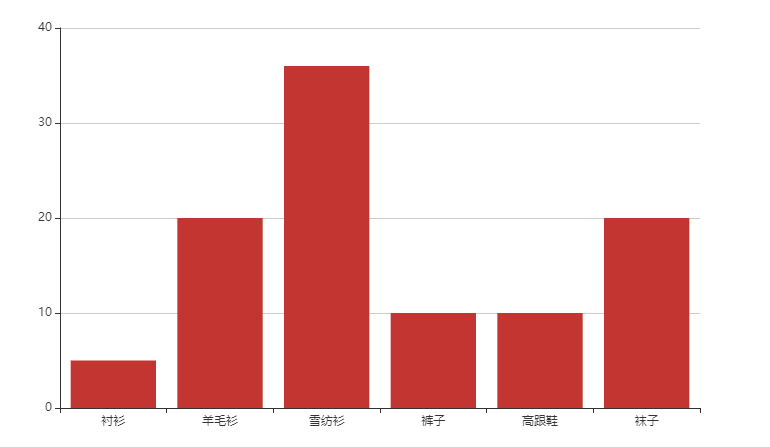
The second method uses the Vue echarts component
Installation components
npm install vue-echarts -S
Use components
<template>
  <div id="app">
    <v-chart class="my-chart" :options="bar"/>
  </div>
</template>
<script>
import ECharts from "vue-echarts/components/ECharts";
import "echarts/lib/chart/bar";
export default {
  name: "App",
  components: {
    "v-chart": ECharts
  },
  data: function() {
    return {
      bar: {
        title: {
          text: "ECharts Introductory example"
        },
        tooltip: {},
        legend: {
          data: ["Sales volume"]
        },
        xAxis: {
          data: ["shirt", "Cardigan", "Chiffon shirt", "trousers", "High-heeled shoes", "Socks"]
        },
        yAxis: {},
        series: [
          {
            name: "Sales volume",
            type: "bar",
            data: [5, 20, 36, 10, 10, 20]
          }
        ]
      }
    };
  }
};
</script>
<style>
.my-chart {
  width: 800px;
  height: 500px;
}
</style>