Introduction: to check the execution efficiency of SQL, it is not difficult to think of using explain to analyze slow queries, but the premise is that you need to know the business background very well. Otherwise, it is difficult to accurately locate.
All systems evolve gradually. A system must gradually improve the optimization performance according to the scenario. High concurrency is the test of resource conservation. In addition to replacing excellent and advanced technologies and optimizing the architecture, this test also lies in saving resources as much as possible from a small point of view.
In the data access of a system, the bottleneck of the system often comes from the database, so we should reduce the access to the database as much as possible!
1, Background
Have you ever encountered such a situation? The leader suddenly arranged one thing: the pressure measurement indicators of these interfaces are too low and need to be optimized.
Of course, ideally, you are very familiar with the business scenario. You can roughly locate the problem to analyze the business and accurately evaluate which SQL will have performance bottlenecks.
Then start Baidu: how to improve SQL execution efficiency?
Analyze slow queries through diagnostic tools such as explain, show profile and trace.
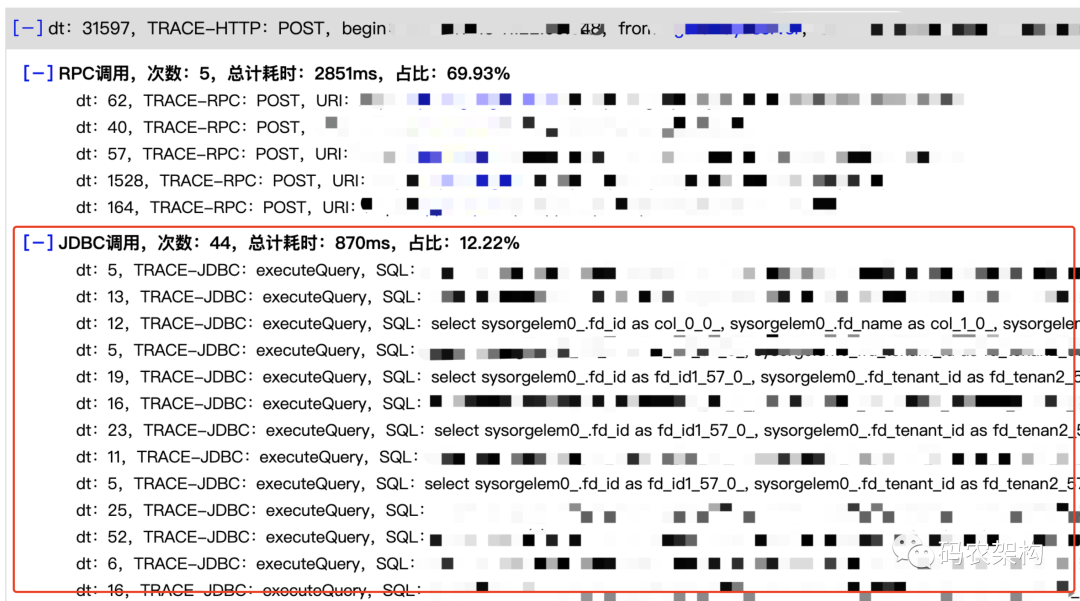
However, in most cases, the business line is too long to be completed by one person. It involves various policy modes and monitoring actions. To directly locate the point, you still need to output the SQL and execution efficiency triggered after the request is initiated. Here, efficiency only refers to the time of SQL execution.
Let's start the whole job when the goal is clear.
2, Add JDBC trace
Continue with the topic of the previous article: How to make good use of log link tracking for performance analysis?
SQL execution time formula
To deal with such problems, first of all, how to divide the SQL execution time calculation? The execution process of SQL statements is roughly as shown in the following figure.
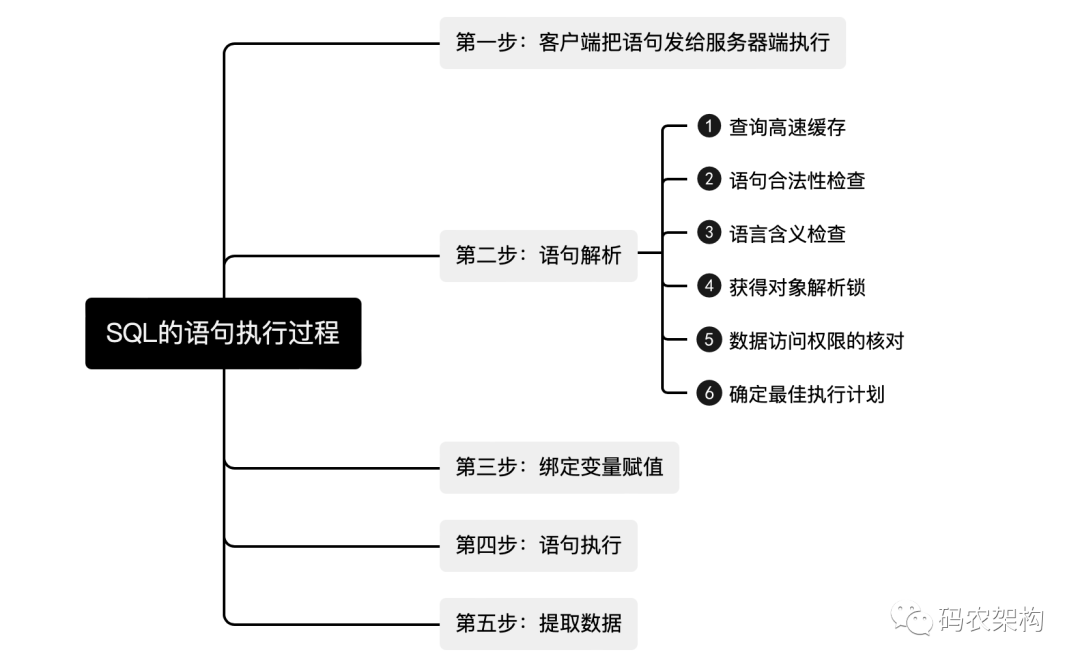
If you want to count the SQL execution time. So for the program, we can get a rough formula
SQL execution time=Time after data extraction-Syntax parsing start time
Add JDBC trace
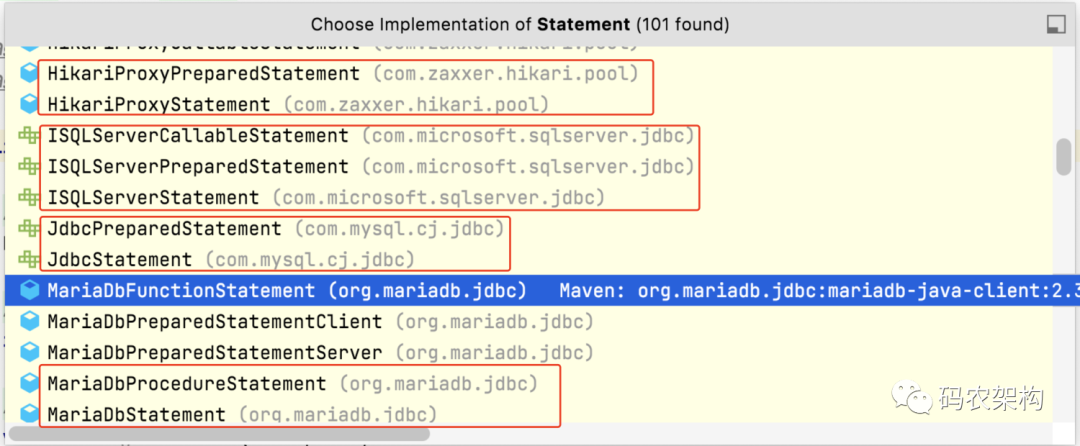
Those who have read persistence frameworks such as Hibernate or MyBatis should know that the Statement is located in Java SQL basic package
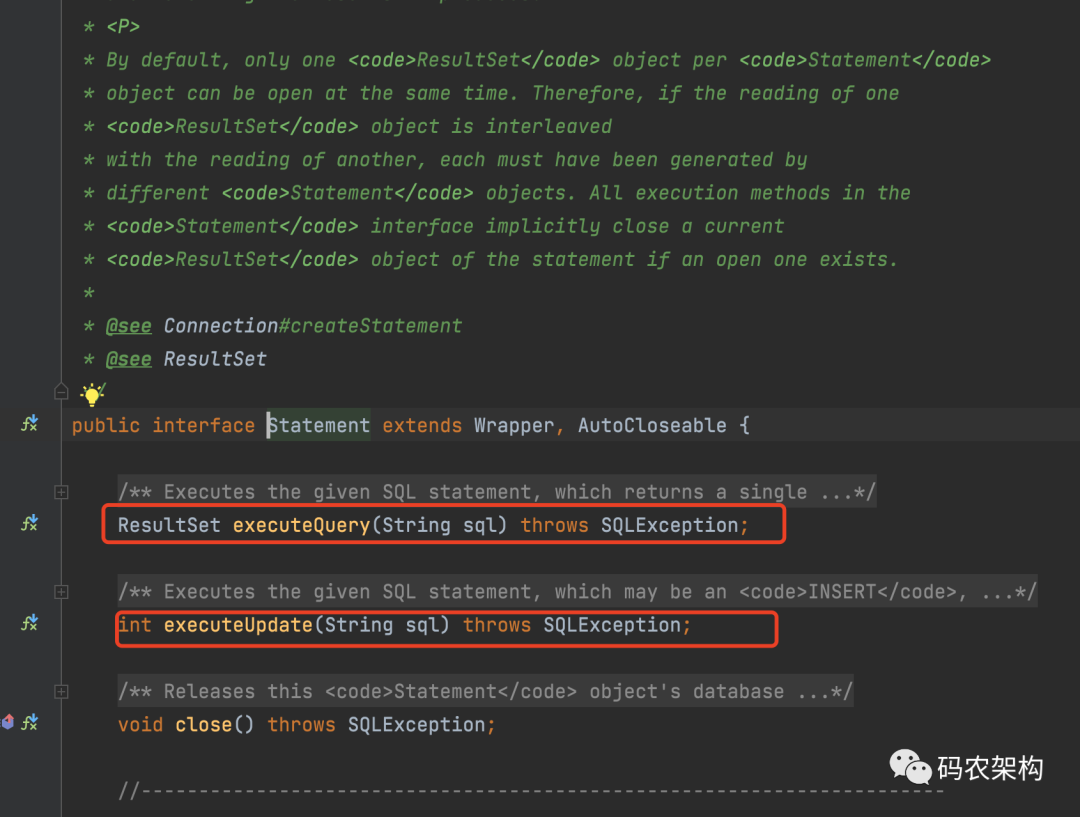
Statement provides an object for executing a static SQL statement and returning the results it produces. By default, only one ResultSet object can be opened at the same time for each statement object.
Therefore, if the reads of one ResultSet object are interleaved with those of another, each object must be generated by a different Statement object. If there is an open object, all execution methods in the Statement interface implicitly close the current ResultSet object of the Statement.
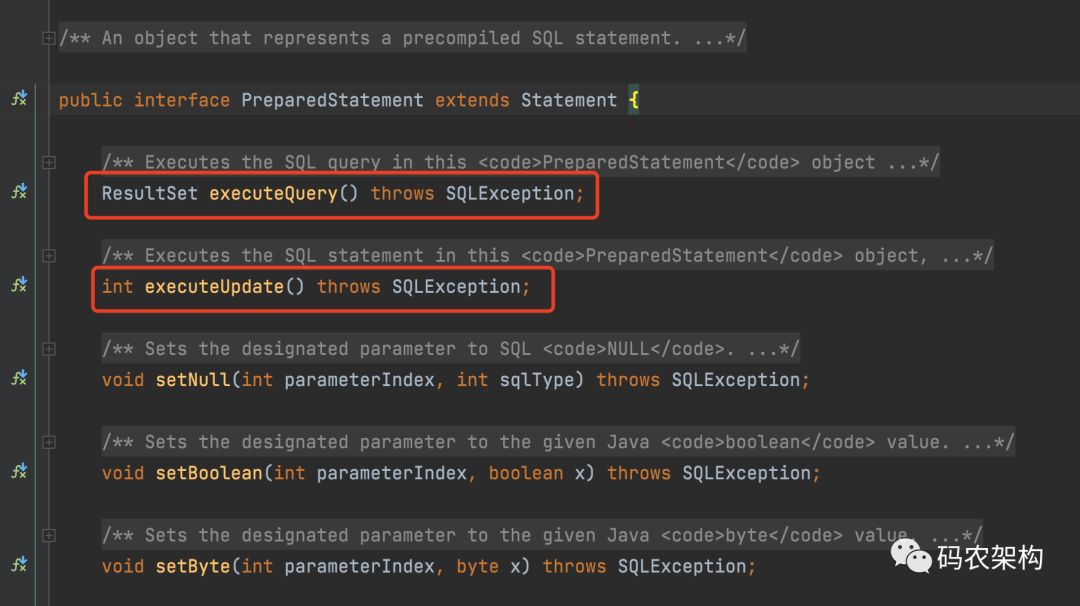
If you continue to check the source code, you can find that the PreparedStatement precompiles the SQL Statement after the Statement provides an object for executing the method. The SQL Statement is precompiled and stored in the PreparedStatement object. You can then effectively execute this Statement multiple times using this object.
In order to verify this idea, we can learn from other customized database drivers.
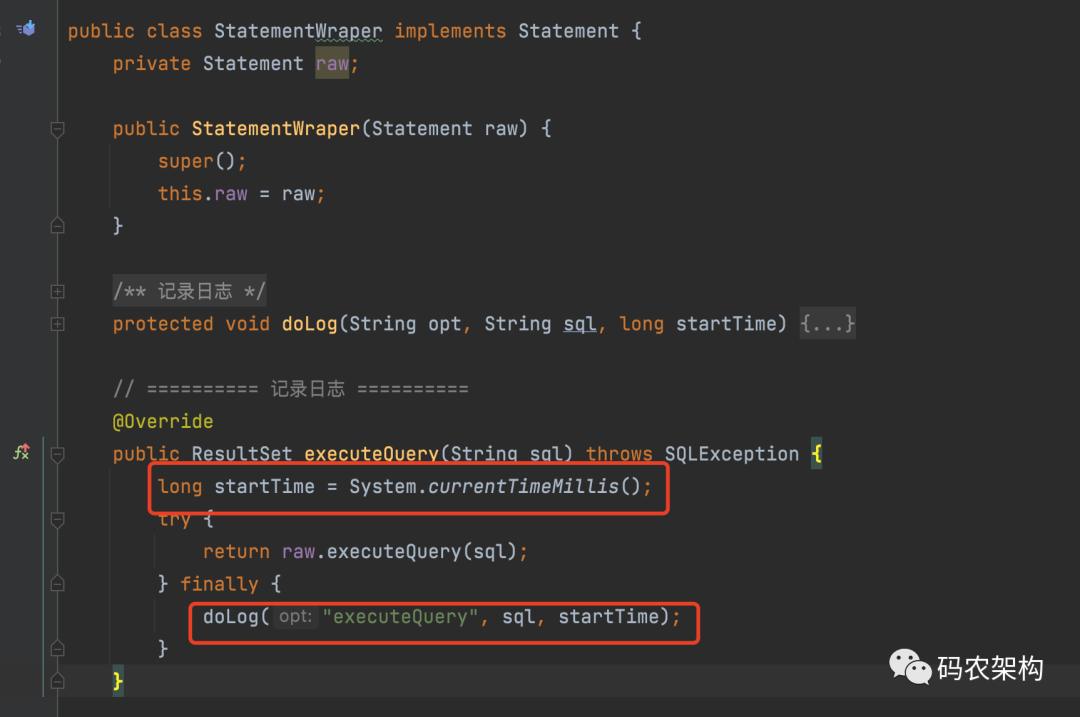
Defining a statementwrapper implementation provides an object for executing a static SQL Statement and returning the results it produces.

Log details
public class StatementWraper implements Statement {
private Statement raw;
public StatementWraper(Statement raw) {
super();
this.raw = raw;
}
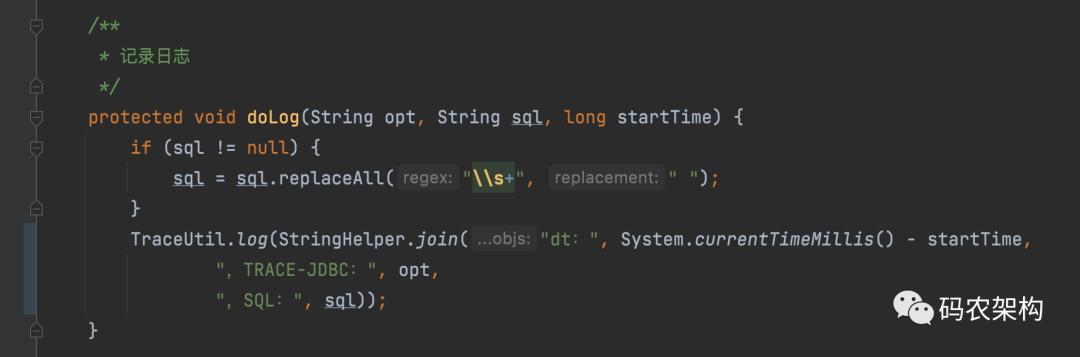
/**
* Log
*/
protected void doLog(String opt, String sql, long startTime) {
if (sql != null) {
sql = sql.replaceAll("\\s+", " ");
}
TraceUtil.log(StringHelper.join(
"dt: ", System.currentTimeMillis() - startTime,
",TRACE-JDBC: ", opt,
",SQL: ",sql));
}
// ==========Log==========
@Override
public ResultSet executeQuery(String sql) throws SQLException {
long startTime = System.currentTimeMillis();
try {
return raw.executeQuery(sql);
} finally {
doLog("executeQuery", sql, startTime);
}
}
....
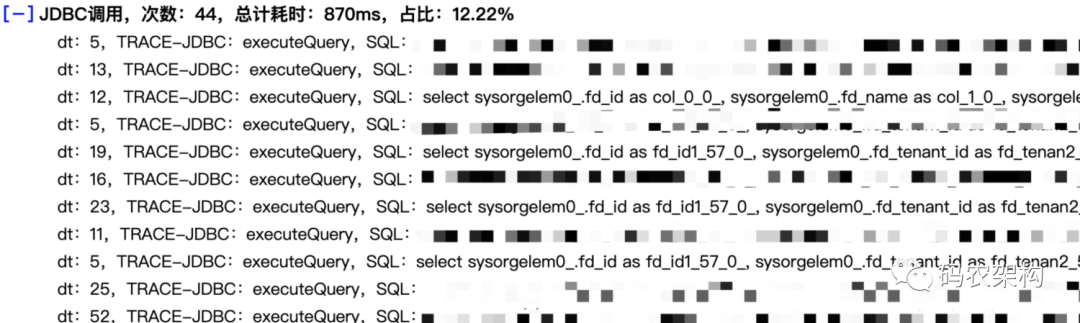
In this way, there is the time-consuming situation of SQL execution triggered by lock during program execution at the beginning of the article.
Similarly, define preparedstatementwrapper to implement PreparedStatement
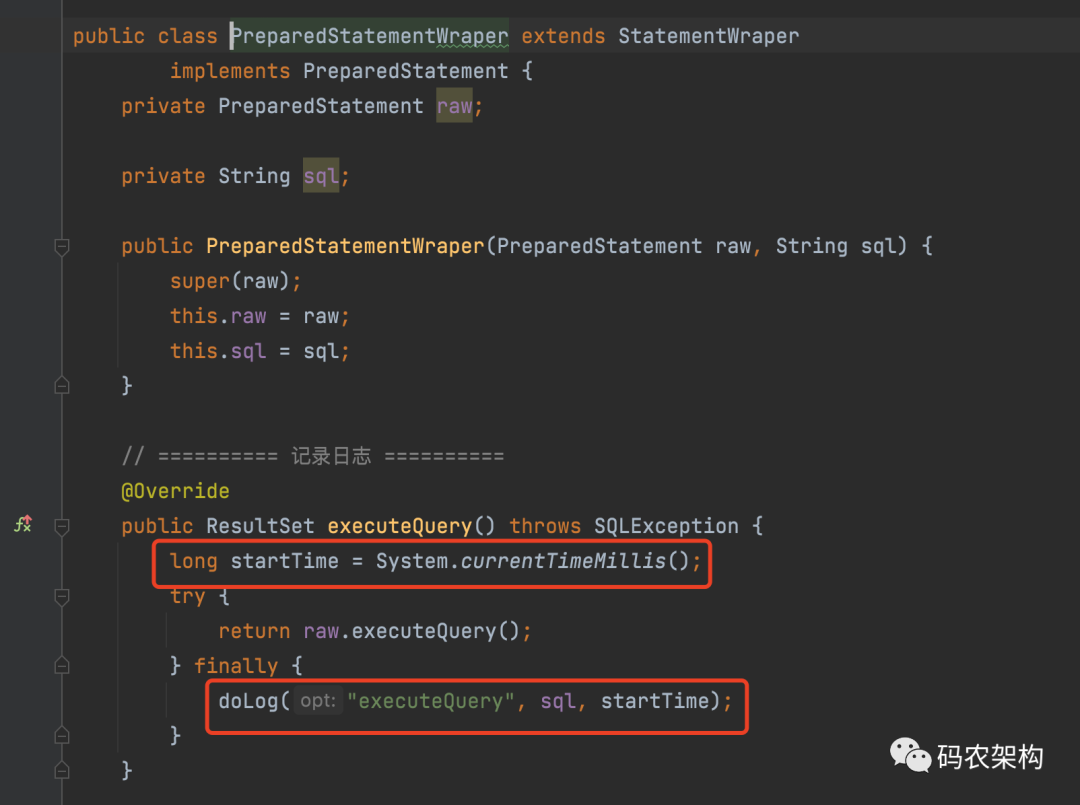
public class PreparedStatementWraper extends StatementWraper
  implements PreparedStatement {
 private PreparedStatement raw;

 private String sql;

 public PreparedStatementWraper(PreparedStatement raw, String sql) {
  super(raw);
  this.raw = raw;
  this.sql = sql;
 }

 // ==========Log==========
 @Override
 public ResultSet executeQuery() throws SQLException {
  long startTime = System.currentTimeMillis();
  try {
   return raw.executeQuery();
  } finally {
   doLog("executeQuery", sql, startTime);
  }
 }
....
Finally, log output uses the logback component for log collection
This kind of problem has been introduced before