Hello, I'm Chen Chen
A few days ago, Ya was fined 1.341 billion yuan for tax evasion. As soon as the news came out, it aroused thousands of waves on the Internet, and netizens fried the pot directly. They are all feeling that they don't know whether they have paid more fines for the money they earn in this life.
So I crawled the data under this microblog and conducted a simple public opinion analysis!
01 Analysis page
Because it is more convenient to crawl the microblog from the mobile terminal, we choose to crawl the microblog from the mobile terminal this time.
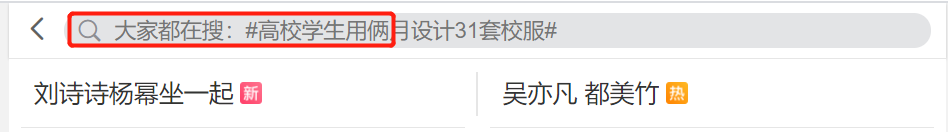
We usually enter keywords in this place to search the microblog content.
By observing this page in developer mode, I found that every time it makes a request for keywords, it will return an XHR response.
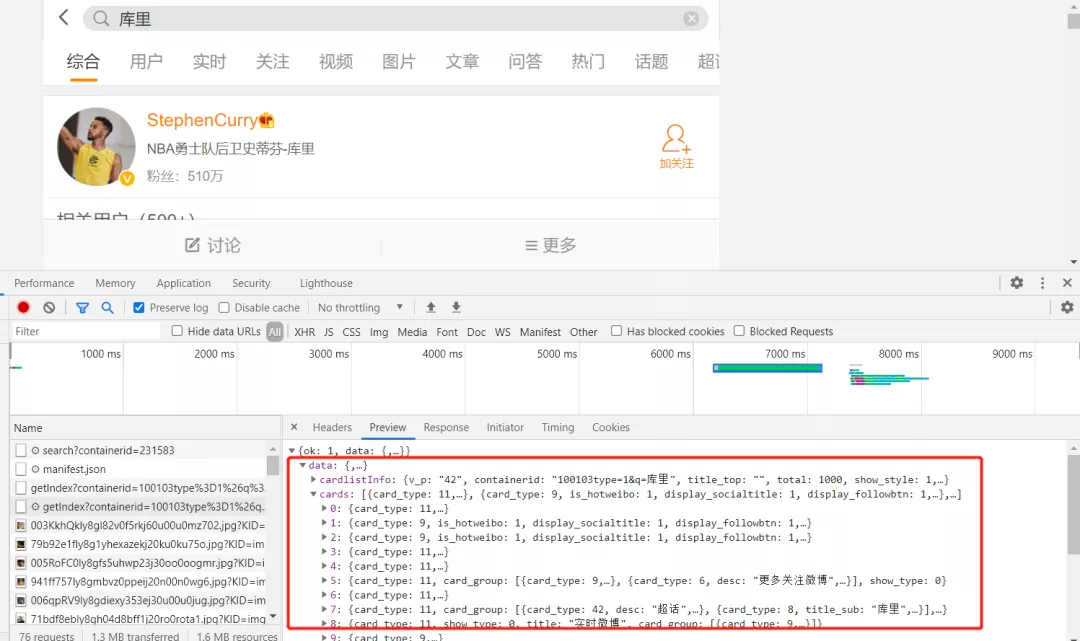
Now that we have found the real page of the data, we can carry out the normal operation of the crawler.
02 data acquisition
We have found the real web page of data storage above. Now we just need to make a request for the web page and extract the data.
1. Send request
By observing the request header, it is not difficult to construct the request code.
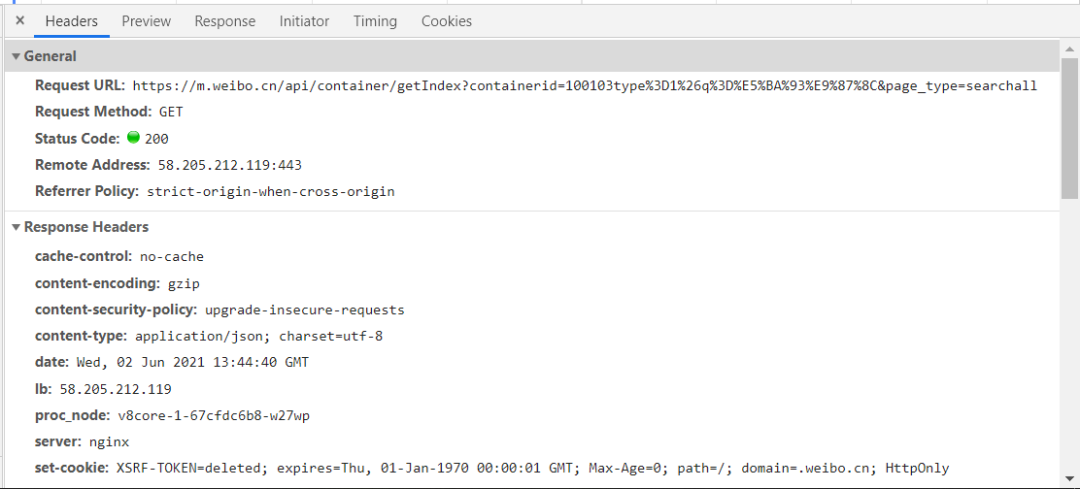
The construction code is as follows:
key = input("Please enter the crawling keyword:")
for page in range(1,10):
  params = (
      ('containerid', f'100103type=1&q={key}'),
      ('page_type', 'searchall'),
      ('page', str(page)),
  )

  response = requests.get('https://m.weibo.cn/api/container/getIndex', headers=headers, params=params)
2 analytical response
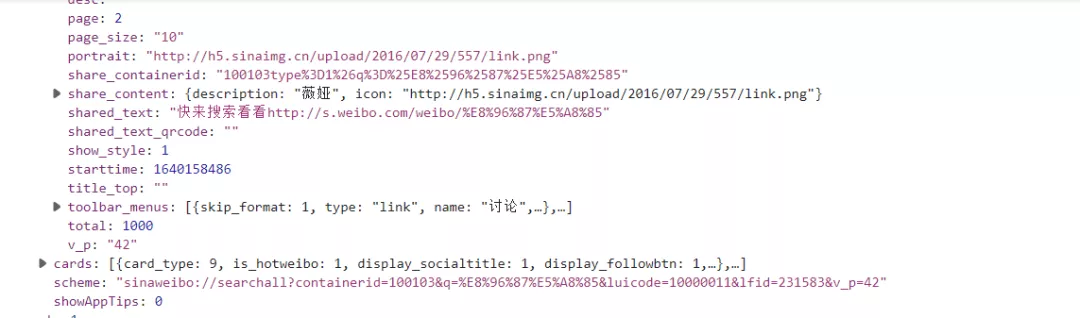
From the above observation, we found that this data can be transformed into a dictionary for crawling, but after my actual test, I found that regular extraction is the most simple and convenient, so here is the way of regular extraction. Interested readers can try to extract data by dictionary. The code is as follows:
r = response.text
title = re.findall('"page_title":"(.*?)"',r)
comments_count = re.findall('"comments_count":(.*?),',r)
attitudes_count = re.findall('"attitudes_count":(.*?),',r)
for i in range(len(title)):
  print(eval(f"'{title[i]}'"),comments_count[i],attitudes_count[i])
3. Store data
After the data has been parsed, we can store it directly. Here I store the data in a csv file. The code is as follows:
for i in range(len(title)):
   try:
       with open(f'{key}.csv', 'a', newline='') as f:
           writer = csv.writer(f)
           writer.writerow([eval(f"'{title[i]}'"),comments_count[i],attitudes_count[i],reposts_count[i],created_at[i].split()[-1],created_at[i].split()[1],created_at[i].split()[2],created_at[i].split()[0],created_at[i].split()[3]])
   except:
       pass
03 data cleaning
After data collection, it needs to be cleaned to meet the analysis requirements before visual analysis can be carried out.
1. Import data
Read the crawled data with pandas and preview it.
import pandas as pd

df = pd.read_csv('Weiya.csv',encoding='gbk')
print(df.head(10))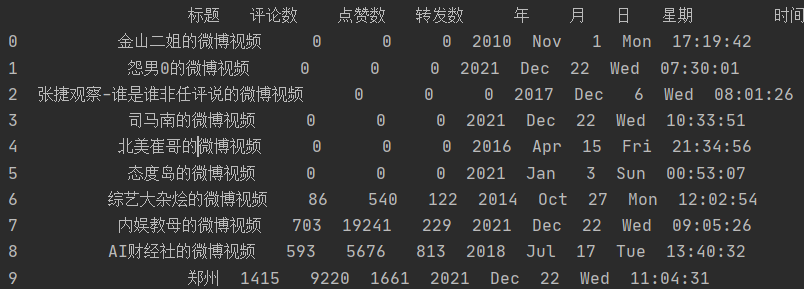
2 date conversion
We found that the data in the month is an English abbreviation, and we need to convert it into numbers. The code is as follows:
c = []
for i in list(df['month']):
   if i == 'Nov':
       c.append(11)
   elif i == 'Dec':
       c.append(12)
   elif i == 'Apr':
       c.append(4)
   elif i == 'Jan':
       c.append(1)
   elif i == 'Oct':
       c.append(10)
   else:
       c.append(7)
df['month'] = c
df.to_csv('Weiya.csv',encoding='gbk',index=False)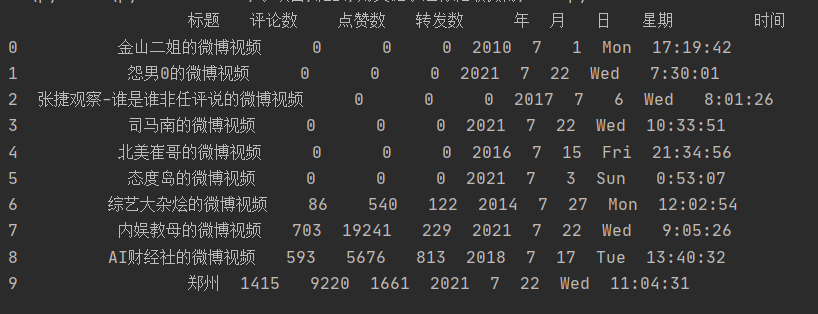
3 view data types
Check the field types and missing values, which meet the analysis needs and do not need to be handled separately.
df.info()

04 visual analysis
Let's make a visual analysis of these data.
1. Number of microblogs per day
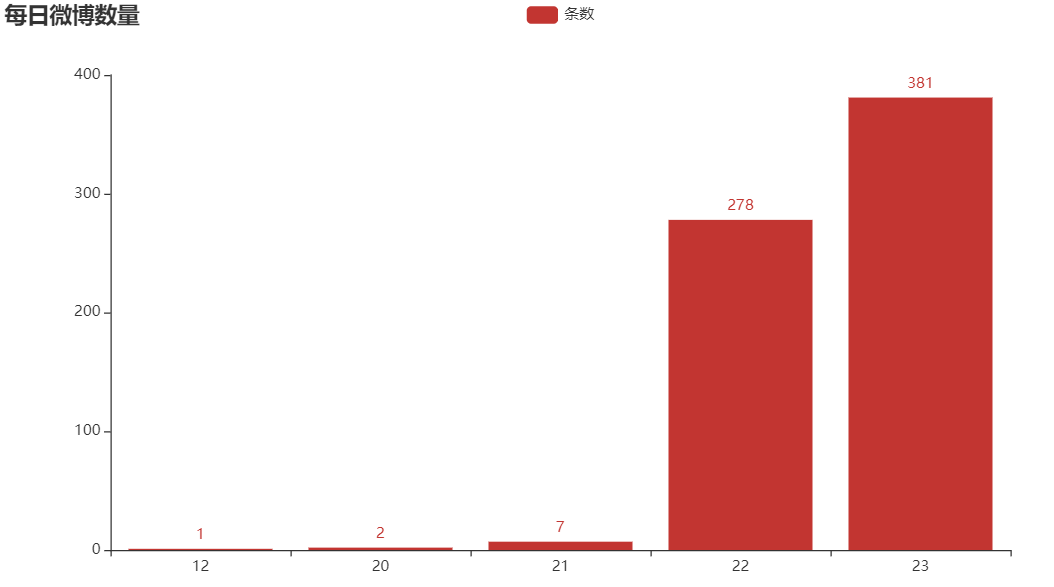
Only nearly 100 pages of data were crawled here, which may be the reason for the small amount of microblog data on the 20th and 21st.
The code is as follows:
from pyecharts.charts import Bar
from pyecharts import options as opts
from collections import Counter # Statistical word frequency
c=[]
d={}
a = 0
for i in list(df['month']):
    if i == 12:
        if list(df['day'])[a] notin c:
            c.append(list(df['day'])[a])
    a+=1
a = 0
for i in c:
    d[i]=0

for i in list(df['month']):
    if i == 12:
        d[list(df['day'])[a]]+=1
    a += 1
columns = []
data = []
for k,v in d.items():
    columns.append(k)
    data.append(v)
bar = (
        Bar()
        .add_xaxis(columns)
        .add_yaxis("Number of articles", data)
        .set_global_opts(title_opts=opts.TitleOpts(title="Daily number of microblogs"))
    )
bar.render("word frequency.html")
2 comment and praise top10
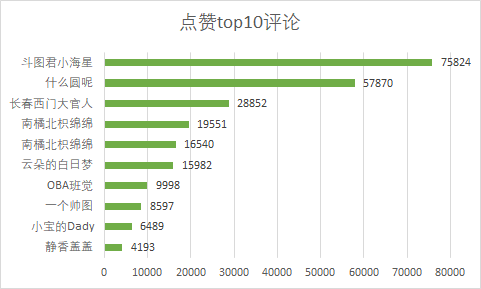
We found that doutujun little starfish has the most comments, with 7.5w +. Let's see what its comments are, which makes users like it so much.
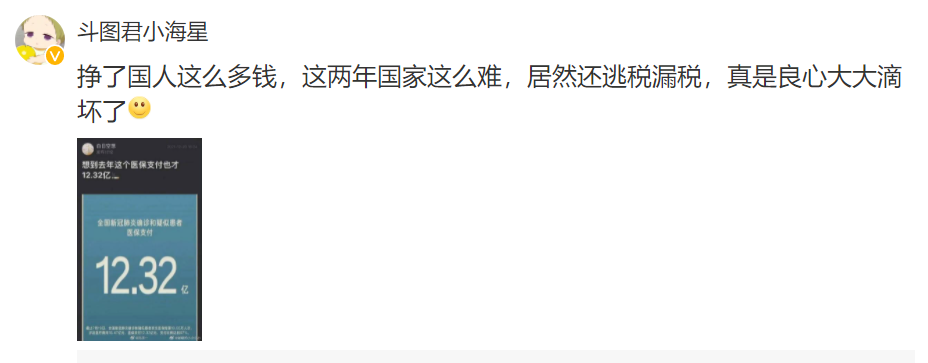
There are so many likes, which may be sent early and located in the front. Another reason may be that the content is in line with everyone's wishes.
3 comment time distribution
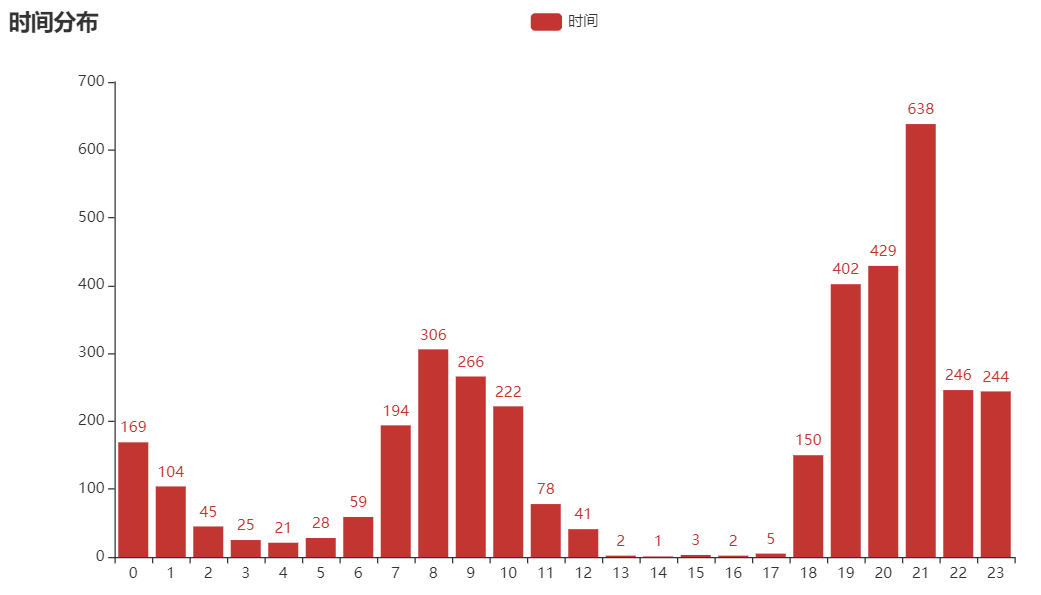
By analyzing the release time of all comments, we found that the largest number of comments were published at 21:00. At that time, it was almost the same time when it was on the hot search list. It seems that not on the hot search list still has a great impact on microblog.
The code is as follows:
import pandas as pd
df = pd.read_csv('weiya.csv',encoding='gbk')
c=[]
d={}
a = 0
for i in list(df['Time']):
    if i notin c:
        c.append(i)
a = 0
for i in c:
    d[i]=0

for i in list(df['Time']):
    d[i]+=1

print(d)
from collections import Counter # Statistical word frequency
from pyecharts.charts import Bar
from pyecharts import options as opts
columns = []
data = []
for k,v in d.items():
    columns.append(k)
    data.append(v)
bar = (
        Bar()
        .add_xaxis(columns)
        .add_yaxis("time", data)
        .set_global_opts(title_opts=opts.TitleOpts(title="Time distribution"))
    )
bar.render("word frequency.html")
4 word cloud
Through the word cloud picture, we can see that there are many key words of tax evasion, which is in line with the theme, followed by cancellation, ban and imprisonment. It seems that everyone still hates illegal acts.
The code is as follows:
from imageio import imread
import jieba
from wordcloud import WordCloud, STOPWORDS
with open("weiya.txt",encoding='utf-8') as f:
    job_title_1 = f.read()
with open('stop list .txt','r',encoding='utf-8') as f:
    stop_word = f.read()
word = jieba.cut(job_title_1)
words = []
for i in list(word):
    if i notin stop_word:
        words.append(i)
contents_list_job_title = " ".join(words)
wc = WordCloud(stopwords=STOPWORDS.add("One"), collocations=False,
               background_color="white",
               font_path=r"K:\Su Xinshi and Liu Kaijian.ttf",
               width=400, height=300, random_state=42,
               mask=imread('xin.jpg', pilmode="RGB")
               )
wc.generate(contents_list_job_title)
wc.to_file("Recommendation.png")
05 summary
As public figures, online celebrities and stars should set an example. They can't enjoy fame and wealth but also commit illegal acts.