When the requirements of an application are relatively simple, there may not be many operators involved in data conversion, but when the requirements of the application become more and more complex, the number of operators in a Job may reach dozens or even hundreds. With so many operators, the whole application will become very complex, So it would be convenient to know the Job execution plan at any time when writing Flink Job.
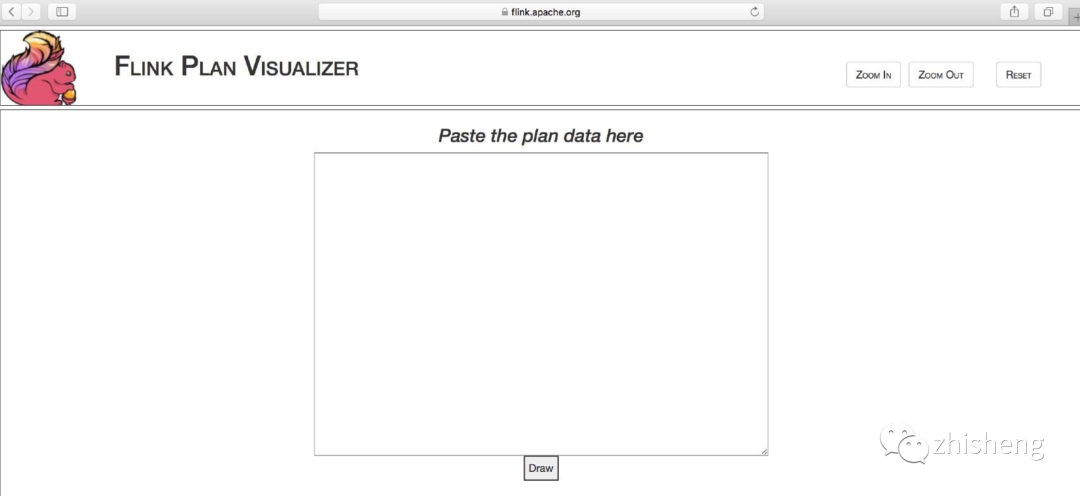
As it happens, Flink supports obtaining the execution plan of the whole Job. In addition, the official website of Flink also provides a visualization tool visualizer (which can draw the execution plan JSON into an execution diagram), as shown in the following figure.
How to get execution plan JSON?
Now that you know the tool to draw the execution plan JSON into a viewable execution diagram, how do you get the execution plan JSON? The method is very simple. You only need to add this line of code to the Main method of your Flink Job:
System.out.println(env.getExecutionPlan());
Then you can right-click Run on your Flink Job in the IDEA to view the JSON string of the execution plan from the printed log, such as the following:
{"nodes":[{"id":1,"type":"Source: Custom Source","pact":"Data Source","contents":"Source: Custom Source","parallelism":5},{"id":2,"type":"Sink: flink-connectors-kafka","pact":"Data Sink","contents":"Sink: flink-connectors-kafka","parallelism":5,"predecessors":[{"id":1,"ship_strategy":"FORWARD","side":"second"}]}]}
Run the JSON string of the printed execution plan in the IDEA, as shown in the following figure:
Generate execution plan diagram
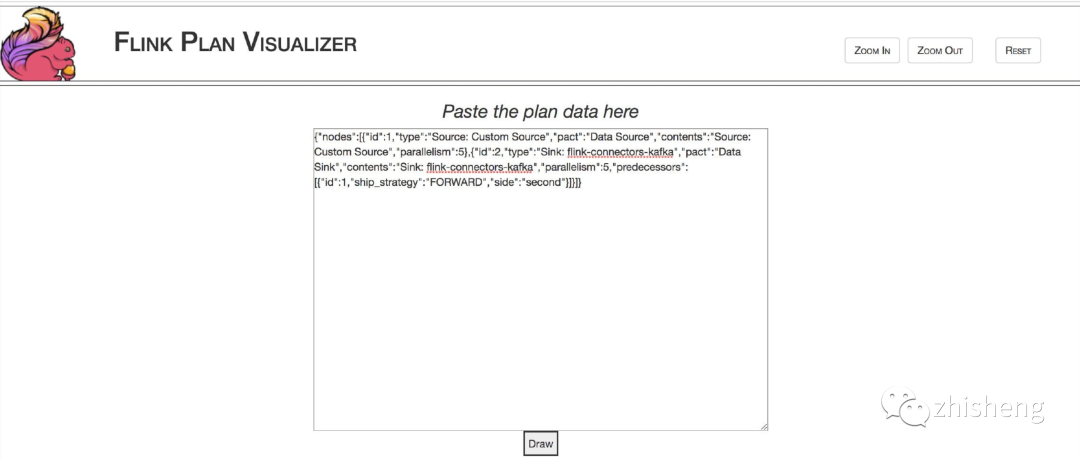
After obtaining the JSON of the execution plan, use the tool provided by Flink to draw the execution plan diagram, and copy and paste the obtained JSON string to the website just now, as shown in the figure below.
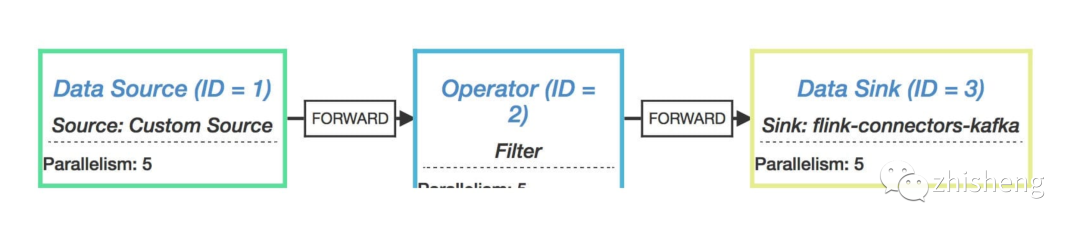
Click the icon above Draw Button, the execution flowchart shown in the following figure will be generated.
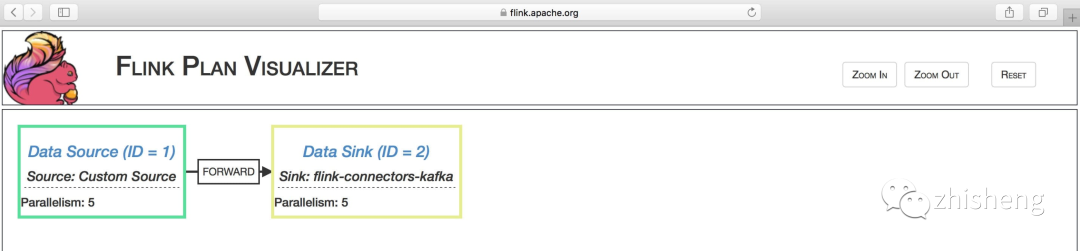
What can we see from the picture?
-
operator name: such as source and sink
-
Parallelism of each operator: for example, Parallelism: 5
-
Type of data distribution: such as FORWARD
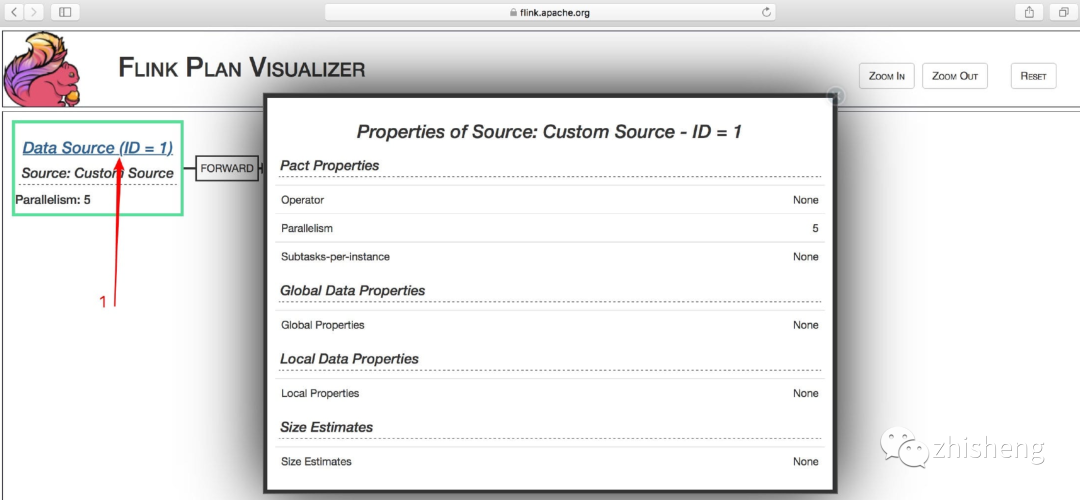
You can also click on the Data Source(ID = 1) See the details below:
As the demand increases, the number of possible operators will increase, so the execution plan will become more complex, as shown in the figure below.
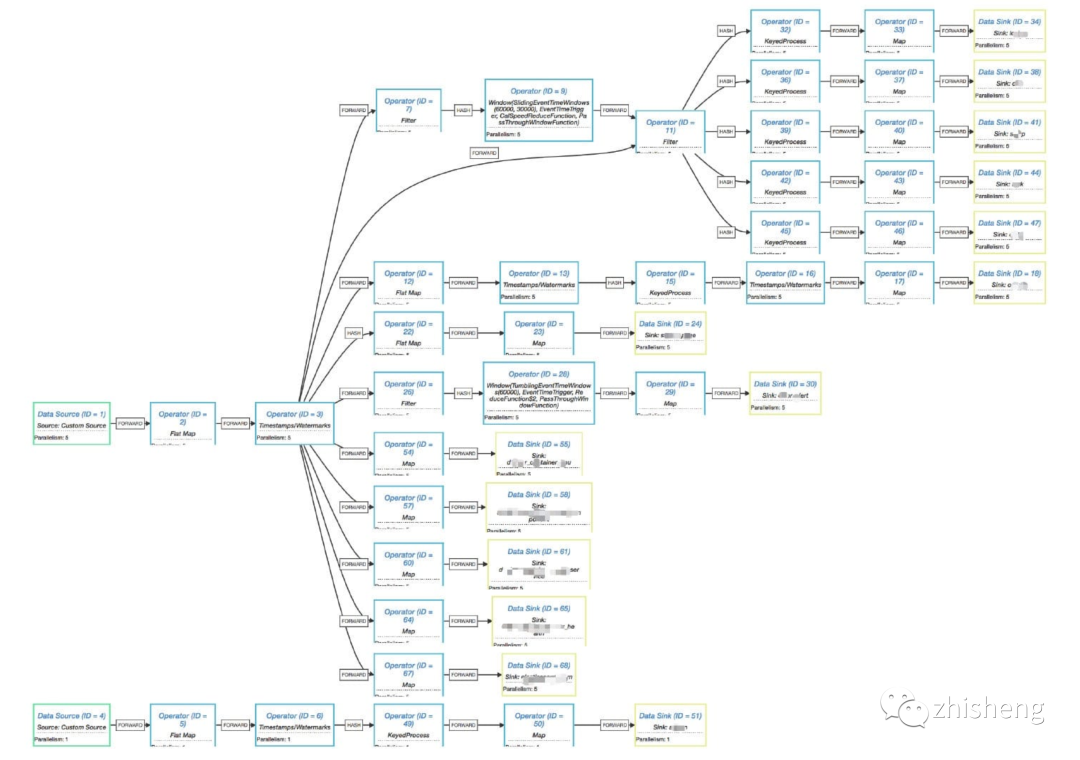
Is it a little complicated to see the above figure? I believe your business needs may be more complex than this. However, from this figure, we can see that there is one more data distribution type than the simple execution plan diagram above, namely HASH. But you may be curious to say: why is the Job "execution plan" I usually see from the Flink UI not like this?
Here, let's repeat this problem. We submit this slightly complex Flink Job to the Flink UI to see what its execution plan looks like on the UI? After submitting the Jar package, we don't run it. Directly click show plan. The results are shown in the figure below.

Let's run it again and check that the "execution plan diagram" displayed during operation is different, as shown in the following figure.

Explore Flink job execution plan
We can find that these two "execution plan Diagrams" are different from the execution plan diagrams generated by the visualizer tool provided on Flink's official website. A rough observation shows that the "execution plan chart" on the Flink UI has become more concise, and some operators have been combined, so it doesn't look so complex as a whole. In fact, this is an internal optimization of Flink. Let's take a look at the logic behind env.getExecutionPlan():
/**
 * Creates the plan with which the system will execute the program, and
 * returns it as a String using a JSON representation of the execution data
 * flow graph. Note that this needs to be called, before the plan is
 * executed.
 *
 * @return The execution plan of the program, as a JSON String.
 */
public String getExecutionPlan() {
 return getStreamGraph().getStreamingPlanAsJSON();
}
The general meaning of code comments is:
Create a program execution plan and return the JSON of the execution data flow diagram as a String. Please note that this method needs to be called before executing the plan.
The getExecutionPlan method has two steps:
1. Get the StreamGraph of the Job
On how to get the StreamGraph, the author wrote a source code analysis in my blog. How to get the StreamGraph?.
2. Convert StreamGraph to JSON
public String getStreamingPlanAsJSON() {
 try {
  return new JSONGenerator(this).getJSON();
 }
 catch (Exception e) {
  throw new RuntimeException("JSON plan creation failed", e);
 }
}
Following the getStreamingPlanAsJSON method, we saw that it constructed a JSONGenerator object (including reference StreamGraph) and then called getJSON method. Let's look at this method:
public String getJSON() {
 ObjectNode json = mapper.createObjectNode();
 ArrayNode nodes = mapper.createArrayNode();
 json.put("nodes", nodes);
 List<Integer> operatorIDs = new ArrayList<Integer>(streamGraph.getVertexIDs());
 Collections.sort(operatorIDs, new Comparator<Integer>() {
  @Override
  public int compare(Integer idOne, Integer idTwo) {
   boolean isIdOneSinkId = streamGraph.getSinkIDs().contains(idOne);
   boolean isIdTwoSinkId = streamGraph.getSinkIDs().contains(idTwo);
   // put sinks at the back
      ...
  }
 });
 visit(nodes, operatorIDs, new HashMap<Integer, Integer>());
 return json.toString();
}
At first, we construct external objects, and then call the visit method to continue constructing the internal objects. The visit method is as follows:
private void visit(ArrayNode jsonArray, List<Integer> toVisit,
  Map<Integer, Integer> edgeRemapings) {

 Integer vertexID = toVisit.get(0);
 StreamNode vertex = streamGraph.getStreamNode(vertexID);

 if (streamGraph.getSourceIDs().contains(vertexID)
   || Collections.disjoint(vertex.getInEdges(), toVisit)) {

  ObjectNode node = mapper.createObjectNode();
  decorateNode(vertexID, node);

  if (!streamGraph.getSourceIDs().contains(vertexID)) {
   ArrayNode inputs = mapper.createArrayNode();
   node.put(PREDECESSORS, inputs);

   for (StreamEdge inEdge : vertex.getInEdges()) {
    int inputID = inEdge.getSourceId();

    Integer mappedID = (edgeRemapings.keySet().contains(inputID)) ? edgeRemapings
      .get(inputID) : inputID;
    decorateEdge(inputs, inEdge, mappedID);
   }
  }
  jsonArray.add(node);
  toVisit.remove(vertexID);
 } else {
  Integer iterationHead = -1;
  for (StreamEdge inEdge : vertex.getInEdges()) {
   int operator = inEdge.getSourceId();

   if (streamGraph.vertexIDtoLoopTimeout.containsKey(operator)) {
    iterationHead = operator;
   }
  }

  ObjectNode obj = mapper.createObjectNode();
  ArrayNode iterationSteps = mapper.createArrayNode();
  obj.put(STEPS, iterationSteps);
  obj.put(ID, iterationHead);
  obj.put(PACT, "IterativeDataStream");
  obj.put(PARALLELISM, streamGraph.getStreamNode(iterationHead).getParallelism());
  obj.put(CONTENTS, "Stream Iteration");
  ArrayNode iterationInputs = mapper.createArrayNode();
  obj.put(PREDECESSORS, iterationInputs);
  toVisit.remove(iterationHead);
  visitIteration(iterationSteps, toVisit, iterationHead, edgeRemapings, iterationInputs);
  jsonArray.add(obj);
 }

 if (!toVisit.isEmpty()) {
  visit(jsonArray, toVisit, edgeRemapings);
 }
}
Finally, the StreamGraph is constructed into a JSON string and returned. In fact, the execution plan graph returned here is the StreamGraph of Flink Job. However, the "execution plan graph" we see on the Flink UI corresponds to the JobGraph in Flink. Similarly, the author also wrote an article on source code analysis - how to obtain the JobGraph?.
Conditions for linking operators in Flink
Internally, Flink will string multiple operators together and execute them as an operator chain. Each execution chain will be executed in an independent thread on TaskManager. This can not only reduce the number of threads and the resource consumption caused by thread switching, but also reduce the consumption caused by data transmission, serialization and deserialization between operators.
For example, take the StreamGraph JSON generated by a Flink Job (the parallelism of operators is set to 5) and render the execution flow chart as shown in the following figure.
The JobGraph submitted to the Flink UI is shown in the following figure.
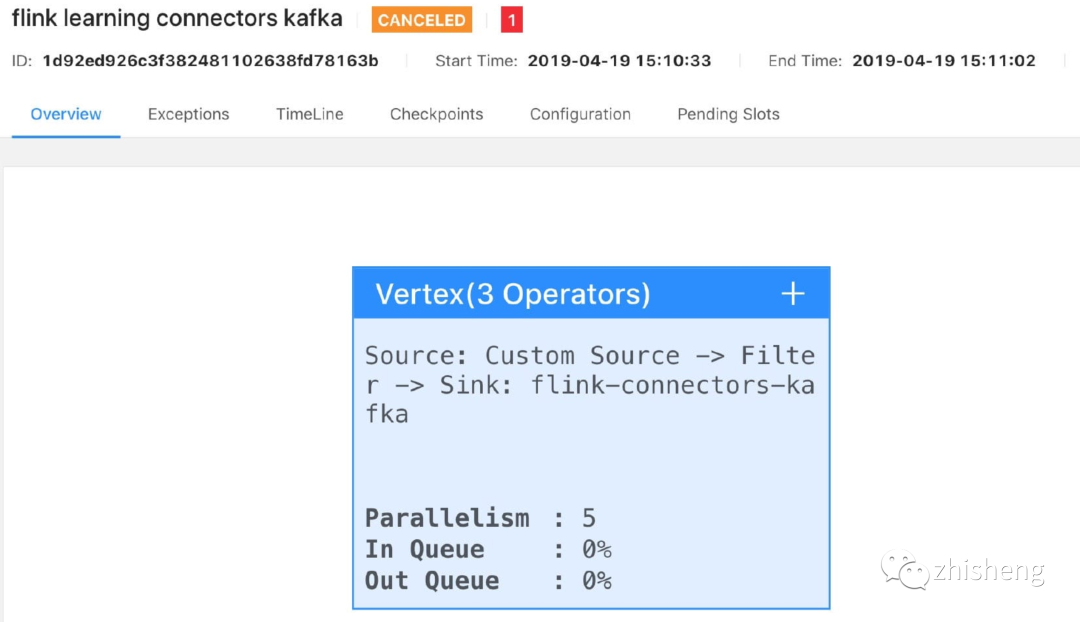
You can see that Flink internally strings three operators (source, filter and sink) into an execution chain. However, we modify the parallelism of the filter operator to 4, and we submit it to the Flink UI again. The effect is shown in the figure below.
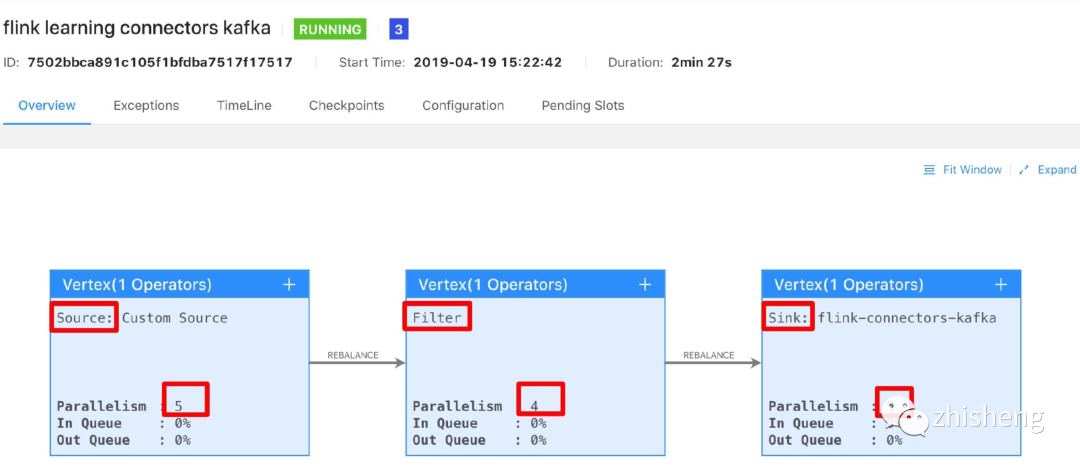
You will find that it is split into three. We continue to modify the parallelism of sink to 4. The effect after packaging and running is shown in the figure below.
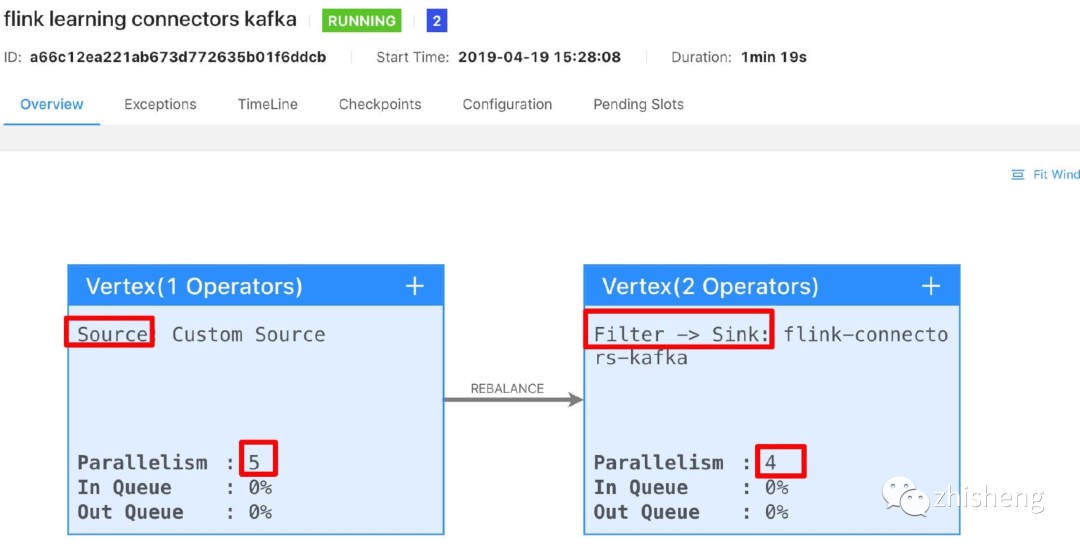
Magic no, it becomes two, and the filter and sink operators are concatenated and executed. After a simple test, we can find that if we want to string two different operators together, it is not so simple. Indeed, the conditions behind it are more complex. Here the author gives the source code, and those interested can read the source code alone.
public static boolean isChainable(StreamEdge edge, StreamGraph streamGraph) {
    //Gets the source and target StreamNode of StreamEdge
 StreamNode upStreamVertex = edge.getSourceVertex();
 StreamNode downStreamVertex = edge.getTargetVertex();

    //Gets the StreamOperator in the source and target StreamNode
 StreamOperator<?> headOperator = upStreamVertex.getOperator();
 StreamOperator<?> outOperator = downStreamVertex.getOperator();

 return downStreamVertex.getInEdges().size() == 1
   && outOperator != null
   && headOperator != null
   && upStreamVertex.isSameSlotSharingGroup(downStreamVertex)
   && outOperator.getChainingStrategy() == ChainingStrategy.ALWAYS
   && (headOperator.getChainingStrategy() == ChainingStrategy.HEAD ||
    headOperator.getChainingStrategy() == ChainingStrategy.ALWAYS)
   && (edge.getPartitioner() instanceof ForwardPartitioner)
   && upStreamVertex.getParallelism() == downStreamVertex.getParallelism()
   && streamGraph.isChainingEnabled();
}
From the return at the end of the source code, we can see that it has nine conditions:
-
The downstream node has only one input
-
The operator of the downstream node is not null
-
The operator of the upstream node is not null
-
Upstream and downstream nodes are in a slot sharing group. The default is default
-
The connection strategy of downstream nodes is ALWAYS (can be connected with upstream and downstream nodes)
-
The connection strategy of the upstream node is HEAD or ALWAYS
-
The partition function of edge is an instance of ForwardPartitioner (there is no operation such as keyby)
-
The parallelism of upstream and downstream nodes is equal
-
Allow node connection (default)
Therefore, seeing the above nine conditions, are you thinking that if our code can be written reasonably, it is possible to string different operators in an execution chain, which can improve the execution efficiency of the code.
How to disable Operator chain?
Many performance improvements can be obtained by chaining operators together. If you can, Flink will also default to chaining operators. What should you do if you want to prohibit chaining operators?
env.disableOperatorChaining()
The default execution diagram of word count program is shown in the following figure.
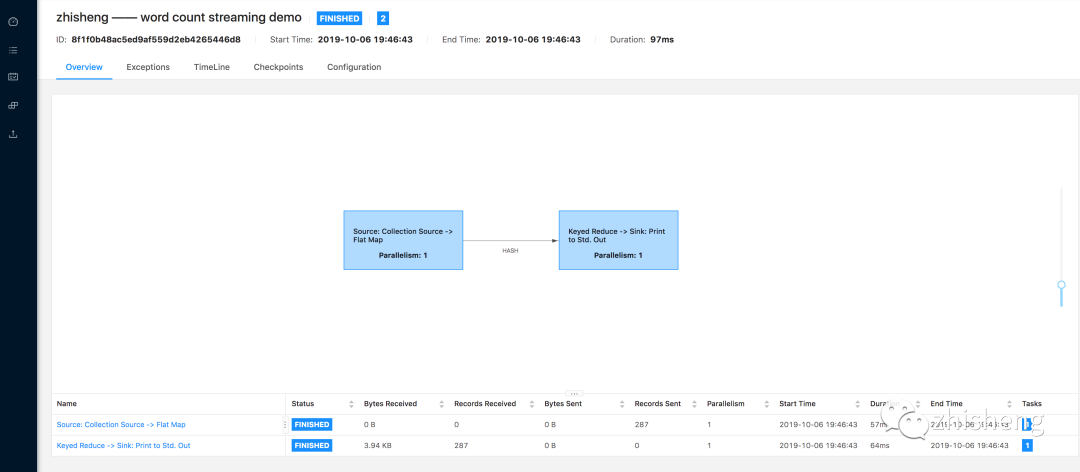
The execution diagram after setting forbidden chain is shown in the following figure.
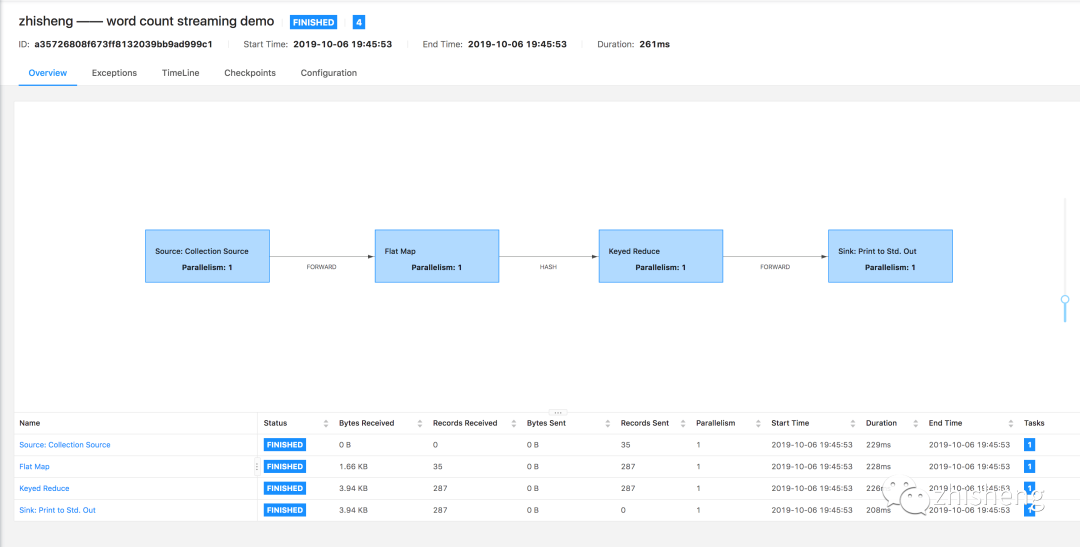
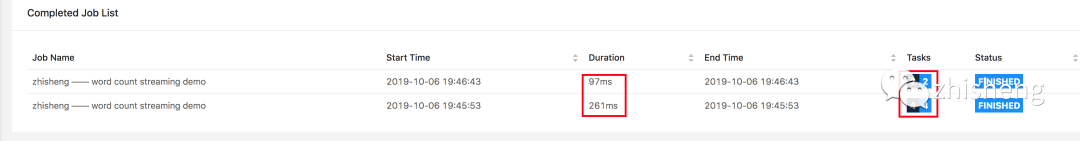
You can see that each operator in the execution diagram after setting the forbidden chain is isolated. In addition, you can see that after disabling the chain, the task s of the whole Job become more and the execution time of the whole Job takes longer. The results are shown in the following figure.
In addition to setting that global operators cannot be chained together, you can also set that an operator cannot be chained together separately. After the following settings, the flatMap operator will not be chained with the previous and subsequent operators.
dataStream.flatMap(...).disableChaining();
In addition, you can also set to open a new chain. In the following case, the flatMap and map operators will be chained together, but the filter operator will not be chained together.
dataStream.filter(...).flatMap(...).startNewChain().map(...);
In addition to the above, shared Slot groups can also be set. For example, if two separated operators are set to the same Slot sharing group, it will chain the two operators together, which can be used for Slot isolation. In the following case, the filter operator will be in the same Slot as the flatMap operator chain, and the map operator will be in another Slot. Note: in this case, the operator chain will not be performed until two adjacent operators set the same Slot sharing group. If it is a separated operator, even if the same Slot sharing group is set, the two operators will not be chained together.
dataStream.filter(...).slotSharingGroup("zhisheng").flatMap(...).slotSharingGroup("zhisheng").map(...).slotSharingGroup("zhisheng01");
Summary and reflection
This section analyzes the execution of the job by viewing the execution plan of the job, then analyzes the conditions for the job operator to chain, verifies it through the program demonstration, and finally explains how to prohibit the operator to chain.