On the production environment or other environments where GC problems are to be tested, the parameters for printing GC logs must be configured to facilitate the analysis of GC related problems.
However, many people may not be configured "Perfectly", either too little content is printed, or output to the console, or a large file is overwritten, or
This article takes you step by step to configure a perfect GC log printing strategy
print contents
In order to "print enough relevant information" on site, it is best to keep enough relevant information. And your program is really not bad at the performance that you consume when printing log I/O during GC
Print basic GC information
The first step in printing GC logs is to enable GC printing parameters, which are also the most basic parameters.
-XX:+PrintGCDetails -XX:+PrintGCDateStamps
Print object distribution
In order to analyze the promotion during GC and the high pause caused by promotion, do not look at the object age distribution log
-XX:+PrintTenuringDistribution
Example of output content:
Desired survivor size 59244544 bytes, new threshold 15 (max 15)
- age   1:     963176 bytes,     963176 total
- age   2:     791264 bytes,    1754440 total
- age   3:     210960 bytes,    1965400 total
- age   4:     167672 bytes,    2133072 total
- age   5:     172496 bytes,    2305568 total
- age   6:     107960 bytes,    2413528 total
- age   7:     205440 bytes,    2618968 total
- age   8:     185144 bytes,    2804112 total
- age   9:     195240 bytes,    2999352 total
- age  10:     169080 bytes,    3168432 total
- age  11:     114664 bytes,    3283096 total
- age  12:     168880 bytes,    3451976 total
- age  13:     167272 bytes,    3619248 total
- age  14:     387808 bytes,    4007056 total
- age  15:     168992 bytes,    4176048 total
Print heap data after GC
Each time a GC occurs, it is more intuitive to compare the heap memory before and after GC
-XX:+PrintHeapAtGC
Example of output content:
{Heap before GC invocations=0 (full 0):
 garbage-first heap   total 1024000K, used 324609K [0x0000000781800000, 0x0000000781901f40, 0x00000007c0000000)
  region size 1024K, 6 young (6144K), 0 survivors (0K)
 Metaspace       used 3420K, capacity 4500K, committed 4864K, reserved 1056768K
  class space    used 371K, capacity 388K, committed 512K, reserved 1048576K
Heap after GC invocations=1 (full 1):
 garbage-first heap   total 1024000K, used 21755K [0x0000000781800000, 0x0000000781901f40, 0x00000007c0000000)
  region size 1024K, 0 young (0K), 0 survivors (0K)
 Metaspace       used 3420K, capacity 4500K, committed 4864K, reserved 1056768K
  class space    used 371K, capacity 388K, committed 512K, reserved 1048576K
}
Print STW time
Pause time is the most important indicator of GC, which must not be less
-XX:+PrintGCApplicationStoppedTime
Example of output content:
Total time for which application threads were stopped: 0.0254260 seconds, Stopping threads took: 0.0000218 seconds
Print safepoint information
Before entering the STW stage, you need to find a suitable safepoint, which is also very important (not required. In case of GC problems, you'd better add this parameter for debugging)
-XX:+PrintSafepointStatistics -XX:PrintSafepointStatisticsCount=1
Example of output content:
         vmop                    [threads: total initially_running wait_to_block]    [time: spin block sync cleanup vmop] page_trap_count
0.371: ParallelGCFailedAllocation       [      10          0              0    ]      [     0     0     0     0     7    ]  0
Execute full gc...dataList has been promoted to cms old space
         vmop                    [threads: total initially_running wait_to_block]    [time: spin block sync cleanup vmop] page_trap_count
0.379: ParallelGCSystemGC               [      10          0              0    ]      [     0     0     0     0    16    ]  0
         vmop                    [threads: total initially_running wait_to_block]    [time: spin block sync cleanup vmop] page_trap_count
0.396: no vm operation                  [       9          1              1    ]      [     0     0     0     0   341    ]  0
Print Reference processing information
If there is any problem with the strong reference / weak reference / soft reference / virtual reference / finalize method, you should not print it out?
-XX:+PrintReferenceGC
Example of output content:
2021-02-19T12:41:30.462+0800: 5072726.605: [SoftReference, 0 refs, 0.0000521 secs]
2021-02-19T12:41:30.462+0800: 5072726.605: [WeakReference, 0 refs, 0.0000069 secs]
2021-02-19T12:41:30.462+0800: 5072726.605: [FinalReference, 0 refs, 0.0000056 secs]
2021-02-19T12:41:30.462+0800: 5072726.605: [PhantomReference, 0 refs, 0 refs, 0.0000059 secs]
2021-02-19T12:41:30.462+0800: 5072726.605: [JNI Weak Reference, 0.0000131 secs], 0.4635293 secs]
Complete parameters
# requireds
-XX:+PrintGCDetails
-XX:+PrintGCDateStamps
-XX:+PrintTenuringDistribution
-XX:+PrintHeapAtGC
-XX:+PrintReferenceGC
-XX:+PrintGCApplicationStoppedTime

# optional
-XX:+PrintSafepointStatistics
-XX:PrintSafepointStatisticsCount=1
Output mode
The above only defines the print content. By default, these logs will be output to the console (standard output). If your program log is also output to the console, the content of the log will be messy and troublesome to analyze. If you append (for example, catalina.out of tomcat is append), the file will become larger and larger, which will be fatal for analysis.
Therefore, we need a mechanism to split logs. This mechanism is provided by the JVM naturally.
Log segmentation of JVM
The JVM provides several parameters for splitting GC logs:
# File path of GC log output
-Xloggc:/path/to/gc.log
# Enable log file segmentation
-XX:+UseGCLogFileRotation
# Split up to several files, and write from scratch after exceeding
-XX:NumberOfGCLogFiles=14
# The upper limit size of each file is exceeded, and segmentation is triggered
-XX:GCLogFileSize=100M
According to this parameter, as long as each GC log exceeds 20M, it will be divided into up to 5 files, and the file names are GC log. 0,gc. log. 1,gc. log. 2,gc. log. 3,gc. log. 4, …
It seems beautiful. The problem of output file is solved in a few lines of configuration. But there are some problems with this approach:
- -The log file specified in Xloggc mode is written by overwriting. It will be overwritten every time it is started, and the historical log will be lost
- When the maximum number of partitions is exceeded, it will be rewritten from the 0th file and overwritten
- -20: Numberofglogfiles cannot be set to infinite
The problem of coverage is a little disgusting. The history log before starting coverage every time... Who can bear it?
Naming files using time stamps
So there is another solution. Instead of using the log segmentation function provided by the JVM, the log file is named with a timestamp every time it is started, so that different files can be used every time it is started, and the problem of overwriting will not occur.
# Use -% t as the log file name
-XX:+PrintGCDetails -XX:+PrintGCDateStamps -Xloggc:/path/to/gc-%t.log

# The generated file name is gc-2021-03-29_20-41-47.log
But is that perfect?
Although there is no coverage problem, due to the lack of log segmentation function, there is only one GC log file after each startup, and a single log file may be very huge. Too large log files are troublesome to analyze and must be divided.
Combination of the two
Here, we only need to adjust the strategy slightly and combine the JVM segmentation and timestamp naming schemes to get the best way.
# File path of GC log output
-Xloggc:/path/to/gc-%t.log
# Enable log file segmentation
-XX:+UseGCLogFileRotation
# Split up to several files, and write from scratch after exceeding
-XX:NumberOfGCLogFiles=14
# The upper limit size of each file is exceeded, and segmentation is triggered
-XX:GCLogFileSize=100M
Configure the GC log partition policy of the JVM while configuring the timestamp and GC log file name. In this way, it not only ensures that the GC file will not be overwritten, but also ensures that the size of a single GC file will not be too large, perfect!
The final log file name will look like this:
gc-2021-03-29_20-41-47.log.0
gc-2021-03-29_20-41-47.log.1
gc-2021-03-29_20-41-47.log.2
gc-2021-03-29_20-41-47.log.3
....
Best practices - full parameters
# necessary -XX:+PrintGCDetails -XX:+PrintGCDateStamps -XX:+PrintTenuringDistribution -XX:+PrintHeapAtGC -XX:+PrintReferenceGC -XX:+PrintGCApplicationStoppedTime # Optional -XX:+PrintSafepointStatistics -XX:PrintSafepointStatisticsCount=1 # File path of GC log output -Xloggc:/path/to/gc-%t.log # Enable log file segmentation -XX:+UseGCLogFileRotation # Split up to several files, and then write from the beginning -XX:NumberOfGCLogFiles=14 # The upper limit size of each file is exceeded, and segmentation is triggered -XX:GCLogFileSize=100M ### last **After years of accumulation, the following is an in-depth understanding of Xiaobian's summary and arrangement Java Virtual machine documents, hoping to help you pass the test and pass the interview smoothly.** As the whole document is relatively comprehensive and has a lot of content, the length is not allowed. It is shown in the form of screenshots below. If you need to get information and documents,[You can click here for free](https://docs.qq.com/doc/DSmxTbFJ1cmN1R2dB) 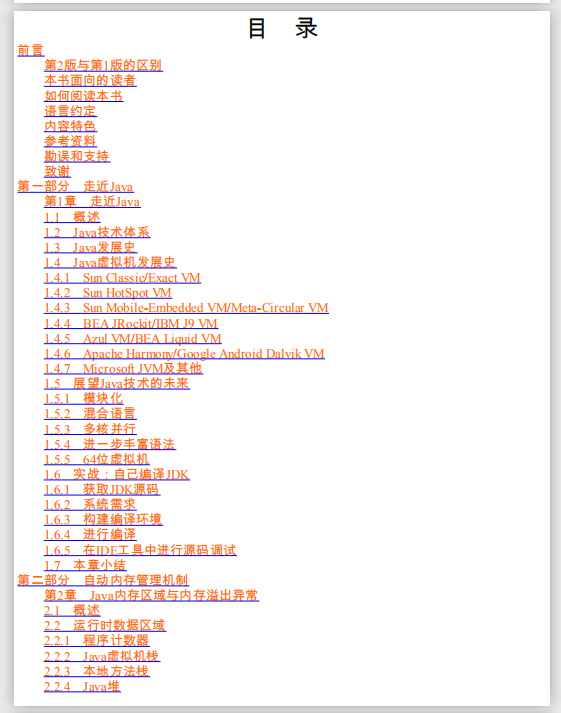 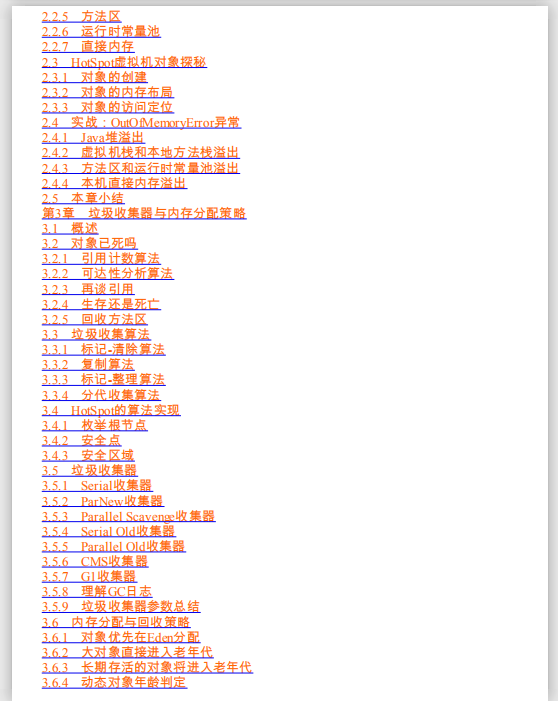 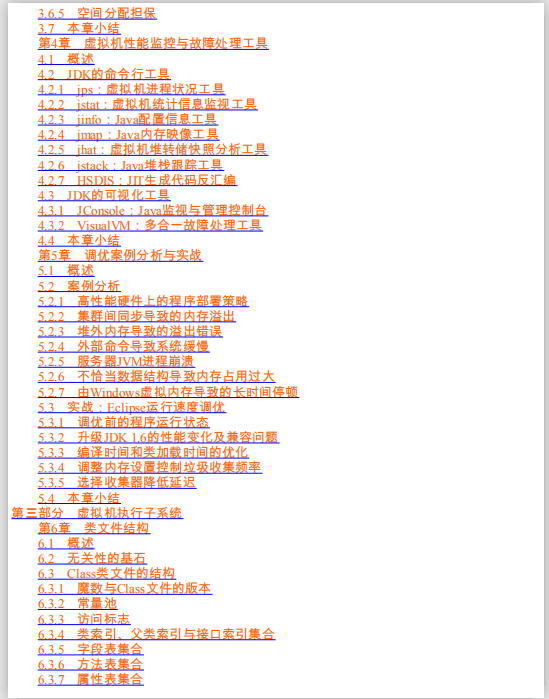 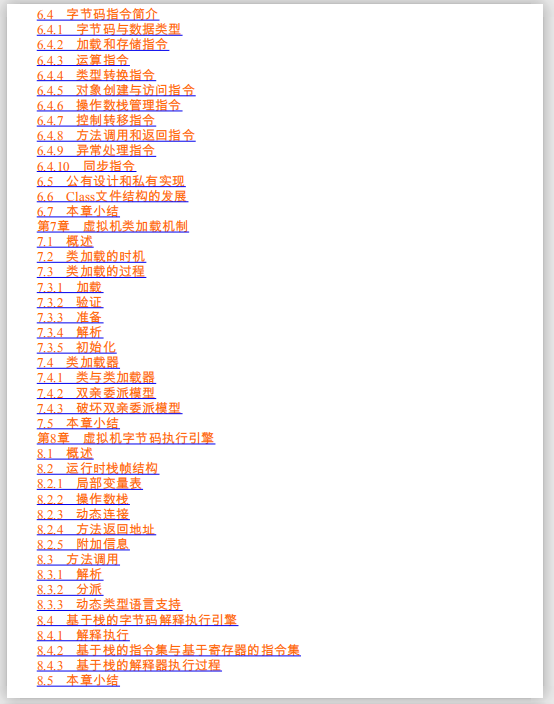 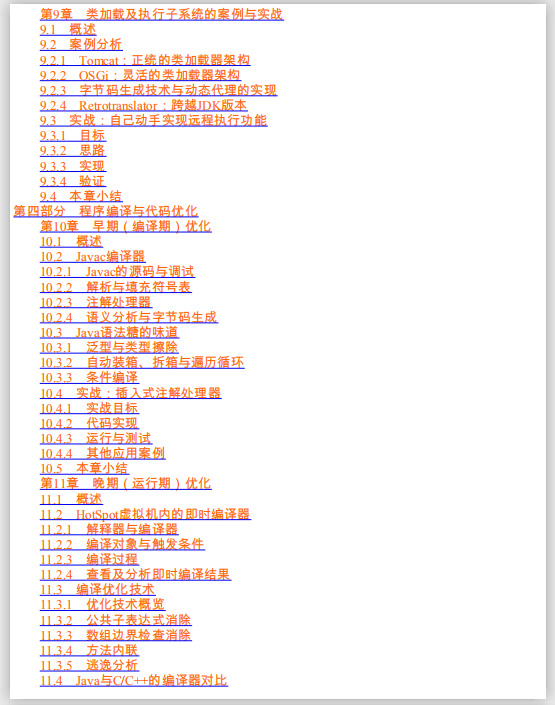 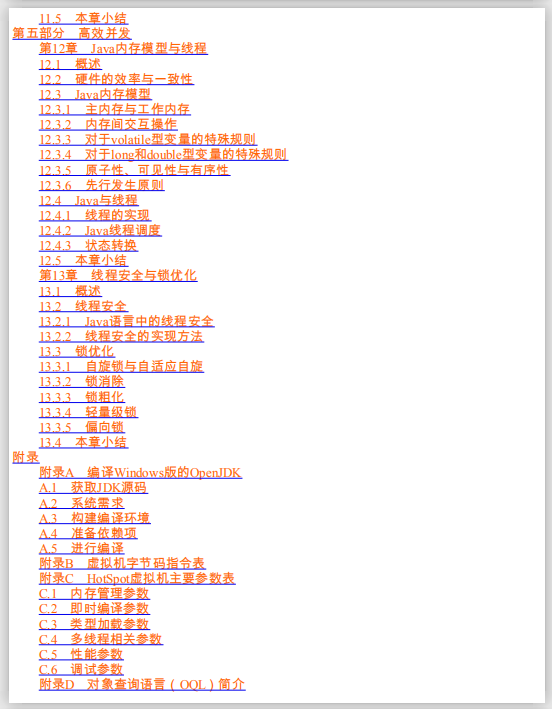  ] [External chain picture transfer...(img-SE2vtZh2-1623620366080)] [External chain picture transfer...(img-ODTPZG0T-1623620366081)] [External chain picture transfer...(img-KgjIGo2n-1623620366083)] [External chain picture transfer...(img-8vEr52x7-1623620366084)] [External chain picture transfer...(img-xwEeP61v-1623620366085)] **Due to space constraints, the detailed information of the document is too comprehensive and there are too many details, so only the screenshots of some knowledge points are roughly introduced. There are more detailed contents in each small node!**