
OOM means that there are vulnerabilities in the program, which may be caused by code or JVM parameter configuration. This article talks to readers about how to check after a Java process triggers OOM
It is often said that maintaining awe of the production environment and solving problems quickly is also an expression of awe
Why OOM?
The full name of OOM is "Out Of Memory", which means that the memory is exhausted. This error is thrown when the JVM does not have enough memory to allocate space for the object and the garbage collector has no space to recycle
Why OOM occurs is generally caused by these problems
- Too little allocation: the JVM initialization memory is small and the business uses a lot of memory; Or the memory allocation of different JVM regions is unreasonable
- Code vulnerability: an object is frequently applied for but not released after it is not used, resulting in memory depletion
Memory leak: the memory applied for use is not released, so that the virtual machine cannot use the memory again. At this time, this memory is leaked. Because the applicant doesn't use it and can't be assigned to others by virtual machines
Memory overflow: when the requested memory exceeds the memory size provided by the JVM, it is called overflow
Memory leaks persist and will eventually overflow. There is a causal relationship between the two
Common OOM
There are several common OOM types
java.lang.OutOfMemoryError: PermGen space
Java 7 permanent generation (method area) overflow, which is used to store class information, constants, static variables, code compiled by the real-time compiler and other data that have been loaded by the virtual machine. Whenever a class is loaded for the first time, the metadata will be stored in the permanent generation
It usually appears in a large number of Class objects or JSP pages, or it is caused by using CgLib dynamic proxy technology
We can modify the size of the method area through - XX: PermSize and - XX: MaxPermSize
Java8 changes the permanent generation to meta space, and an error is reported:
java.lang.OutOfMemoryError: Metadata space, insufficient meta space memory, dynamic expansion by default
java.lang.StackOverflowError
Virtual machine stack overflow is generally caused by dead loop or deep recursive call in the program. If the stack size is set too small, overflow will also occur. You can set the stack size through - Xss
The virtual machine throws a stack overflow error. You can locate the wrong class and method in the log
java.lang.OutOfMemoryError: Java heap space
Java heap memory overflow. The overflow is generally caused by unreasonable JVM heap memory setting or memory leakage
If it is a memory leak, you can view the reference chain from the leaked object to GC Roots through the tool. By mastering the type information of the leaked object and the reference chain information of GC Roots, you can accurately locate the location of the leaked code
If there is no memory leak, that is, the objects in memory must still exist, you should check the heap parameters (- Xmx and - Xms) of the virtual machine to see if you can increase the memory of the virtual machine
Summary: the overflow scenarios of the method area and virtual machine stack are not discussed too much in this article. The following mainly explains the common OOM troubleshooting ideas of Java heap space
View JVM memory distribution
Suppose that the PID of our Java application is 15162, enter the command to view the JVM memory distribution jmap -heap 15162
[xxx@xxx ~]# jmap -heap 15162
Attaching to process ID 15162, please wait...
Debugger attached successfully.
Server compiler detected.
JVM version is 25.161-b12

using thread-local object allocation.
Mark Sweep Compact GC

Heap Configuration:
   MinHeapFreeRatio         = 40 # Minimum heap usage ratio
   MaxHeapFreeRatio         = 70 # Maximum heap usable ratio
   MaxHeapSize              = 482344960 (460.0MB) # Maximum heap space size
   NewSize                  = 10485760 (10.0MB) # Cenozoic allocation size
   MaxNewSize               = 160759808 (153.3125MB) # Maximum Cenozoic allocable size
   OldSize                  = 20971520 (20.0MB) # Old age size
   NewRatio                 = 2 # Cenozoic proportion
   SurvivorRatio            = 8 # Cenozoic to Survivor ratio
   MetaspaceSize            = 21807104 (20.796875MB) # Meta space size
   CompressedClassSpaceSize = 1073741824 (1024.0MB) # Compressed Class Space size limit
   MaxMetaspaceSize         = 17592186044415 MB # Maximum meta space size
   G1HeapRegionSize         = 0 (0.0MB) # G1 single Region size

Heap Usage:  # Heap usage
New Generation (Eden + 1 Survivor Space): # Cenozoic era
   capacity = 9502720 (9.0625MB) # Total Cenozoic capacity
   used     = 4995320 (4.763908386230469MB) # The Cenozoic has been used
   free     = 4507400 (4.298591613769531MB) # Cenozoic residual capacity
   52.56726495150862% used # Proportion of Cenozoic use
Eden Space:
   capacity = 8454144 (8.0625MB) # Total capacity of Eden District
   used     = 4029752 (3.8430709838867188MB) # Eden zone used
   free     = 4424392 (4.219429016113281MB) # Remaining capacity of Eden area
   47.665996699370154% used  # Percentage of Eden District
From Space: # Memory distribution of one Survivor area
   capacity = 1048576 (1.0MB)
   used     = 965568 (0.92083740234375MB)
   free     = 83008 (0.07916259765625MB)
   92.083740234375% used
To Space: # Memory distribution of another Survivor area
   capacity = 1048576 (1.0MB)
   used     = 0 (0.0MB)
   free     = 1048576 (1.0MB)
   0.0% used
tenured generation: # Old age
   capacity = 20971520 (20.0MB)
   used     = 10611384 (10.119804382324219MB)
   free     = 10360136 (9.880195617675781MB)
   50.599021911621094% used

10730 interned Strings occupying 906232 bytes.
By checking the JVM memory allocation and runtime usage, you can judge whether the memory allocation is reasonable
In addition, you can view the most resource consuming object at JVM runtime, jmap -histo:live 15162 | more
The list of JVM memory objects is sorted by the amount of memory the objects occupy
- Instances: number of instances
- bytes: unit: byte
- Class name: class name
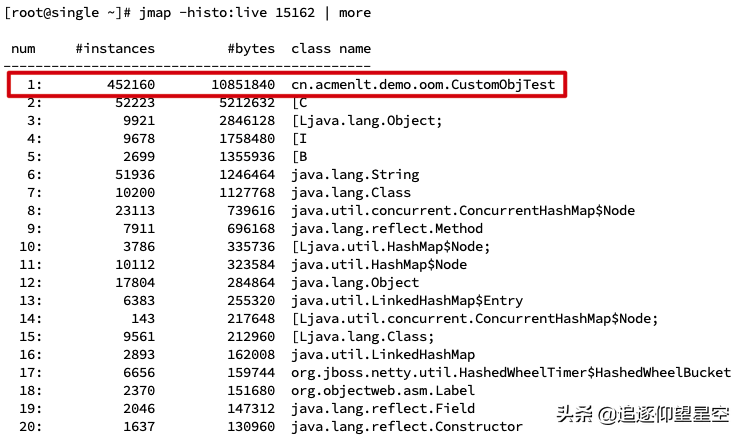
It is obvious that the CustomObjTest object instance and memory consumption are too high
Unfortunately, the scheme has limitations, because it can only check the problem that the object occupies too much memory
Where "[" represents an array, for example "[C" represents a Char array and "[B" represents a Byte array. If the array memory takes up too much, we don't know which objects hold it, so Dump memory is required for offline analysis
jmap -histo:live when this command is executed, the JVM will trigger GC first and then make statistics
Dump file analysis
Dump file is the memory image of Java process, which mainly includes system information, virtual machine properties, complete thread dump, status of all classes and objects, etc
When a memory overflow or GC exception occurs in the program, it is suspected that the JVM has a memory leak. At this time, we can export the Dump file for analysis
Add the following parameters to the JVM startup parameter configuration
- -XX:+HeapDumpOnOutOfMemoryError
- -XX:HeapDumpPath=./ (the parameter is the Dump file generation path)
When an OOM exception occurs in the JVM, the Dump file is automatically exported. The default format of the file name is java_pid{pid}.hprof
The above configuration is to automatically export Dump after the application throws OOM, or the Dump file can be exported when the JVM runs
jmap -dump:file=[File path] [pid]

# Example
jmap -dump:file=./jvmdump.hprof 15162
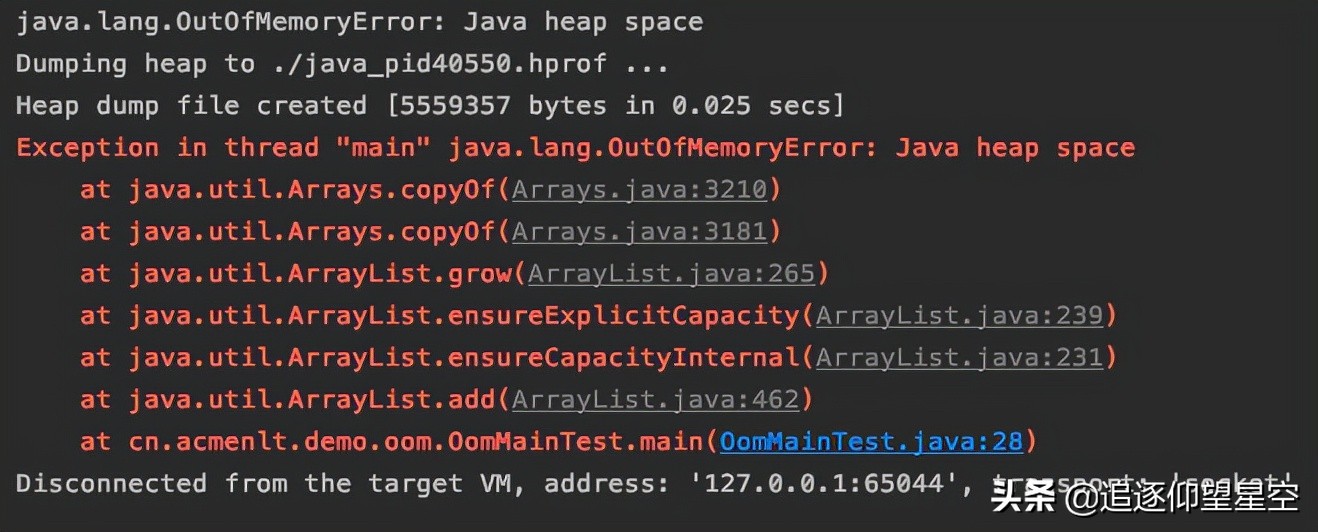
Write a test code locally, verify the OOM and analyze the Dump file
Set VM parameters: - Xms3m -Xmx3m -XX:+
HeapDumpOnOutOfMemoryError -XX:HeapDumpPath=./
public static void main(String[] args) {
    List<Object> oomList = Lists.newArrayList();
  	// Create objects in an infinite loop
    while (true) {
        oomList.add(new Object());
    }
}
It is known from the error message that java heap space indicates that OOM occurs in the heap area, and the hprof binary file is generated in the current folder
JVM analysis
There are many Dump analysis tools. Relatively speaking, jvisual VM, jpprofiler and Eclipse Mat are used by more people. The Dump file is analyzed with jvisual VM as an example
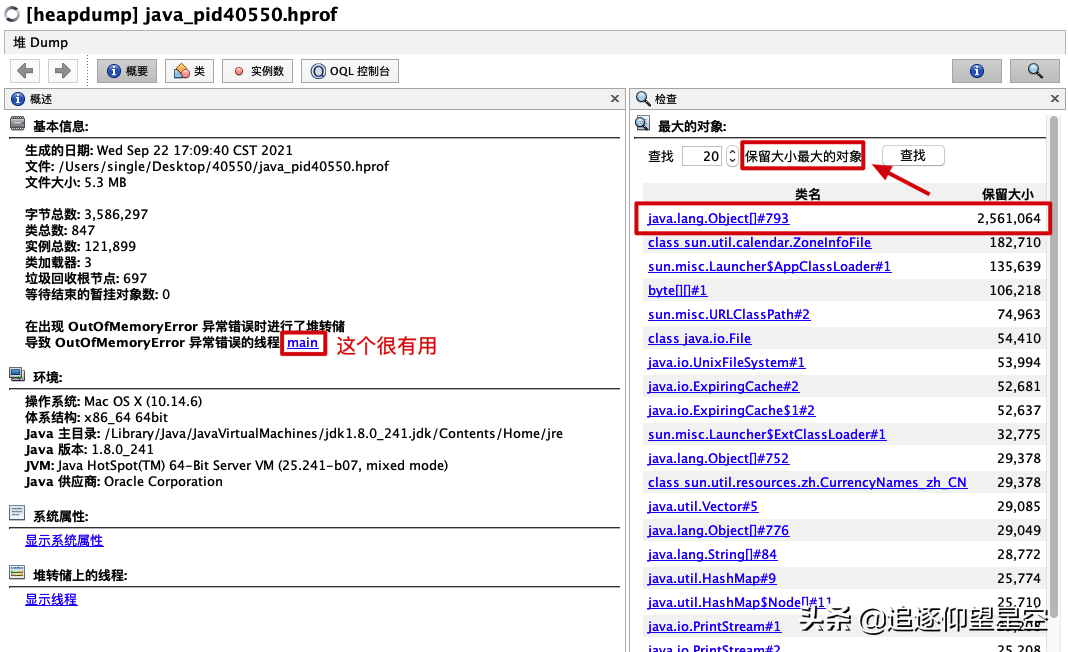
Two common functions are listed. The first is to see the thread stack that triggers OOM and clearly know the cause of program overflow
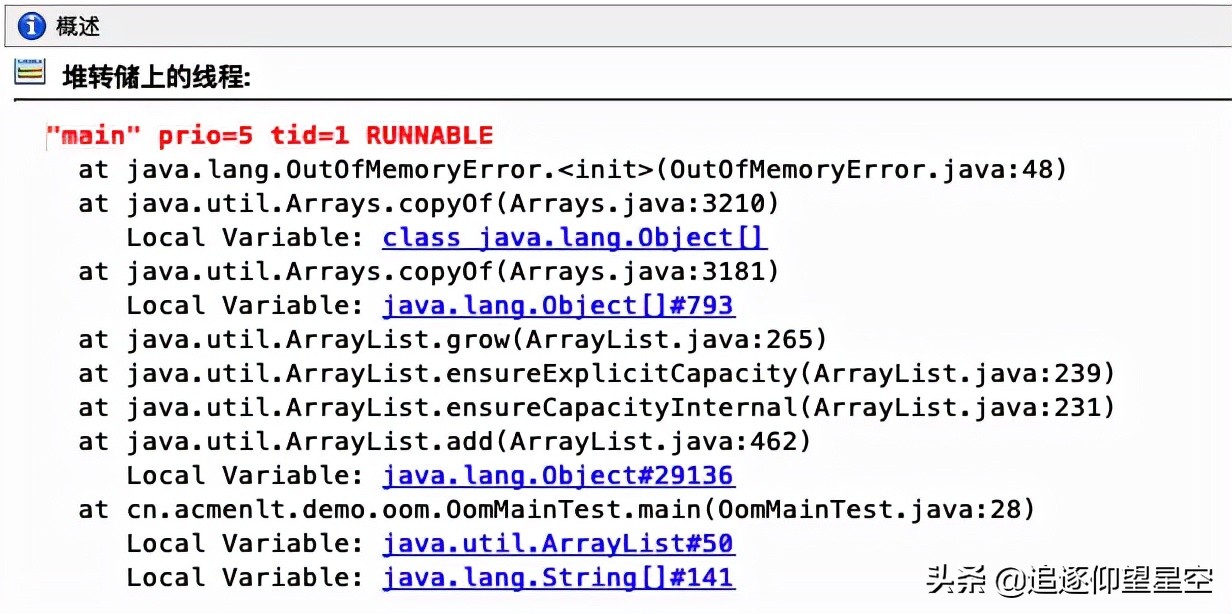
The second is to view the objects with the largest reserved size in the JVM memory, and you can choose the number of objects to check freely
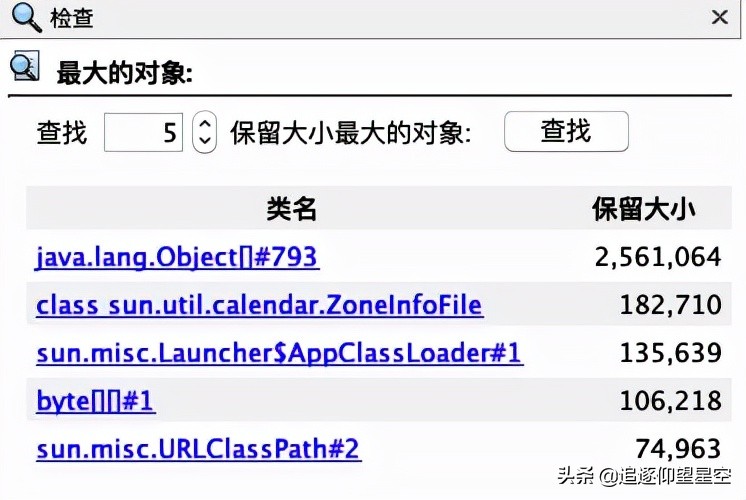
Click the object to jump to the specific object reference details page
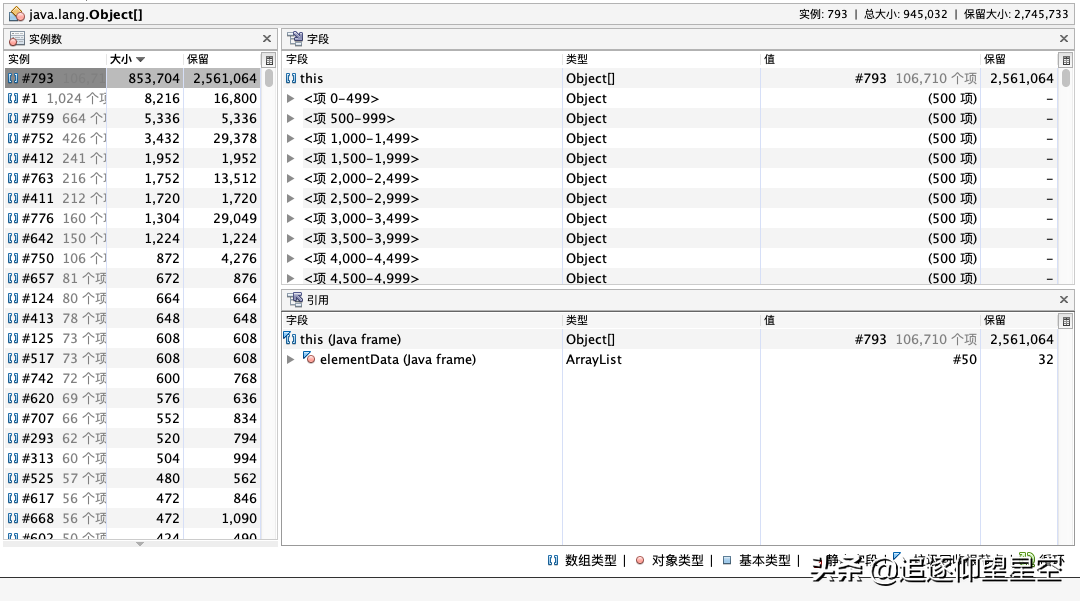
The Dump file in this paper is relatively simple, and there are various reasons for errors in the formal environment, so the Dump file will not be deeply parsed
Note: if JvisualVM analyzes a large Dump file, it may be unable to open it because of insufficient memory, and the default memory needs to be adjusted
Summary review
If you encounter JVM memory overflow online, you can check it in the following steps
- jmap -heap to see if the memory allocation is too small
- jmap -histo to see if there is an obvious over allocation of objects and no release
- jmap -dump exports the current memory snapshot of the JVM, and uses tools such as JDK or MAT to analyze the snapshot
If the above problem cannot be located, you need to check whether the application is constantly creating resources, such as network connections or threads, which may lead to the depletion of system resources