Implementation of echarts nested pie chart linkage
Effect explanation: when clicking the internal pie chart, the external pie chart will follow the internal selected pie chart
Design sketch: 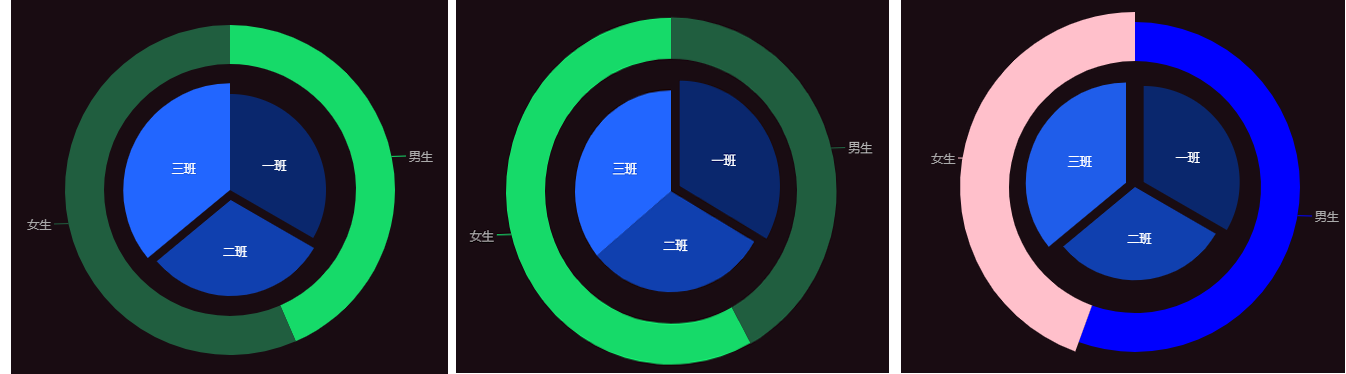
Code:
<html>
<head>
<title>Nested pie linkage</title>
</head>
<script type="text/javascript" src="js/echarts.min.js"></script>
<body>
<div id="_top" style="width:600px;height: 600px;"></div>
</body>
<script type="text/javascript">
var myecharts = echarts.init(document.getElementById('_top'));
var option={
legend: { //Legend
show:false, //Show legend or not
orient: 'vertical', //Layout direction
x: 'left', //Legend relative position
data:['Class one','Class two','Class three'] //Legend content
},
series: [ //content
{
name:'Proportion of class size', //Content headings
type:'pie', //Icon style
selectedMode: 'single', //Selection mode: single selection
radius: [0, '32%'], //Pie size, [x,y]:x represents inner radius, Y represents outer radius
label: { //Label
normal: {
position: 'inner' //Label location: inside
}
},
labelLine: { //prompt box
normal: {
show: false //Whether to display
}
},
color:['#0A276D','#1040AF','#1F5DEA','#628CF0'], //colour
name:['Class one','Class two','Class three'], //Content name
data:[ //data
{value:50,name:'Class one',selected:true}, //Selected: selected or not
{value:46,name:'Class two'},
{value:54,name:'Class three'},
],
},
{
name:'Male to female ratio',
type:'pie',
radius: ['42%', '55%'],
label: {
normal: {
}
},
labelLine:{
normal:{
length:2,
}
},
color:['#205E3F','#16DA69','red'],
data:[
{value:21,name:'Schoolboy'},
{value:29,name:'Girl student'},
],
label:
{
normal: {
textStyle: {
color: '#aaa' //Prompt box font color
}
}
},
}],
backgroundColor: "#190c12", //background color
};
myecharts.setOption(option);
//Nested pie linkage
function eConsole(param) {
if (typeof param.seriesIndex != 'undefined') {
if (param.type == 'click') { //Judge event type: Click
//Write method 1: get the number of pie chart scattered areas, and get them according to the legend
var peiLenght= option.legend.data.length;
//Write method 2: get the number of pie chart scattered areas, and get them according to the data in series
//var peiLenght= option.series[0].data.length;
for(var i=0;i<peiLenght;i++){
//seriesIndex==0: select inner ring pie chart; param.dataIndex==i: scatter
if(param.seriesIndex==0&¶m.dataIndex==i){
if(i==0){
var option_1 = myecharts.getOption();
option_1.series[1].name='Proportion of men and women in class 1';
option_1.series[1].color=['#205E3F','#16DA69','red'],
option_1.series[1].data=[
{value:21,name:'Schoolboy'},
{value:29,name:'Girl student'},
];
myecharts.setOption(option_1);
}else if(i==1){
var option_2 = myecharts.getOption();
option_2.series[1].name='Proportion of men and women in class 2';
option_2.series[1].color=['#16DA69','#205E3F','red'],
option_2.series[1].data=[
{value:20,name:'Schoolboy'},
{value:26,name:'Girl student'},
];
myecharts.setOption(option_2);
}else if(i==2){
var option_3 = myecharts.getOption();
option_3.series[1].name='Proportion of men and women in class 3';
option_3.series[1].color=['blue','pink','red'],
option_3.series[1].data=[
{value:30,name:'Schoolboy'},
{value:24,name:'Girl student'},
];
myecharts.setOption(option_3);
}
}
}
}
}
}
myecharts.on("click", eConsole);
</script>
</html>Analysis:
The principle of nested pie chart linkage: two pie charts are formed due to the size control of inner and outer radius, and then the two pie charts are assigned different values to achieve the effect of nesting. Then, the internal pie chart is monitored for click event. After the pie chart scatter area is clicked, the external pie chart is relatively changed to achieve the linkage effect of inner and outer pie charts