Hierarchical clustering algorithm
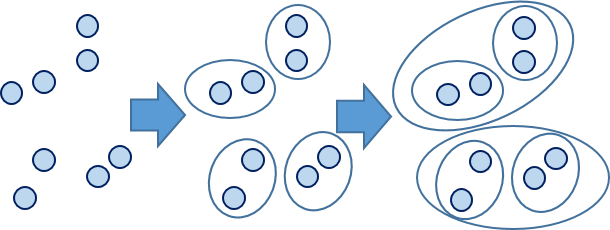
As the name suggests, hierarchical clustering is clustering layer by layer. Large clusters can be divided from top to bottom, which is called splitting method; It can also aggregate small categories from bottom to top, which is called condensation method; However, the bottom-up condensation method is commonly used.
Split method:
Splitting method means that all samples are classified into a cluster at the beginning, and then split gradually according to some criteria until a certain condition or a set number of classifications are reached. Describe with algorithm:
Input: sample set D, number of clusters or a certain condition (generally the threshold of sample distance, so the number of clusters can not be set)
Output: clustering results
1.Classify all samples in the sample set into a class cluster;
repeat:
    2.In the same class cluster (counted as c)Calculate the distance between two samples and find the two samples with the furthest distance a,b;
    3.Sample a,b Assign to different class clusters c1 and c2 Medium;
    4.Computing primitive clusters( c)Other remaining sample points and a,b Distance, if dis(a)<dis(b),Then the sample points are assigned to c1 In, otherwise it belongs to c2 Medium;
util:  The number of clusters or set conditions are reached
Coagulation method:
The aggregation method refers to treating each sample point as a class cluster initially, so the size of the original class cluster is equal to the number of sample points, and then merging these initial class clusters according to some criteria until certain conditions or the set number of classifications are reached. Describe with the algorithm:
Input: sample set D, number of clusters or a certain condition (generally the threshold of sample distance, so the number of clusters can not be set)
Output: clustering results
  1.All the sample points in the sample set are regarded as an independent class cluster;
   repeat:
        2.Calculate the distance between two classes of clusters (described later) and find the two classes of clusters with the smallest distance c1 and c2;
        3.Merge class cluster c1 and c2 Is a class cluster;
   util:  The number of clusters or set conditions are reached
Example:
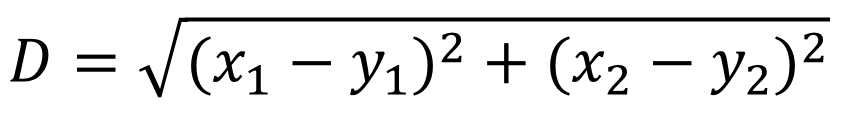
Calculation formula of Euclidean distance
There are many methods to calculate the distance between clusters:
(1) That is, the distance between the nearest two samples in the two classes is taken as the distance between the two sets, that is, the smaller the distance between the nearest two samples, the greater the similarity between the two classes
(2) The distance between the two farthest points in the two sets is taken as the distance between the two sets
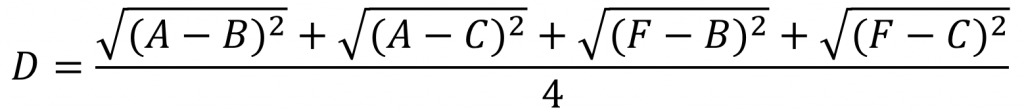
(3) Put all the distances between the two points in the two sets together to find an average value, and you can get a better result.
e.g. the following is the calculation of the distance from the combined data point (A,F) to (B,C). Here, the mean values of the distances between (A,F) and (B,C) are calculated respectively.
(4) Taking the median value of pairwise distance is more able to eliminate the interference of individual deviation samples on the results than taking the mean value.
(5) Find the center point of each set (that is, a vector obtained by adding the corresponding dimensions of all elements in the set and then dividing by the number of elements), then replace the set with the center point, and then calculate the distance between the sets
Next, it is simply implemented with the world bank sample data set. The data set is stored in a CSV file named WBClust2013.csv in a standard format. It has 80 rows of data and 14 variables. data sources
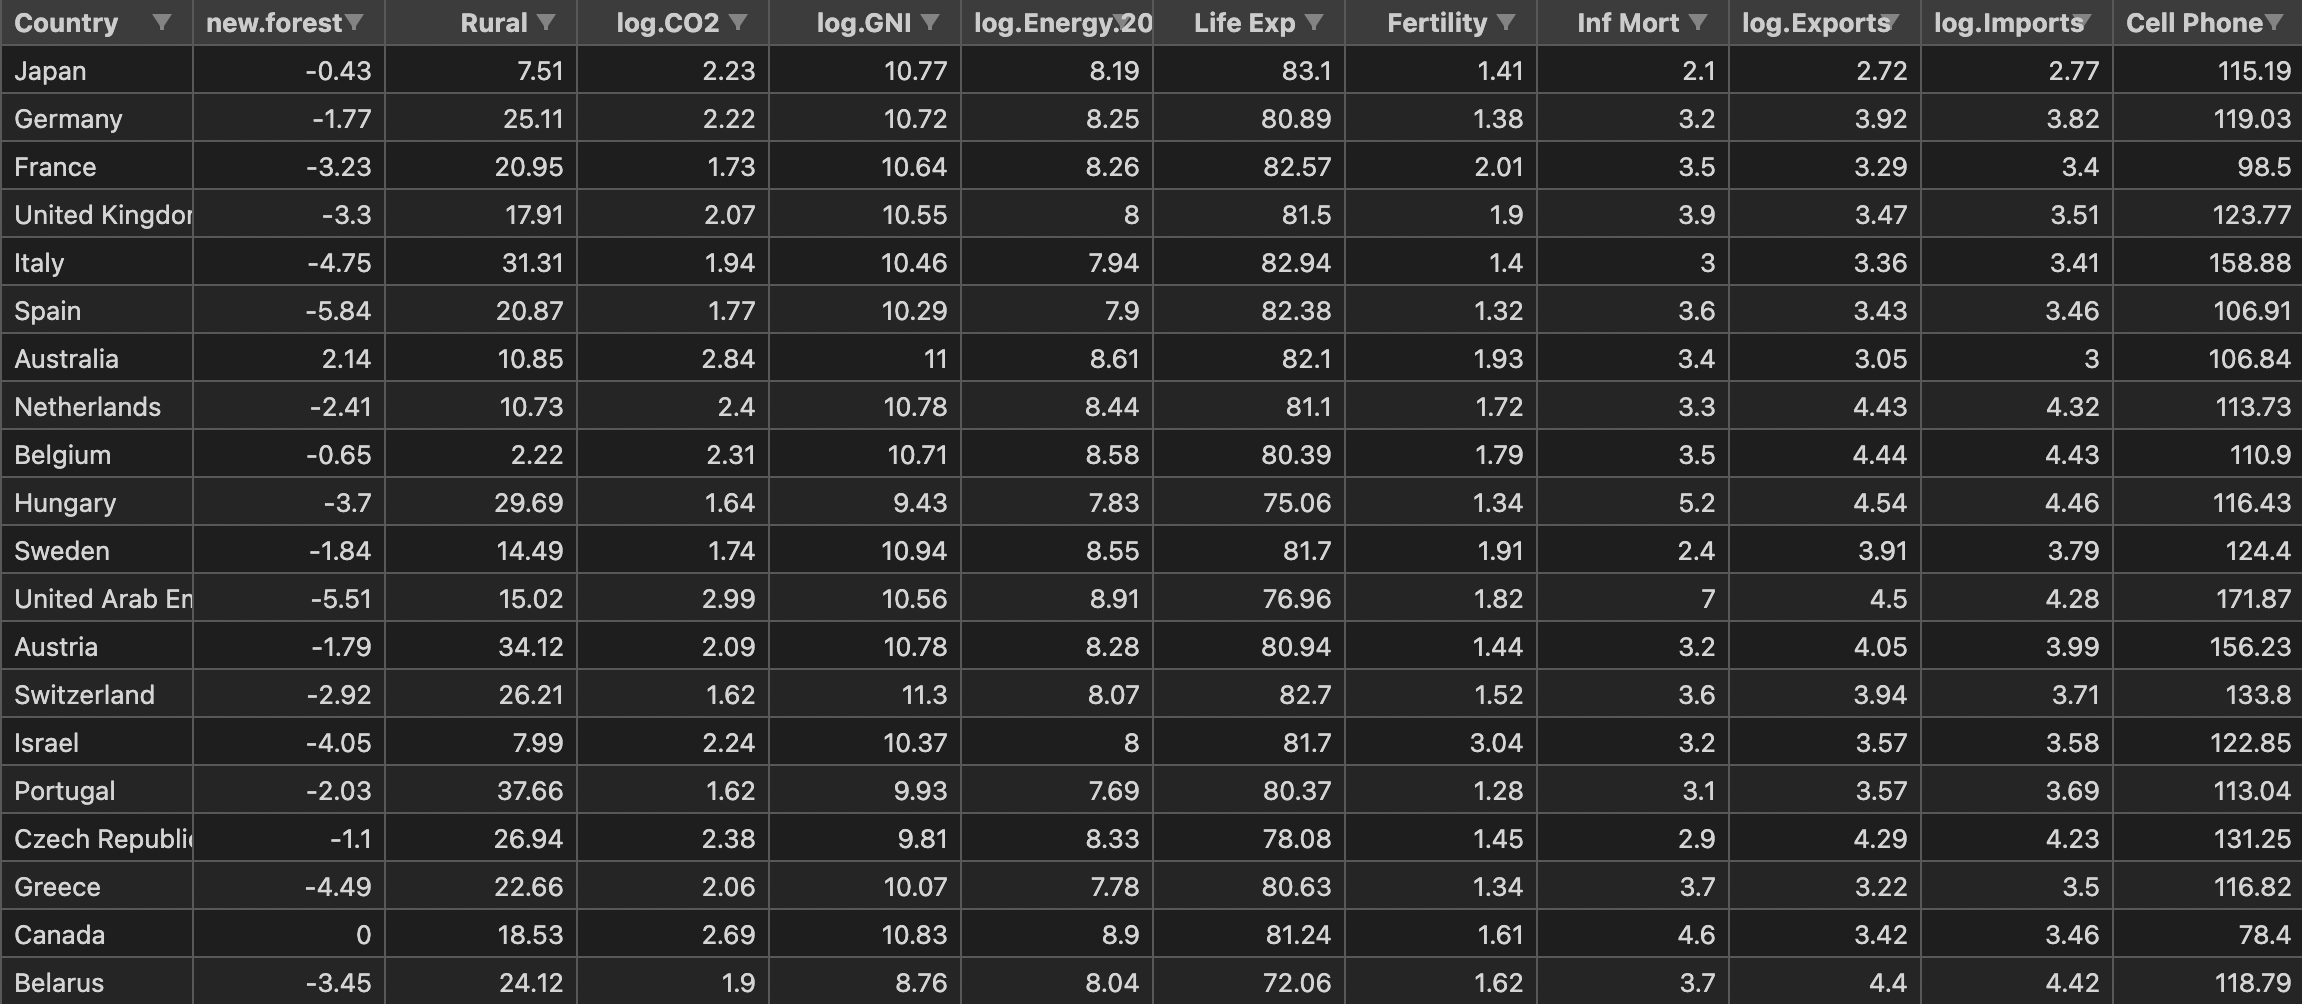
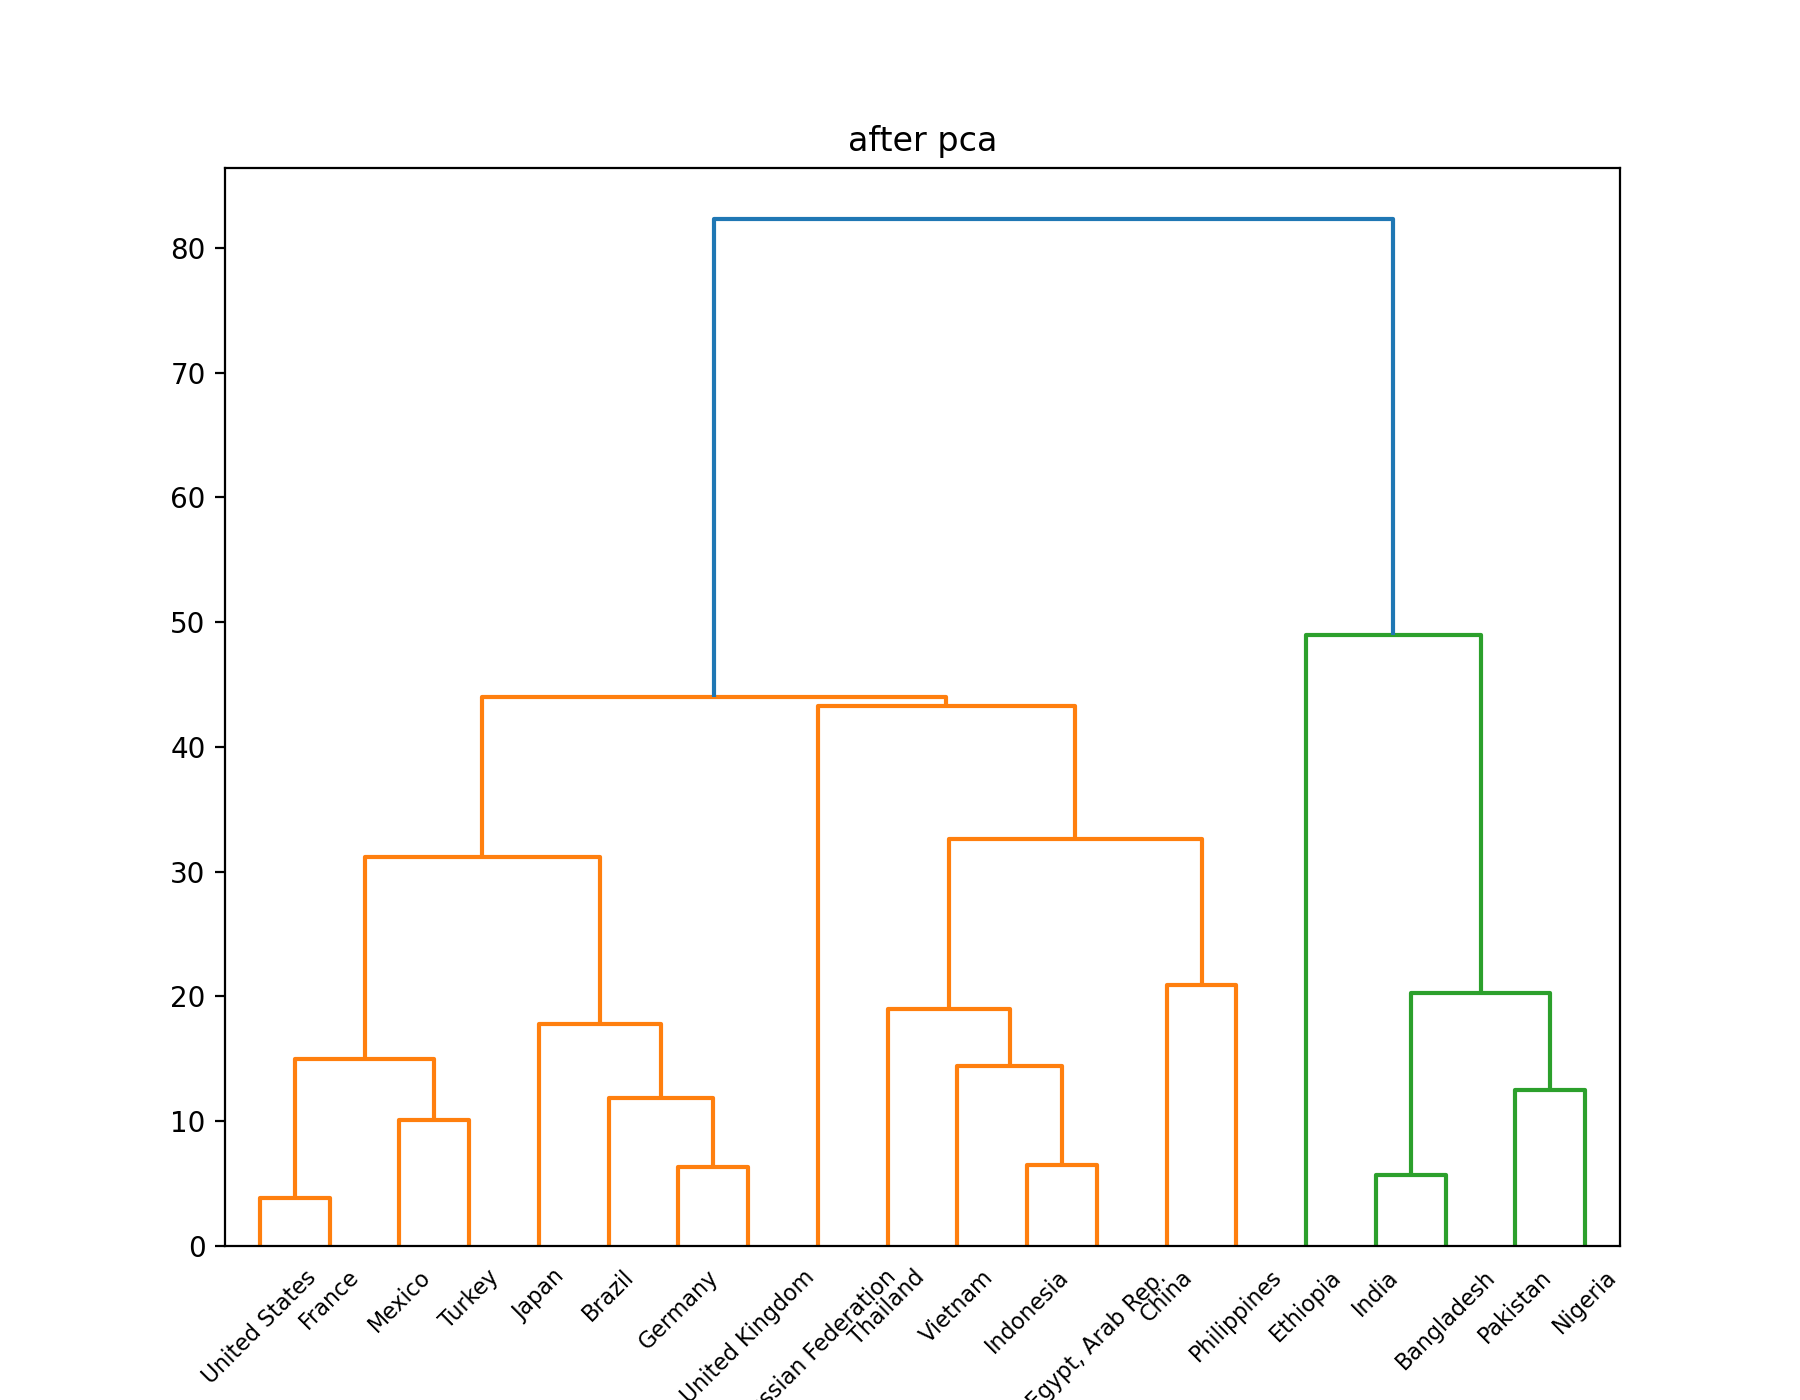
In order to make the visualization of results more convenient, I deleted the last column of population data, and added PCA dimension reduction after hierarchical clustering to compare with the original results.
from scipy.cluster.hierarchy import linkage, dendrogram, fcluster
import matplotlib.pyplot as plt
import pandas as pd
import numpy as np


data = pd.read_csv('data/WBClust2013.csv')
data.pop('Pop')
# data.pop('RuralWater')
# data.pop('CellPhone')
# data.pop('LifeExp')
data = data[:20]
country = list(data['Country'])
data.pop('Country')

# The following code uses hierarchical clustering only

plt.figure(figsize=(9, 7))
plt.title("original data")
mergings = linkage(data, method='average')
# print(mergings)
dendrogram(mergings, labels=country, leaf_rotation=45, leaf_font_size=8)
plt.show()
Z = linkage(data, method='average')
print(Z)
cluster_assignments = fcluster(Z, t=3.0, criterion='maxclust')
print(cluster_assignments)
for i in range(1, 4):
    print('cluster', i, ':')
    num = 1
    for index, value in enumerate(cluster_assignments):
        if value == i:
            if num % 5 == 0:
                print()
            num += 1
            print(country[index], end='  ')
    print()

# The following code is to add PCA for comparison
class myPCA():

    def __init__(self, X, d=2):
        self.X = X
        self.d = d

    def mean_center(self, data):
        """
        Decentralization
        :param data: data sets
        :return:
        """
        n, m = data.shape
        for i in range(m):
            aver = np.sum(self.X[:, i])/n
            x = np.tile(aver, (1, n))
            self.X[:, i] = self.X[:, i]-x

    def runPCA(self):

        # Calculate the covariance matrix to obtain the eigenvalue and eigenvector
        S = np.dot(self.X.T, self.X)
        S_val, S_victors = np.linalg.eig(S)
        index = np.argsort(-S_val)[0:self.d]
        Y = S_victors[:, index]
        # Get the output sample set
        Y = np.dot(self.X, Y)
        return Y

# data_for_pca = np.array(data)
# pcaObject=myPCA(data_for_pca,d=2)
# pcaObject.mean_center(data_for_pca)
# res=pcaObject.runPCA()

# plt.figure(figsize=(9, 7))
# plt.title("after pca")
# mergings = linkage(res,method='average')
# print(mergings)
# dendrogram(mergings,labels=country,leaf_rotation=45,leaf_font_size=8)
# plt.show()
# Z = linkage(res, method='average')
# print(Z)
# cluster_assignments = fcluster(Z, t=3.0, criterion='maxclust')
# print(cluster_assignments)
# for i in range(1,4):
#     print('cluster', i, ':')
#     num = 1
#     for index, value in enumerate(cluster_assignments):
#         if value == i:
#             if num % 5 ==0:
#                 print()
#             num+=1
#             print(country[index],end='  ')
#     print()
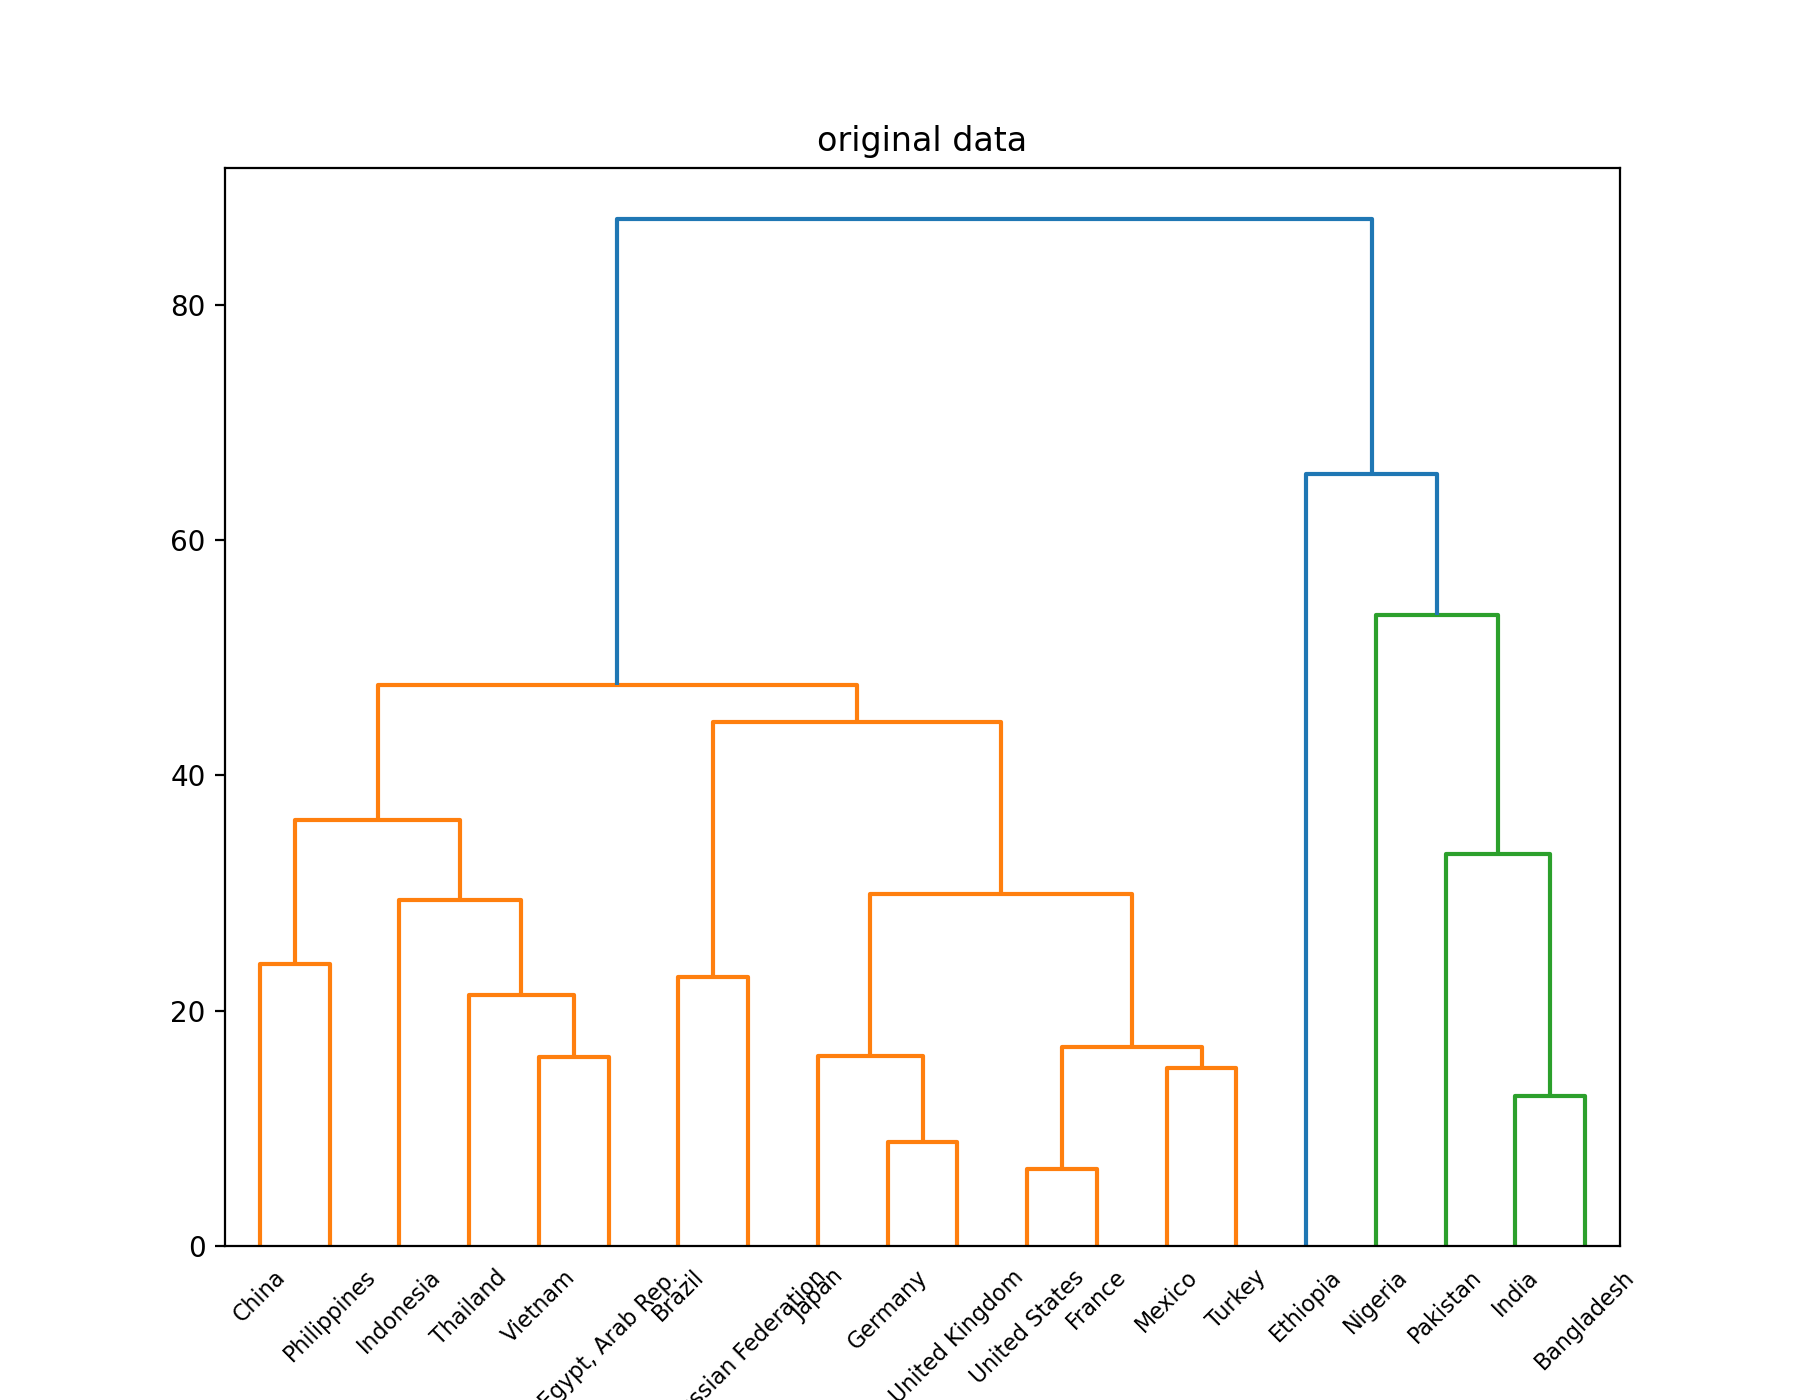
The two classification results are the same:
cluster 1 :
China  United States  Indonesia  Brazil
Russian Federation  Japan  Mexico  Philippines  Vietnam
Egypt, Arab Rep.  Germany  Turkey  Thailand  France
United Kingdom
cluster 2 :
India  Pakistan  Nigeria  Bangladesh
cluster 3 :
Ethiopia
Visualize the results through a tree view
Original tree view:
Results after PCA dimensionality reduction: