Catalog
@
Actual combat content
Ms. Helen has been using online dating sites to find suitable dates. Although dating websites recommend different people, she doesn't like everyone. After summing up, she found that the people she had interacted with could be categorized as follows:
A disliker
 Charming people
 Charming people
Helen has been collecting dating data for some time. She keeps these data in the text file datingTestSet.txt. Each sample takes up one row, totaling 1000 rows.
The sample data collected by Helen mainly contain the following three characteristics:
Frequent Flight Mileage Obtained Annually
 Percentage of time spent playing video games
 Ice-cream litres consumed per week
Task: Try to build a classifier so that after the next data entry, the program can help Helen predict Helen's impression of the person.
In the original book, all normalization, kNN algorithm and classifier are written by the author himself. Code can be used to understand the principle of the algorithm, it is not necessary to use, and the code is based on version 2.7, it is difficult to use directly.
Source code and its details can be referred to the following links:
Machine Learning Practice-k Nearest Neighbor Algorithms (kNN)02-Improve the Matching Effect of Dating Websites
Since we have an excellent sklearn library that can provide ready-made kNN functions for us, why not call it directly? This is where python is more powerful than other languages.
kNN algorithm classification using sklearn self-contained Library
Rough process:
- Import data, print relevant information of data, get a preliminary understanding of data
- Drawing more intuitive analytical data for images
- The cut data can be divided into test set and training set, which can be randomly cut with sklearn library, and the first and second parts of the data can be cut. The latter is more conducive to manual test of test set.
- Data preprocessing, after which the code is only normalized
- Sklearns own library training algorithm, and then score the correct rate
- Perfect the function of classifier and allow the input parameters to realize the real classification in the later stage
You can refer to the following links for a more detailed understanding of sklearn s own kNN algorithm for classification process:
Implementation flow of knn algorithm with sklearn
The following is the code (for more details, please refer to the attached final resources):
#!/usr/bin/env python
# -*- coding:utf-8 -*-
import numpy as np
import pandas as pd
import seaborn as sns
import matplotlib.pyplot as plt
from sklearn import preprocessing
from sklearn.model_selection import train_test_split
from sklearn.neighbors import KNeighborsClassifier
#After the first execution of the transformation file format, the. csv file will be generated under the folder, and then there is no need to repeat the code.
'''
txt = np.loadtxt('datingTestSet2.txt')
txtDf = pd.DataFrame(txt)
txtDf.to_csv('datingTestSet2.csv', index=False) #no index
'''
#load csv, learn more about it.
dataset = pd.read_csv('datingTestSet2.csv')
dataset.columns = ['miles', 'galons', 'percentage', 'label']
print(dataset.head())
print(dataset.dtypes)
print(np.unique(dataset['label']))
print(len(dataset))
#analyze our set through seaborn
# After the first execution of the scatter plot, the effect of the three features on the results will have an impression, and the subsequent execution can also be discontinued.
'''
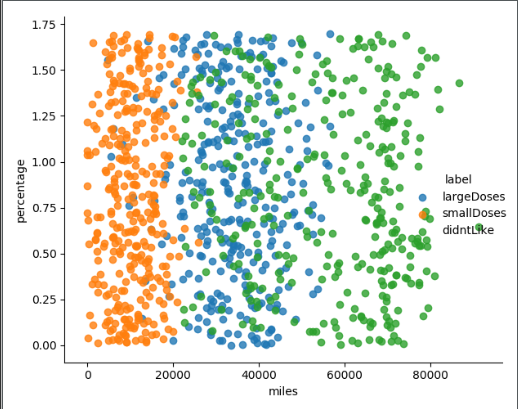
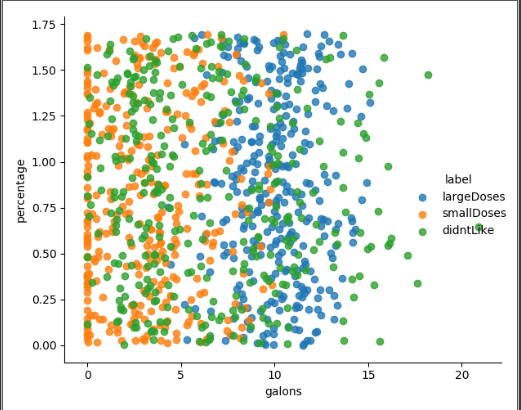
sns.lmplot(x='galons', y='percentage', data=dataset, hue='label',fit_reg=False)
sns.lmplot(x='miles', y='percentage', data=dataset, hue='label',fit_reg=False)
sns.lmplot(x='miles', y='galons', data=dataset, hue='label',fit_reg=False)
plt.show()
'''
#cut dataset randomly
'''
dataset_data = dataset[['miles', 'galons', 'percentage']]
dataset_label = dataset['label']
print(dataset_data.head())
data_train, data_test, label_train, label_test = train_test_split(dataset_data, dataset_label, test_size=0.2, random_state=0)
'''
#cut dataset
dataset_data = dataset[['miles', 'galons', 'percentage']]
dataset_label = dataset['label']
data_train = dataset.loc[:800,['miles', 'galons', 'percentage']] #I asked for the first 800 training sets.
print(data_train.head())
label_train = np.ravel(dataset.loc[:800,['label']])
data_test = dataset.loc[800:,['miles', 'galons', 'percentage']]
label_test = np.ravel(dataset.loc[800:,['label']])
#preprocessing, minmaxscaler
min_max_scaler = preprocessing.MinMaxScaler()
data_train_minmax = min_max_scaler.fit_transform(data_train)
data_test_minmax = min_max_scaler.fit_transform(data_test)
print(data_train_minmax)
#training and scoring
knn = KNeighborsClassifier(n_neighbors=15)
knn.fit(data_train_minmax,label_train)
score = knn.score(X=data_test_minmax,y=label_test,sample_weight=None)
print(score)
#completion
def classifyperson(): #This is the function required for manual input parameter prediction results
percentage = float(input('percentage of time spent playing video games?'))
ffMiles = float(input('frequent flier miles earned per year?'))
iceCream = float(input('liters of ice-cream consumed per year?'))
inArr = np.array([[percentage, ffMiles, iceCream]])
inArr_minmax = min_max_scaler.fit_transform(inArr)
return inArr_minmax
#inArr_minmax = classifyperson()
label_predict = knn.predict(data_test_minmax) #This code combines with the previous manual segmentation data set for manual proofreading accuracy
print(label_predict)When k is 15, the correct rate is the highest, reaching 0.935.
Following is the result of the test set substituted into the classifier, which can be compared with the last 200 tags in the text file, and it can be found that the correct rate is indeed quite high.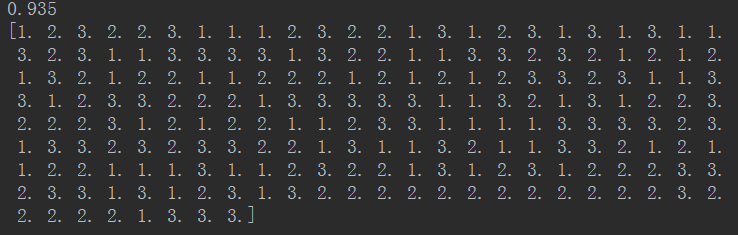
Converting txt files with non-numeric contents into csv files
In the original work, the author has transformed the obj tag into a numerical one, so in the above code, we can directly use the converted files. But if we want to transform data types ourselves, how do we transform them?
In fact, only the first function in the original can be slightly modified. The code is as follows:
# A parser that converts text records to NumPy
def file2matrix(filename):
    fr = open(filename)
    #Get the number of lines in the file
    arrayOfLines = fr.readlines()
    numberOfLines = len(arrayOfLines)
    #Create the returned Numpy matrix
    returnMat = np.zeros((numberOfLines,3))
    classLabelVector = []
    #Parse file data to list
    index = 0
    for line in arrayOfLines:
        line = line.strip() #note 1
        listFromLine = line.split('\t') #Note 2
        returnMat[index,:] = listFromLine[0:3]
        classLabelVector.append(listFromLine[-1])
        index += 1
    return returnMat,classLabelVector

#Call functions to read data
datingDataMat,datingLabels = file2matrix('datingTestSet.txt')
#Stitching labels and features
datingDataMat_df = pd.DataFrame(datingDataMat)
datingLabels_df = pd.DataFrame(datingLabels)
txtDf = pd.concat([datingDataMat_df,datingLabels_df],axis=1) #Transverse splicing
txtDf.to_csv('datingTestSet.csv', index=False) #Here, the tag in datingTestSet.csv is [largedoses, smalldoses, did't like]

#Read datingTestSet.csv
dataset = pd.read_csv('datingTestSet.csv')
dataset.columns = ['miles', 'galons', 'percentage', 'label']
print(dataset.head())
The new DataFrame is as follows: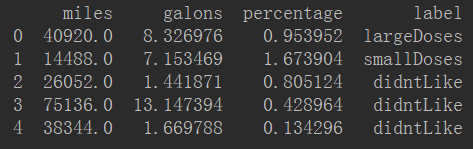
Using sns.lmplot to plot the relationship between several features
The following lists the relationships between the three features (not all), through which we can roughly feel the impact of the three eigenvalues on the results.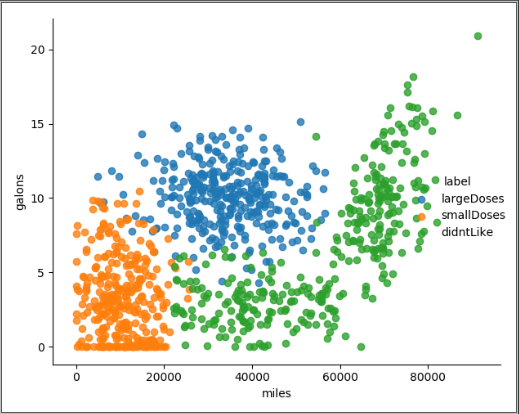
Reference material
How to convert txt file into csv format? (This method only applies to files with only numerical type, or tags have been converted to numerical type. How to import txt files with object type is discussed later.)
How do I rename the column name of the DataFrame?
How does pycharm execute with run without console?
How to draw scatter plots?
How to change the data type of a column in the DataFrame?
How to use join plot in seaborn?
What values do you see in a column?
Jotplot has no hue parameter. Is there any other function to replace it?
How to draw subgraphs?
How do I get the rows and columns of the Dataframe?
How to select DataFrame columns?
How to cut data sets?
How to use sklearn train_test_split to randomly cut data sets?
How to normalize sklearn s with their own libraries?
Introduction and examples of normalization, standardization and regularization
How to use the knn Algorithm in sklearn?
Implementation flow of knn algorithm with sklearn
What is the difference between shuffle() and permutation()?
How do I use with open()as filename?
How to use Python to extract TXT data and convert it into DataFrame?
Merge of pandas data frame (append, merge, concat)