preface
The text and pictures of this article are from the Internet, only for learning and communication, not for any commercial purpose. The copyright belongs to the original author. If you have any questions, please contact us in time for handling.
The annual 520 has just passed.
Due to the impact of the epidemic, we missed this year's Valentine's day on February 14. On May 20, 2020, this homophonic "century 520" with "love you, love you, love you" is particularly attractive to couples.
The Internet is full of wedding, advertising, marriage and other sweet news. The honey on the microblog ranking list will overflow the screen. 520 is a large-scale "dog food scattering" festival.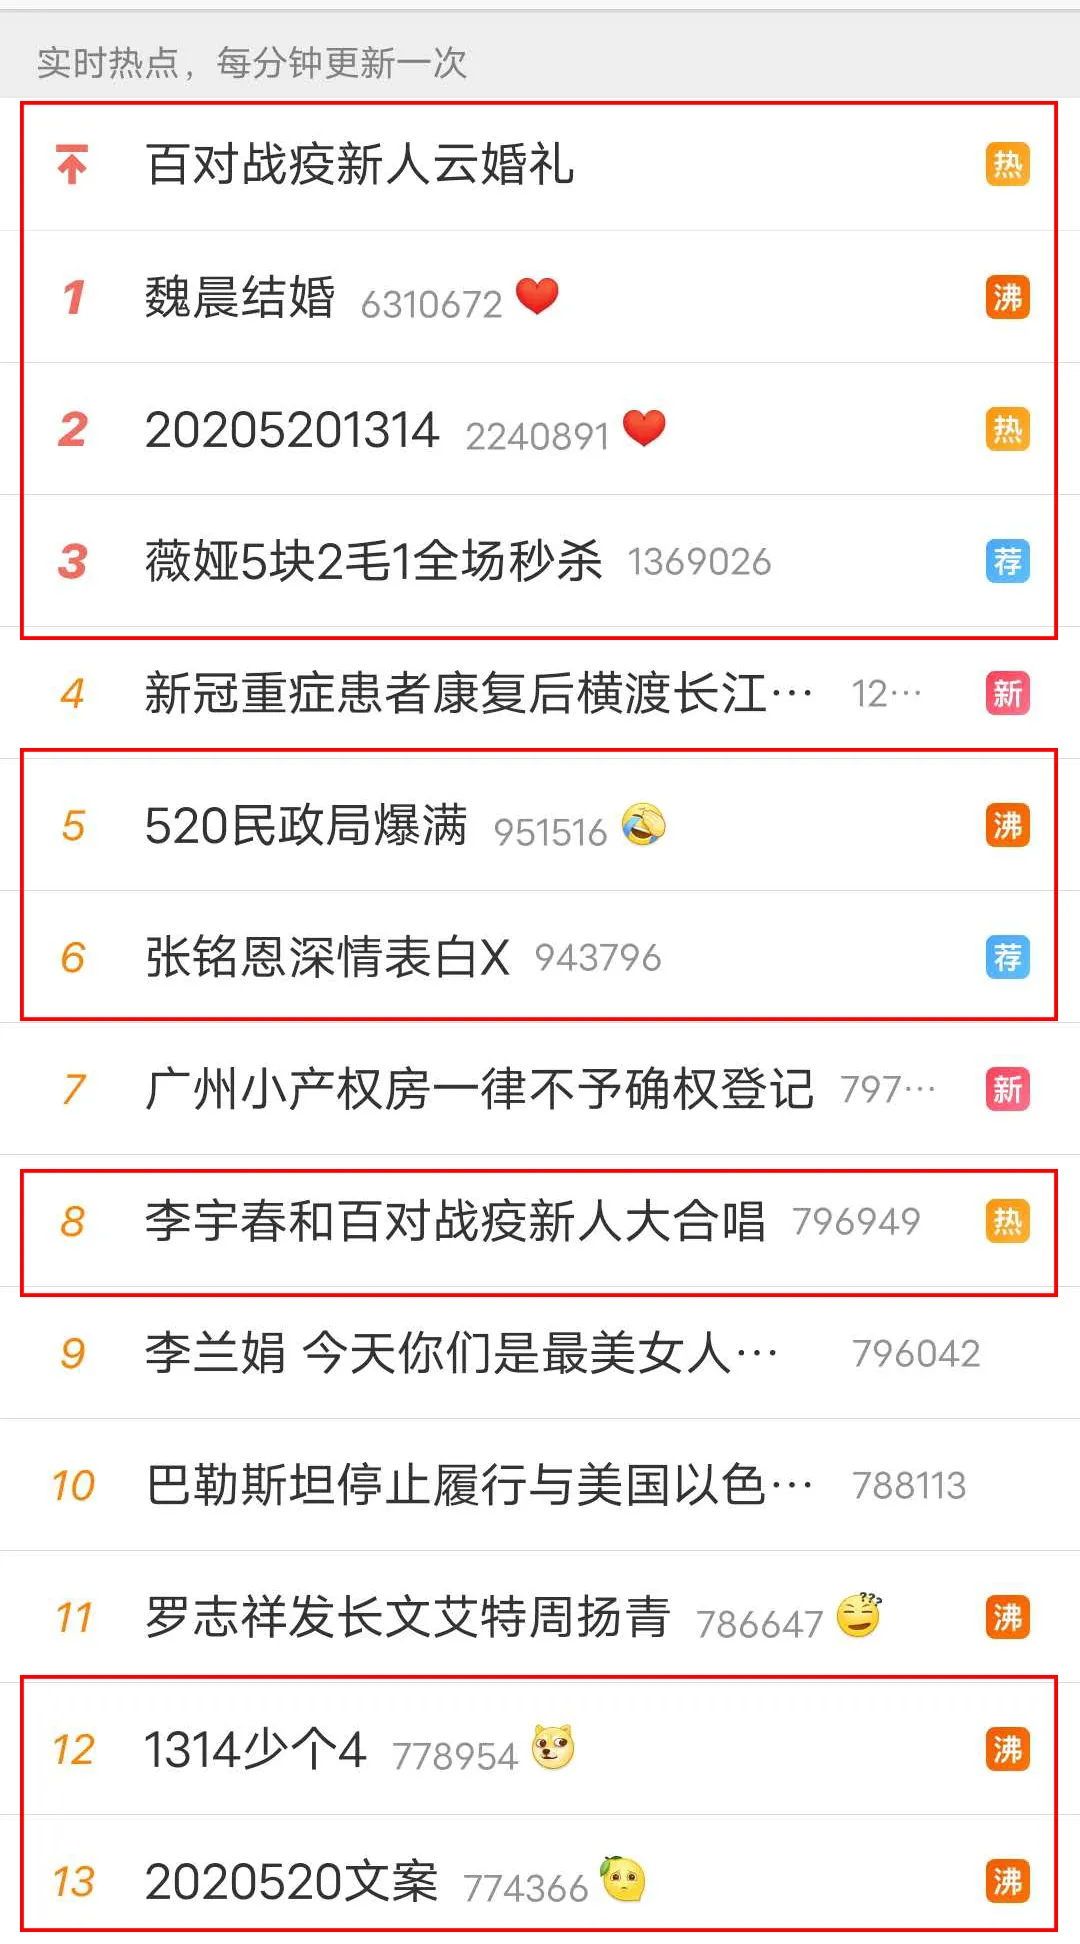
Among them, the biggest dog food comes from the Civil Affairs Bureau! Civil affairs bureaus all over the country are full!

The new people who want to get the license on this day have surrounded the Civil Affairs Bureau. Some even went to the line at 4 a.m.


In addition to the certificated, for couples, how to spend the 520 and what gift to give to their beloved ta are also highly concerned topics.
First of all, we see Zhihu's topic about "what to send 520". After analysis, we find that:
Zhihu data
What's for your girlfriend
As for gifts for girlfriends, most netizens mentioned gifts such as lipstick, perfume, necklace, watch, and rose chocolate.
What's for my boyfriend
Send boyfriend, razor, keyboard, mouse, game machine, etc. are also mentioned frequently.
Taobao data
So what is the truth? Next let's see the data of Taobao tmall, and really use the data to talk.
We collected and collated 100 pages of product data about 520 gifts on taobao.com, and used Python to collate and analyze them. After preprocessing, we got 3854 pieces of data.
What gifts are you buying?
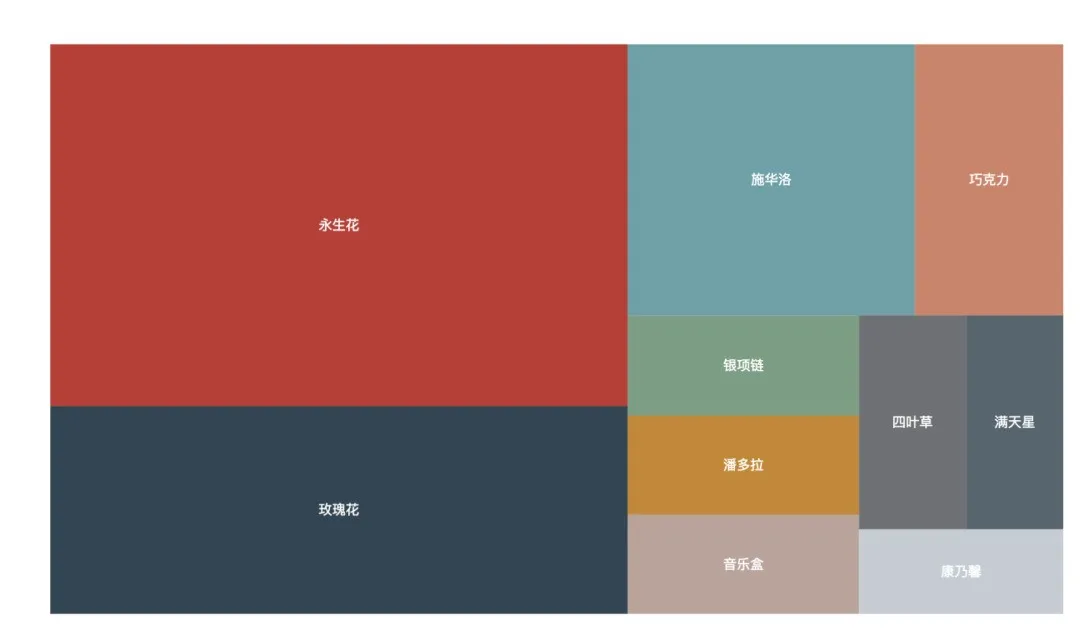
We searched 520 gifts on Taobao, analyzed and sorted out the data, and found that:
Immortalized flowers and roses account for a large proportion. It can be seen that sending flowers at festivals is still the unified choice of men;
In addition, it can be found that Swarovski, Pandora and other jewelry are also good choices;
At the same time, there are music box, chocolate and other gifts.
Which stores sell the best gifts?
As a gift of 520, which stores sell the best?
Analysis found that the make-up brand is indeed the right king.
Mac came first. It's the lipstick that girls have. No problem. Next, Armani, ysl, Tomford and Givenchy were all on the list. What's interesting is that the second best shop is kufire, which specializes in creative gifts, among which there are many gifts such as creative lights and massage pillows. This may also be related to the front page of this store when searching.
Which provinces do people like to buy the most

So which provinces do people like to buy the most during 520? According to the data, the people of Guangdong ranked first, followed by Zhejiang and Shanghai.
How much is the price of 520 goods
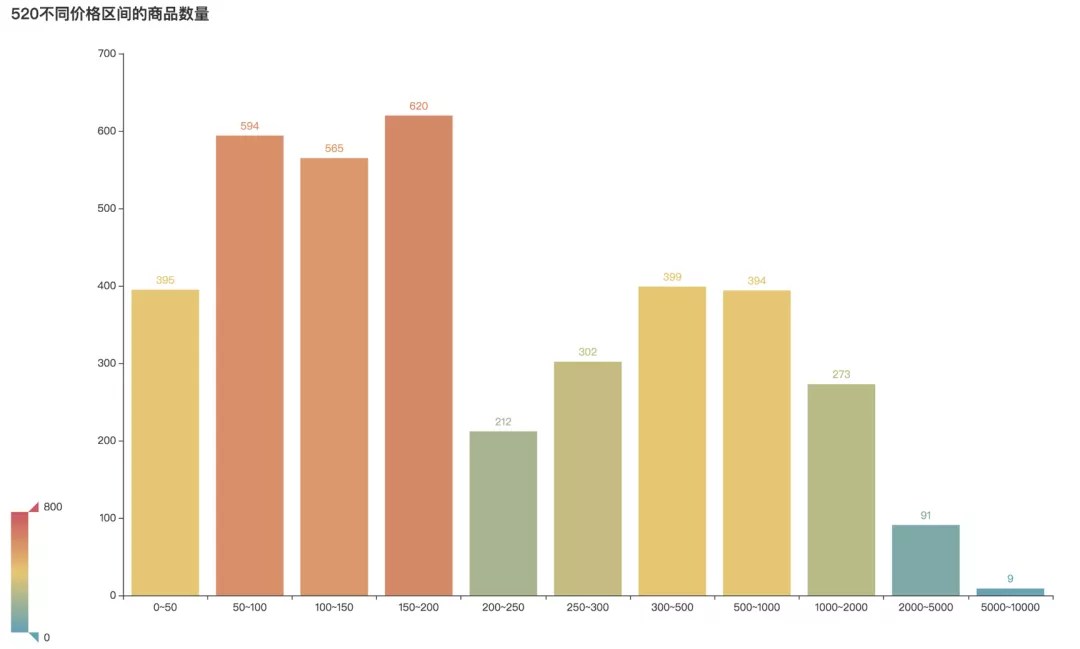
So how are the prices of goods distributed during 520? It can be seen from the figure that there are not many commodities below 50 yuan, and the most commodities within 50-200 yuan.
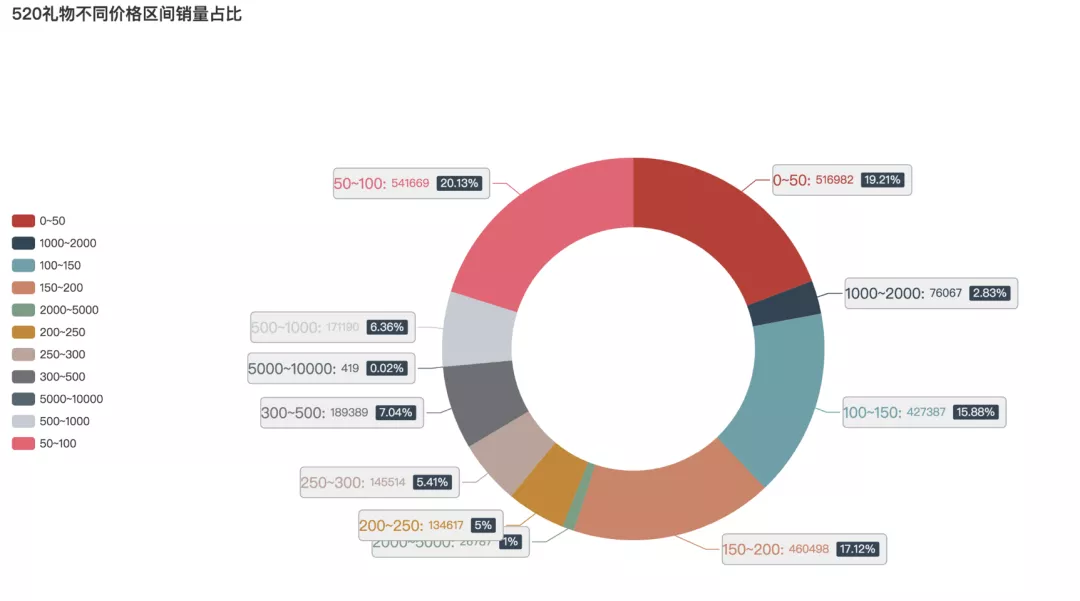
What's the best selling price

After reading the price range of 520 products, let's see what's the best selling price. It can be found from the analysis that commodities within 200 yuan are the most popular. The sales volume of RMB 0-50 accounts for 19.21% and that of RMB 50-100 accounts for 20.13%. The proportion of 100-150 and 150-200 is also good, 15.88% to 17.12% respectively.
In the end, I'll see what 520 people like best to buy. After analyzing and sorting out the titles of 520 commodities, we come to the conclusion that word cloud discovery can be divided into these categories;
Send girls
- Immortalized flowers and roses are the first choice for male compatriots;
- Cosmetics, cosmetics accounted for a large proportion, such as Armani foundation, Givenchy and so on.
- Jewelry and necklaces are also choices for many people;
Send boys
Lighters, watches and electric toothbrushes are products that many people will choose to buy.
It seems that what gift to give is similar to Zhihu's conclusion. We also find that on 520 Valentine's day, the main boys buy gifts for girls. Of course, many little sisters buy gifts for themselves during the 520 Taobao activity.
We collected and sorted out 100 pages of product data about 520 gifts on taobao.com, and used Python for sorting and analysis. The whole data analysis process is divided into the following three steps:
- Data acquisition
- Data preprocessing
- Data visualization
Some key codes are as follows:
1. Data acquisition
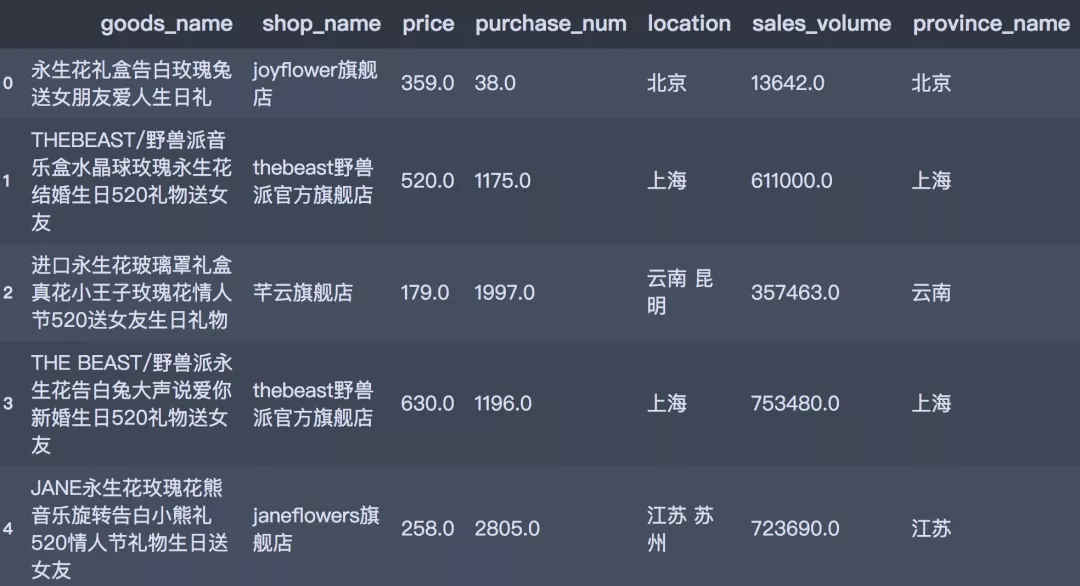
This part of the code has been left out in the previous article. I won't go into details here. The crawled data is stored in the form of data frame, and the results are shown in the following figure.
df.head()
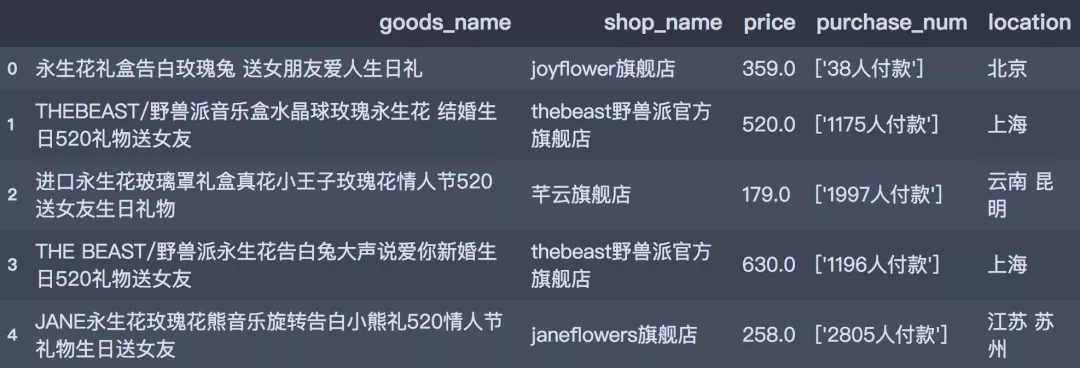
Looking at the size of the data frame, you can see that there are 4404 samples in total.
df.info()
<class 'pandas.core.frame.DataFrame'>
RangeIndex: 4404 entries, 0 to 4403
Data columns (total 5 columns):
goods_name      4404 non-null object
shop_name       4404 non-null object
price           4404 non-null float64
purchase_num    4404 non-null object
location        4404 non-null object
dtypes: float64(1), object(4)
memory usage: 172.1+ KB
2. Data preprocessing
Here we process the data as follows to facilitate the subsequent data analysis and visualization:
- Delete duplicate values
- purchase_num field: delete the record with blank number of purchasers
- purchase_num fields: extracting numeric data
- Calculated sales = price*purchase_num
- location field: extract province data
- goods_name field: segmentation, keyword extraction
# Import required package
import numpy as np
import pandas as pd
import time
import re
import jieba
import jieba.analyse
from collections import Counter
from pyecharts.charts import Bar, Map, Pie, TreeMap, WordCloud, Page
from pyecharts import options as opts
from pyecharts.globals import SymbolType

# read in data
df = pd.read_excel('../data/520 Gift tmall data.xlsx')

# Remove duplicates
df.drop_duplicates(inplace=True)

# Delete the record with blank number of purchasers
df = df[df['purchase_num'].str.contains('Payment by person')]

# Number of purchasers
df['purchase_num'] = df['purchase_num'].str.extract('(\d+)').astype('float')
# sales volume
df['sales_volume'] = df['price'] * df['purchase_num']

# Province processing
df['province_name'] = df.location.str[:2]
After preprocessing, there are 3854 pieces of data, as follows:
df.head()
3. Data visualization
In the data visualization part, we mainly analyze the following information:
520 what gifts do you buy Top10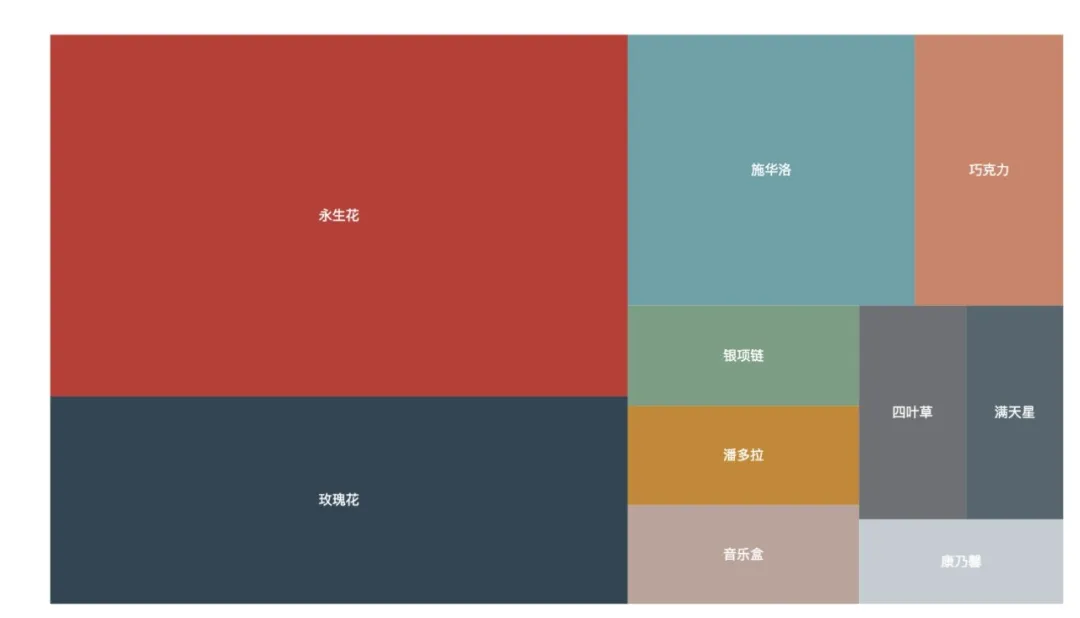
data = [
    {"value": 593, "name": "Immortal flower"},
    {"value": 340, "name": "rose"},
    {"value": 221, "name": "Swarlow"},
    {"value": 114, "name": "Chocolates"},
    {"value": 66, "name": "Silver Necklace"},
    {"value": 65, "name": "Clover"},
    {"value": 65, "name": "Music box"},
    {"value": 65, "name": "Pandora"},
    {"value": 59, "name": "babysbreath"},
    {"value": 49, "name": "Carnation"}
]

# Dendrogram
tree = TreeMap(init_opts=opts.InitOpts(width="1280px", height="720px"))
tree.add(series_name='', data=data, label_opts=opts.LabelOpts(position='inside'))
tree.set_global_opts(title_opts=opts.TitleOpts(title='520 What gifts do you buy top10'),
                     legend_opts=opts.LegendOpts(is_show=False))
tree.render()
520 top 10 stores of gift goods sales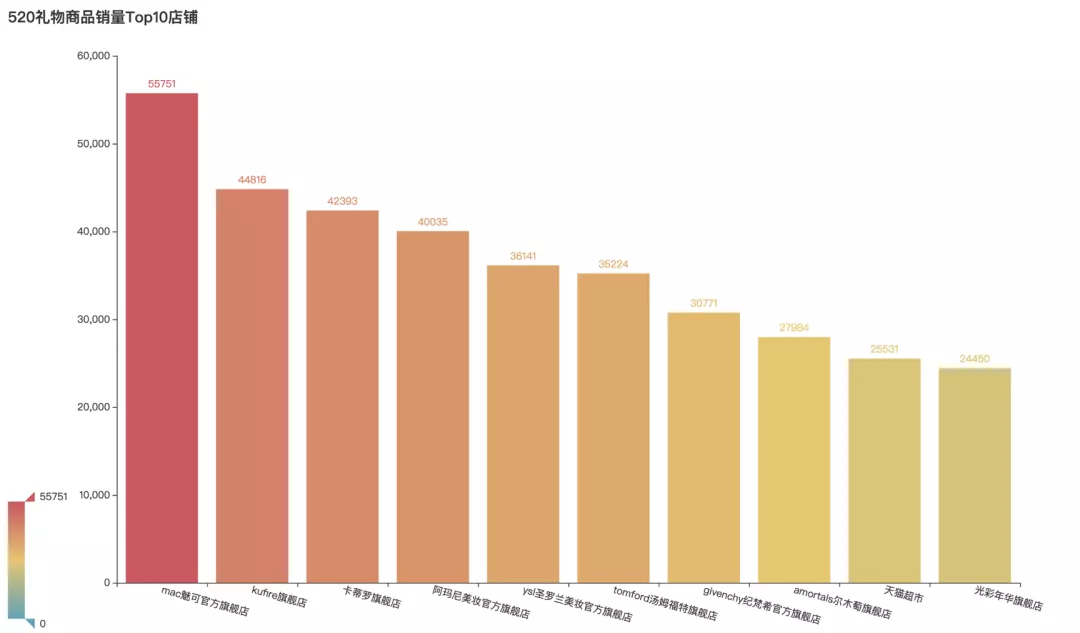
Code implementation:
# Calculate top10 stores
shop_top10 = df.groupby('shop_name')['purchase_num'].sum().sort_values(ascending=False).head(10)

# Draw column chart
bar1 = Bar(init_opts=opts.InitOpts(width='1350px', height='750px'))
bar1.add_xaxis(shop_top10.index.tolist())
bar1.add_yaxis('', shop_top10.values.tolist())
bar1.set_global_opts(title_opts=opts.TitleOpts(title='520 Gift sales Top10 shop'),
                     xaxis_opts=opts.AxisOpts(axislabel_opts=opts.LabelOpts(rotate=-15)),
                     visualmap_opts=opts.VisualMapOpts(max_=shop_top10.values.max()))
bar1.render()
520 top 10 gift goods sales provinces
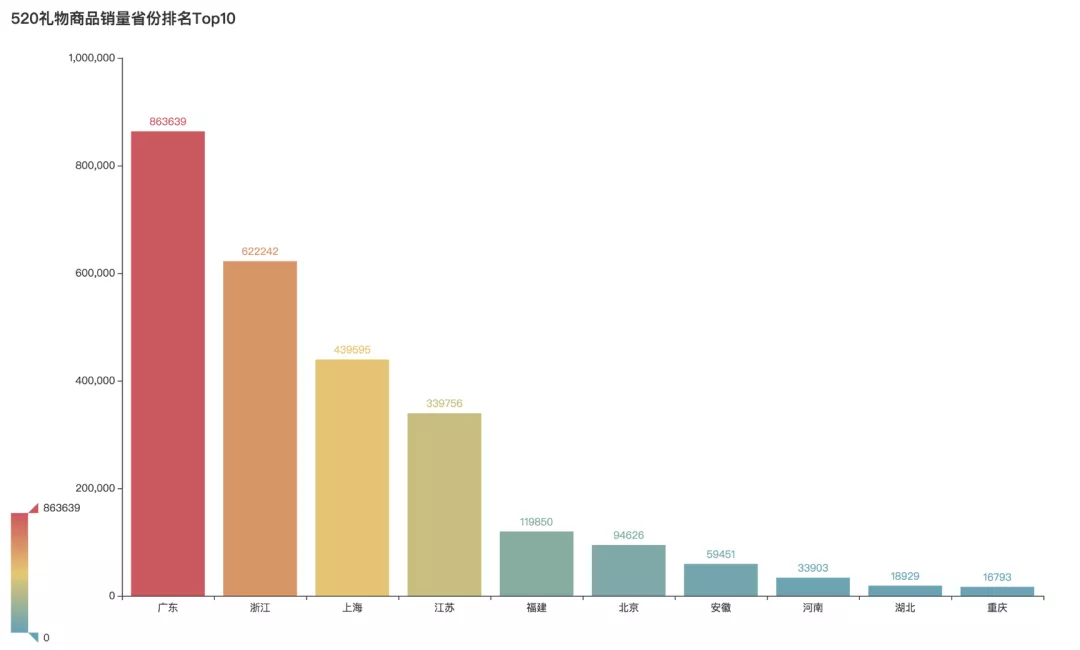
Code implementation:
# Calculate sales volume top10
province_top10 = df.groupby('province_name')['purchase_num'].sum().sort_values(ascending=False).head(10)

# Bar chart
bar2 = Bar(init_opts=opts.InitOpts(width='1350px', height='750px'))
bar2.add_xaxis(province_top10.index.tolist())
bar2.add_yaxis('', province_top10.values.tolist())
bar2.set_global_opts(title_opts=opts.TitleOpts(title='520 Province ranking of gift goods sales Top10'),
                     visualmap_opts=opts.VisualMapOpts(max_=province_top10.values.max()))
bar2.render()
520 sales distribution of gifts in various provinces of China
Code implementation:
# Calculate sales volume
province_num = df.groupby('province_name')['purchase_num'].sum().sort_values(ascending=False)

# draw a map
map1 = Map(init_opts=opts.InitOpts(width='1350px', height='750px'))
map1.add("", [list(z) for z in zip(province_num.index.tolist(), province_num.values.tolist())],
         maptype='china'
        )
map1.set_global_opts(title_opts=opts.TitleOpts(title='520 Sales distribution of domestic provinces of gifts'),
                     visualmap_opts=opts.VisualMapOpts(max_=province_num.quantile(0.9)),
                    )
map1.render()
520 quantity of goods in different price ranges

Code implementation:
def tranform_price(x):
    if x <= 50:
        return '0~50'
    elif x <= 100:
        return '50~100'
    elif x <= 150:
        return '100~150'
    elif x <= 200:
        return '150~200'
    elif x <= 250:
        return '200~250'
    elif x <= 300:
        return '250~300'
    elif x <= 500:
        return '300~500'
    elif x <= 1000:
        return '500~1000'
    elif x <= 2000:
        return '1000~2000'
    elif x <= 5000:
        return '2000~5000'
    else:
        return '5000~10000'

# data conversion
df['price_cut'] = df.price.apply(lambda x: tranform_price(x))
price_num = df.price_cut.value_counts()

# data
x_data = ['0~50', '50~100', '100~150', '150~200', '200~250', '250~300',
          '300~500', '500~1000', '1000~2000', '2000~5000', '5000~10000']
y_data = [395, 594, 565, 620, 212, 302, 399, 394, 273, 91, 9]

bar3 = Bar(init_opts=opts.InitOpts(width='1350px', height='750px'))
bar3.add_xaxis(x_data)
bar3.add_yaxis('', y_data)
bar3.set_global_opts(title_opts=opts.TitleOpts(title='520 Quantity of goods in different price ranges'),
                     visualmap_opts=opts.VisualMapOpts(max_=800))
bar3.render()
Proportion of sales in different price ranges of 520 gifts
Code implementation:
price_cut_num = df.groupby('price_cut')['purchase_num'].sum()
data_pair = [list(z) for z in zip(price_cut_num.index, price_cut_num.values)]

# Pie chart
pie1 = Pie(init_opts=opts.InitOpts(width='1350px', height='750px'))
# Built in rich text
pie1.add(series_name="",
        radius=["35%", "55%"],
        data_pair=data_pair,
        label_opts=opts.LabelOpts(formatter="{b}: {c} ({d}%)")
        )
pie1.set_global_opts(legend_opts=opts.LegendOpts(pos_left="left", pos_top='30%', orient="vertical"),
                     title_opts=opts.TitleOpts(title='520 Proportion of sales in different price ranges of gifts'))
pie1.render()
The above is all about Python's analysis of 520 gift data. If you are interested, you can download the data and code yourself and try it~