Preface
The advancement of modern industrialization has greatly accelerated the modernization process and brought about corresponding security risks. In the traditional field of visual monitoring, the front-end technology based on Web SCADA is generally used to realize 2D visual monitoring. This system uses Hightopo's HT for Web products to construct lightweight 3D visual scene, which shows a modern worker from the front. The factories'realistic scenes, including the real-time location of factory workers, the scope of the electronic fence, the safety situation of the site and so on, help us intuitively understand the current safety situation of factory workers.
This article describes how to realize a simple 3D electronic fence visualization by using HT through the construction of visualization scene and loading of model, the realization of real-time location code, the realization of electronic fence and trajectory map.
The following is the project address: Industrialized 3D Electronic Fence Based on HTML5 WebGL,Trajectory diagram
Effect Preview
Real-time positioning effect of factory personnel and electronic fence effect

Trajectory map rendering
code implementation
Character Models and Scenes
The character model used in the project is generated by 3d Max modeling. The modeling tool can export obj and mtl files. In HT, the camera model in 3d scene can be generated by parsing obj and mtl files.
Scenarios in the project are built by HT's 3d editor. Some of the models in the scenario are modeled by HT, others are modeled by 3dMax, and then imported into HT.
Drawing Electronic Fence
The electronic fence in the scene is not a model built by 3dMax. HT provides a variety of basic shape types for user modeling. Unlike the traditional 3D modeling method, the core of HT modeling is API-based interface. Through predefined primitive types and parameter interfaces, it can be set up to achieve the construction of three-dimensional model. According to the shape, I divide the electronic fence into cylinders, cuboids and prisms with polygons at the bottom.

The following is the pseudocode I drew for the electronic fence:
  1 G.makeShapes = function (data, typeName, color, lastColor, g3dDm) {
  2     //data It contains graphic information of electronic fence. json object array
  3     let shapes = data;
  4     for (let i = 0; i < shapes.length; i++) {
  5         let shape = shapes[i];
  6         let type = Number(shape['type']);
  7         let x = Number(shape['x']);
  8         let y = Number(shape['y']);
  9         let z = Number(shape['z']);
 10         let width = Number(shape['width']);
 11         let height = Number(shape['height']);
 12         let tall = Number(shape['tall']);
 13         let radius = Number(shape['radius']);
 14         let vertexX = shape['vertexX'];
 15         let vertexY = shape['vertexY'];
 16         let nodePoints = [];
 17         let p3 = [];
 18         let s3 = [];
 19         let centerX = 0;
 20         let centerY = 0;
 21         let centerZ = 0;
 22         let node = new ht.Node();
 23         node.setTag(typeName + i);
 24         switch (type) {
 25             //The first shape: a cylinder
 26             case 1:
 27                 p3 = [-x, tall / 2, -y];
 28                 s3 = [radius, tall, radius];
 29                 //Define the style of electronic fence
 30                 node.s({
 31                     "shape3d": "cylinder",
 32                     "shape3d.color": color,
 33                     "shape3d.transparent": true,
 34                     "shape3d.reverse.color": color,
 35                     "shape3d.top.color": color,
 36                     "shape3d.top.visible": false,
 37                     "shape3d.bottom.color": color,
 38                     "shape3d.from.color": color,
 39                     "shape3d.to.color": color
 40                 });
 41                 node.p3(p3);    //Setting up three-dimensional coordinates
 42                 node.s3(s3);    //Setting Shape Information
 43                 break;
 44             //The second shape: cuboids
 45             case 2:
 46                 centerX = x - width / 2;
 47                 centerY = y - height / 2;
 48                 centerZ = z + tall / 2;
 49                 p3 = [-Number(centerX) - width, Number(centerZ), -Number(centerY) - height];
 50                 s3 = [width, tall, height];
 51                 node.s({
 52                     "all.color": color,
 53                     "all.reverse.color": color,
 54                     "top.visible": false,
 55                     "all.transparent": true
 56                 });
 57                 node.p3(p3);
 58                 node.s3(s3);
 59                 break;
 60             //The third shape: an irregular contour at the bottom
 61             case 3:
 62                 let segments = [];
 63                 for (let i = 0; i < vertexX.length; i++) {
 64                     let x = -vertexX[i];
 65                     let y = -vertexY[i];
 66                     let newPoint = { x: x, y: y };
 67                     nodePoints.push(newPoint);
 68                     //1: moveTo,Take up one point of information to represent the starting point of a new path
 69                     if (i === 0) {
 70                         segments.push(1);
 71                     }
 72                     else {
 73                         //2: lineTo,Occupy a point of information representing the connection from the last last last point to that point
 74                         segments.push(2);
 75                         if (i === vertexX.length - 1) {
 76                             //5: closePath,Does not occupy the point information, represents the end of the path drawing, and closes to the starting point of the path.
 77                             segments.push(5);
 78                         }
 79                     }
 80                 }
 81                 node = new ht.Shape();
 82                 node.setTag(typeName + i);
 83                 node.s({
 84                     'shape.background': lastColor,
 85                     'shape.border.width': 10,
 86                     'shape.border.color': lastColor,
 87                     'all.color': lastColor,
 88                     "all.transparent": true,
 89                     'all.opacity': 0.3,
 90                 });
 91                 p3 = [nodePoints[0]['x'], tall / 2, nodePoints[0]['y']];
 92                 node.p3(p3);
 93                 node.setTall(tall);
 94                 node.setThickness(5);
 95                 node.setPoints(nodePoints); //node Setting Point Set Location Information
 96                 node.setSegments(segments); //node Setting Point Set Connection Rules
 97                 break;
 98         }
 99         g3dDm.add(node);
100     }
101 }
Considering that the electronic fence may affect the observation of people's position in some cases, the function of hiding the electronic fence is set up. In HT, users can customize the tag tag Tag as the unique identifier of the model. I unified and saved all tag prefixes of the electronic fence model in fenceName. When need to hide, I traversed all tag names prefix fenceName model, and set different hiding methods according to different types of models.
The following are related pseudo-codes:
 1 g3dDm.each((data) => {
 2     if (data.getTag() && data.getTag().substring(0, 4) === fenceName) {
 3         if (data.s('all.opacity') === '0') {
 4             data.s('all.opacity', '0.3');
 5         }
 6         else {
 7             data.s('shape3d.visible', true);
 8             data.s('all.visible', true);
 9             data.s("2d.visible", true);
10             data.s("3d.visible", true);
11         }
12     }
13 });
Real-time location of human model
Because the project uses http protocol to acquire data, so the timer is used to refresh the person data information regularly. HT has the setPosition 3D method to set the location of the node, so it is not introduced too much. But the refresh of the position of the person node also includes the orientation of the person. Therefore, each person movement needs to be compared with the previous position to calculate the angle of the offset.
The relevant pseudocode is as follows:
 1 // If the person node refreshing data is identical to the original person node label, there will be location updates.
 2 if (realInfoData.tagId === tag.getTag()) {
 3     //Calculating position orientation migration parameters
 4     let angleNumber = Math.atan2(((-p3[2]) - (-tag.p3()[2])), ((-p3[0]) - (-tag.p3()[0])));
 5     //If you don't turn around in place, judge whether the person's position in the plane has changed.
 6     if (p3[0] !== tag.p3()[0] || p3[2] !== tag.p3()[2]) {
 7         if (angleNumber > 0) {
 8             angleNumber = Math.PI - angleNumber;
 9         } else {
10             angleNumber = -Math.PI - angleNumber;
11         }
12         //Setting Person Orientation
13         tag.setRotation3d(0, angleNumber + Math.PI / 2, 0);
14     }
15     //Setting Person Position
16     tag.p3(p3);
17 }
Persons trigger alarms
When a person triggers an alarm, there are two ways to alert the system user at the same time. One is that the color of the panel on the head of the person changes and the alarm information is displayed.
The relevant codes are as follows:
 1 switch(obj.alarmType){
 2     case null:
 3         if(panel){//No alarm
 4             panel.a('alarmContent','');
 5             panel.a('bg','rgba(6,13,36,0.80)');
 6         }
 7         break;
 8     case '0':
 9         panel.a('alarmContent','Enter the fence');
10         panel.a('bg','rgb(212,0,0)');
11         break;
12     case '1':
13         panel.a('alarmContent','SOS');
14         panel.a('bg','rgb(212,0,0)');
15         break;
16     case '2':
17         panel.a('alarmContent',''); //Leave the fence
18         panel.a('bg','rgba(6,13,36,0.80)');
19         break;
20     case '3':
21         panel.a('alarmContent','Long time no movement');
22         panel.a('bg','rgb(212,0,0)');
23         break;
24 }
Second, the right side panel of the page will add alarm information.
The relevant codes are as follows:
1 data.a('text', info);
2 list.dm().add(data);
Principle of trajectory realization of trajectory graph
After an alarm occurs, it is necessary to trace the origin and development of the alarm according to the trajectory of the person. If the trajectory is reproduced by drawing a canvas step node according to each step of the point set, it is easy to cause the situation of too many nodes and page carton. So I use a whole pipeline instead of all the step nodes of a character. The advantage of using the pipeline is that there is only one pipeline element information for each character's trajectory graph from the beginning to the end. The rendering of the page is more friendly and smooth.
The code to generate the pipeline trajectory is as follows:
 1 //Generation trajectory
 2 this.ployLines[i] = new ht.Polyline();
 3 this.ployLines[i].setParent(node);
 4 this.points[i] = [];
 5 this.points[i].push({ x: p3[0], y: p3[2], e: p3[1] -50 });
 6 this.ployLines[i].setPoints(this.points[i]);
 7 this.ployLines[i].s({
 8     'shape.border.color': 'red'
 9 });
10 g3dDm.add(this.ployLines[i]);
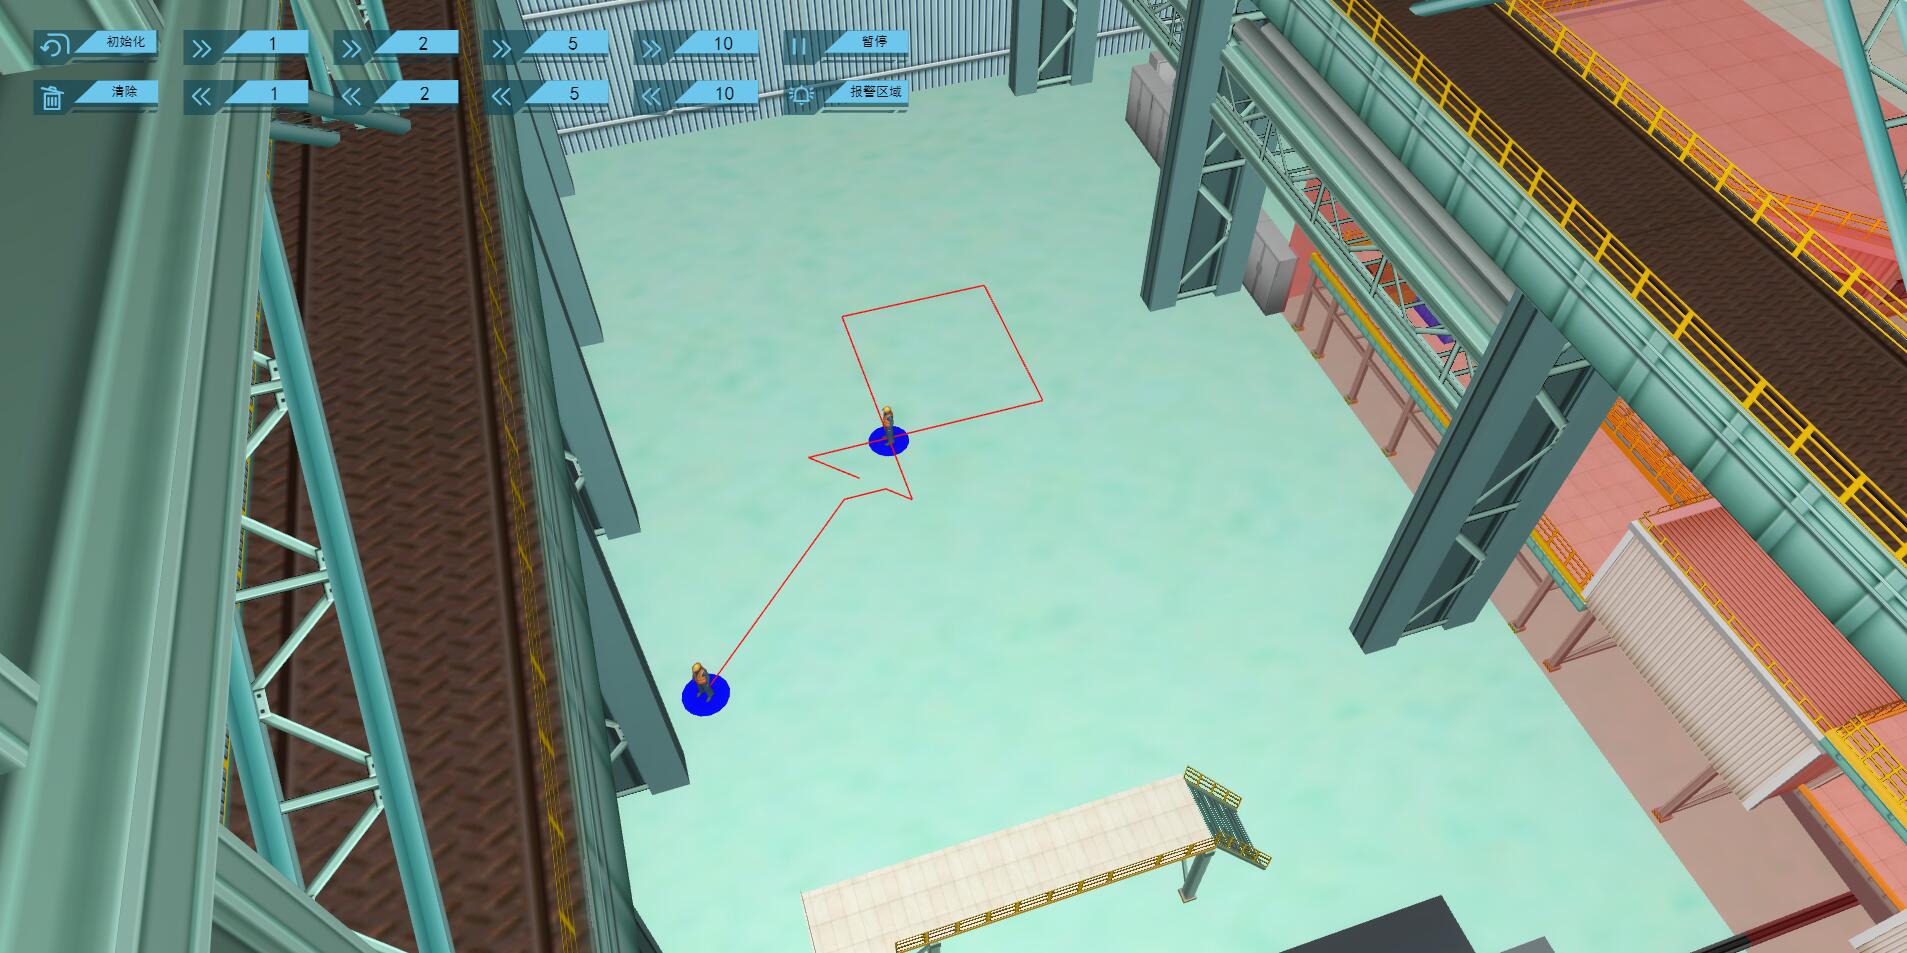
As the character moves forward, he pushes forward the coordinates of a point to the point set of the pipeline and draws a new pipeline part at the same time. Similarly, when the character steps back, the points of the pipeline focus on the coordinates of the last point at present, while the pipeline loses the last two points to connect. In addition, I use a timer to process the forward and backward of the trajectory diagram respectively. The following is the operation effect of the trajectory diagram:
