Initial experience of open source monitoring prometheus
1. Introduction to Prometheus
Official website: https://prometheus.io/
Prometheus Unofficial Manual in Chinese: https://github.com/1046102779/prometheus
The main features of Prometheus are:
Multidimensional Data Model
Flexible Query Language
Independent of distributed storage, a single server node is autonomous
Using HTTP to pull out time series data by pull model
push model is also supported through intermediate gateway
Discover the target service object through service discovery or static configuration
grafana supports a variety of graphics and interface presentations
assembly
Prometheus ecology includes many components, some of which are optional:
The main service Prometheus Server is responsible for capturing and storing time series data.
The client library is responsible for detecting application code
PUSH Gateway Supporting Short Life Cycle
GUI based on Rails/SQL dashboard builder
A variety of export tools can support Prometheus storage data into HAProxy, StatsD, Graphite and other tools required for data storage formats
Warning Manager
Command Line Query Tool
Other support tools
Most Prometheus components are written in Go, which makes them easy to compile and deploy.
Framework
The following diagram illustrates the overall architecture of Prometheus and the role of some components in the ecosystem: Prometheus Arhitecture

Prometheus services can pull data directly through the target or indirectly through the intermediate gateway. It stores all the captured data locally, cleans and organizes the data through certain rules, and stores the results into new time series. PromQL and other API s visually display the collected data.
Applicable scenarios
Prometheus performs very well in recording pure digital time series. It is not only suitable for the monitoring of hardware indicators such as server-oriented, but also for the monitoring of high-dynamic service-oriented architecture. Prometheus is also a powerful multi-dimensional data collection and data filtering query language for popular microservices.
Prometheus is designed for service reliability. When a service fails, it allows you to quickly locate and diagnose problems. Its construction process has no strong dependence on hardware and services.
Not applicable to scenarios
Prometheus, its value lies in reliability, even in very harsh environments, you can access it at any time and view the statistical information of various indicators of system services. If you need 100% accuracy for statistics, it doesn't work, for example, it doesn't work for real-time billing systems.
2. First run promethues
2.1.1 Download and Unzip
Download: Choose the right platform and version to download https://prometheus.io/download/
Unzip: tar xvfz prometheus-*.tar.gz
cd prometheus-*
2.1.2 Configuration Running
Prometheus pulls program metrics from the target machine through http, and prometheus server program also exposes the data generated by its own operation. For the first experiment, you can configure to pull out Prometheus own indicators. Configuration files should be specified before running. At present, the latest official version 2.0.0 has brought the default configuration file prometheus.yml. You can modify the configuration file once.
# my global config
global:
  scrape_interval:     15s # Set the scrape interval to every 15 seconds. Default is every 1 minute.
  evaluation_interval: 15s # Evaluate rules every 15 seconds. The default is every 1 minute.
  # scrape_timeout is set to the global default (10s).

  # Attach these labels to any time series or alerts when communicating with
  # external systems (federation, remote storage, Alertmanager).
  external_labels:
      monitor: 'codelab-monitor'

# Load rules once and periodically evaluate them according to the global 'evaluation_interval'.
rule_files:
  # - "first.rules"
  # - "second.rules"
  #  - "prometheus.rules"
# A scrape configuration containing exactly one endpoint to scrape:
# Here it's Prometheus itself.
scrape_configs:
  # The job name is added as a label `job=<job_name>` to any timeseries scraped from this config.
  # promrtheus self monitor
  - job_name: 'prometheus'
    # metrics_path defaults to '/metrics'
    # scheme defaults to 'http'.
    static_configs:
      - targets: ['192.168.x.x:9090']
Detailed configuration documents refer to official documents:
https://prometheus.io/docs/operating/configuration/
Start prometheus service after configuration
./prometheus
Logs will be printed
[elk@stes04 prometheus-2.0.0-beta.0.linux-amd64]$ ./prometheus
INFO[0000] Starting prometheus (version=2.0.0-beta.0, branch=master, revision=2b5d9159537cbd123219296121e05244e26c0940)  source="main.go:202"
INFO[0000] Build context (go=go1.8.3, user=root@fc24486243df, date=20170712-12:21:13)  source="main.go:203"
INFO[0000] Host details (Linux 2.6.32-431.el6.x86_64 #1 SMP Sun Nov 10 22:19:54 EST 2013 x86_64 stes04 (none))  source="main.go:204"
INFO[0000] Starting tsdb                                 source="main.go:216"
INFO[0003] tsdb started                                  source="main.go:222"
INFO[0003] Loading configuration file prometheus.yml     source="main.go:351"
INFO[0003] Listening on 0.0.0.0:9090                     source="web.go:286"
INFO[0003] Starting target manager...                    source="targetmanager.go:67"
ts=2017-08-04T08:00:00.509734185Z caller=db.go:867 msg="created head block" ulid=01BPP447C81JM9X134YDJYTTME mint=1501833600000 maxt=1501840800000
Browser Open http://localhost:9090/metrics Look directly at the data collected by the Prometheus service. 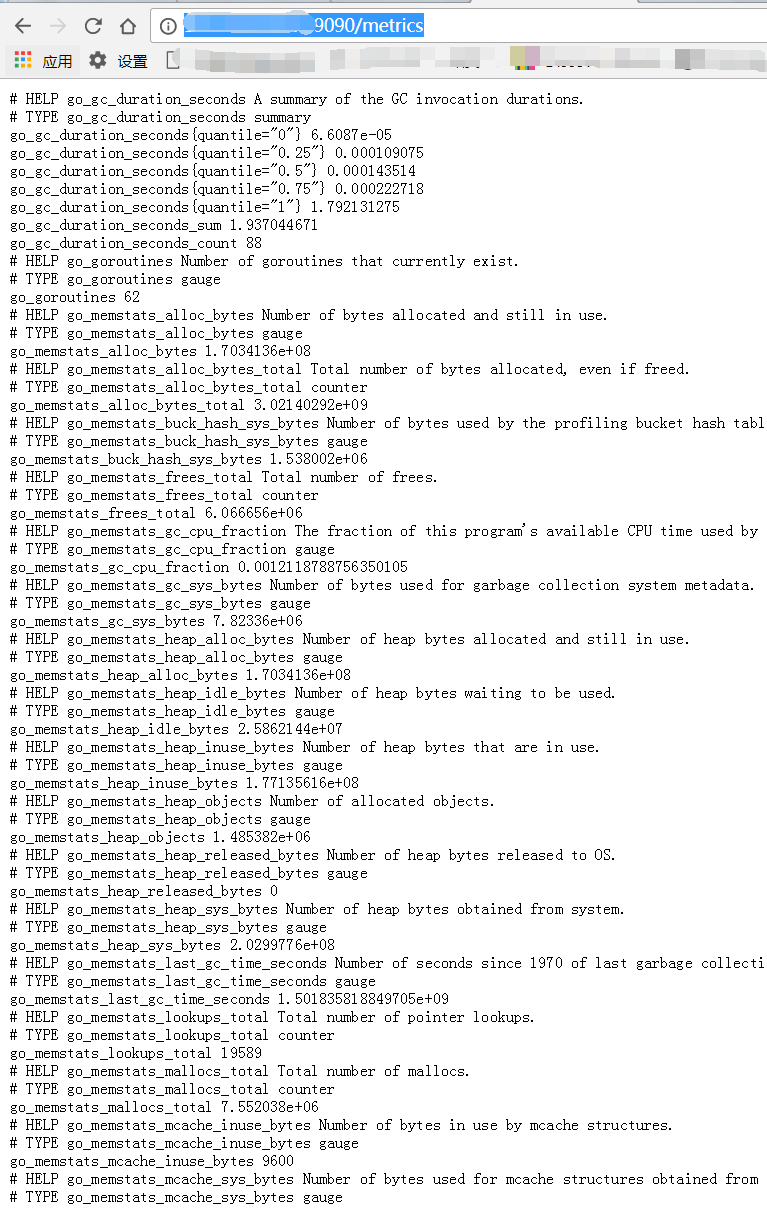
http://localhost:9090/graph 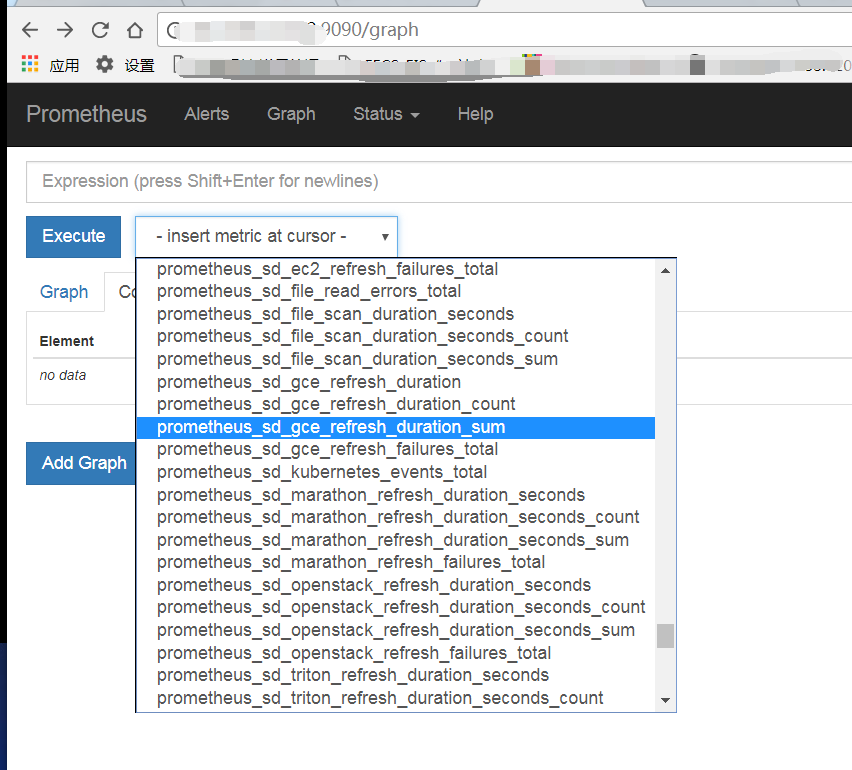
To see the Prometheus indicators, great success!
Now that Prometheus has completed its first experiment, you can try Prometheus to grab data from other applications.
3. This trial prometheus mainly monitors elastic search and logstash in elk
clicent of prometheus collects data and provides http service. prometheus server pull s data actively.
3.1 The elastic search data is plugged in by es
Realization: https://github.com/vvanholl/elasticsearch-prometheus-exporter
3.1.1 Plug-in Download
At present, es5.4 is on trial. https://github.com/vvanholl/elasticsearch-prometheus-exporter/releases Download the corresponding version of the plug-in
3.1.2 Installation Plug-ins
Sh. / bin / elastic search-plugin install file:///home/elk/elastic search-prometheus-exporter-5.4.0.0.zip, restart es. Default Index Directory: http://192.168.x.x:9200/_prometheus/metrics
http://192.168.x.x:9200/_prometheus/metrics You can see the prometheus indicators of es, indicating that the plug-in was installed successfully. 
3.2 Configure prometheus server to pull es data
# my global config
global:
  scrape_interval:     15s # Set the scrape interval to every 15 seconds. Default is every 1 minute.
  evaluation_interval: 15s # Evaluate rules every 15 seconds. The default is every 1 minute.
  # scrape_timeout is set to the global default (10s).

  # Attach these labels to any time series or alerts when communicating with
  # external systems (federation, remote storage, Alertmanager).
  external_labels:
      monitor: 'codelab-monitor'

# Load rules once and periodically evaluate them according to the global 'evaluation_interval'.
rule_files:
  # - "first.rules"
  # - "second.rules"
  #  - "prometheus.rules"
# A scrape configuration containing exactly one endpoint to scrape:
# Here it's Prometheus itself.
scrape_configs:
  # es motitor
  - job_name: elasticsearch
    scrape_interval: 10s
    metrics_path: "/_prometheus/metrics"
    static_configs:
      - targets: ['192.168.x.x:9200']
The path of ps:es index must be /_prometheus/metrics, otherwise prometheus server can't pull out es index data. 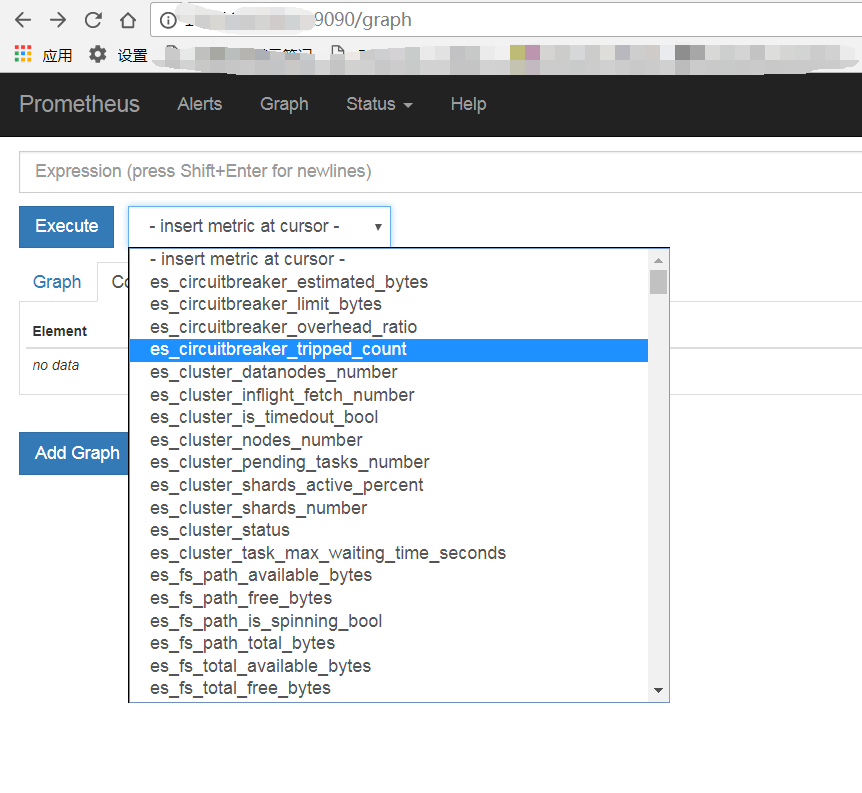
At this point, prometheus can display the es index normally.