23. Monitoring prometheus
Official documents: https://prometheus.io/docs
https://github.com/coreos/prometheus-operator
https://www.qikqiak.com/k8strain/monitor/prometheus/
I brief introduction
1. Component architecture
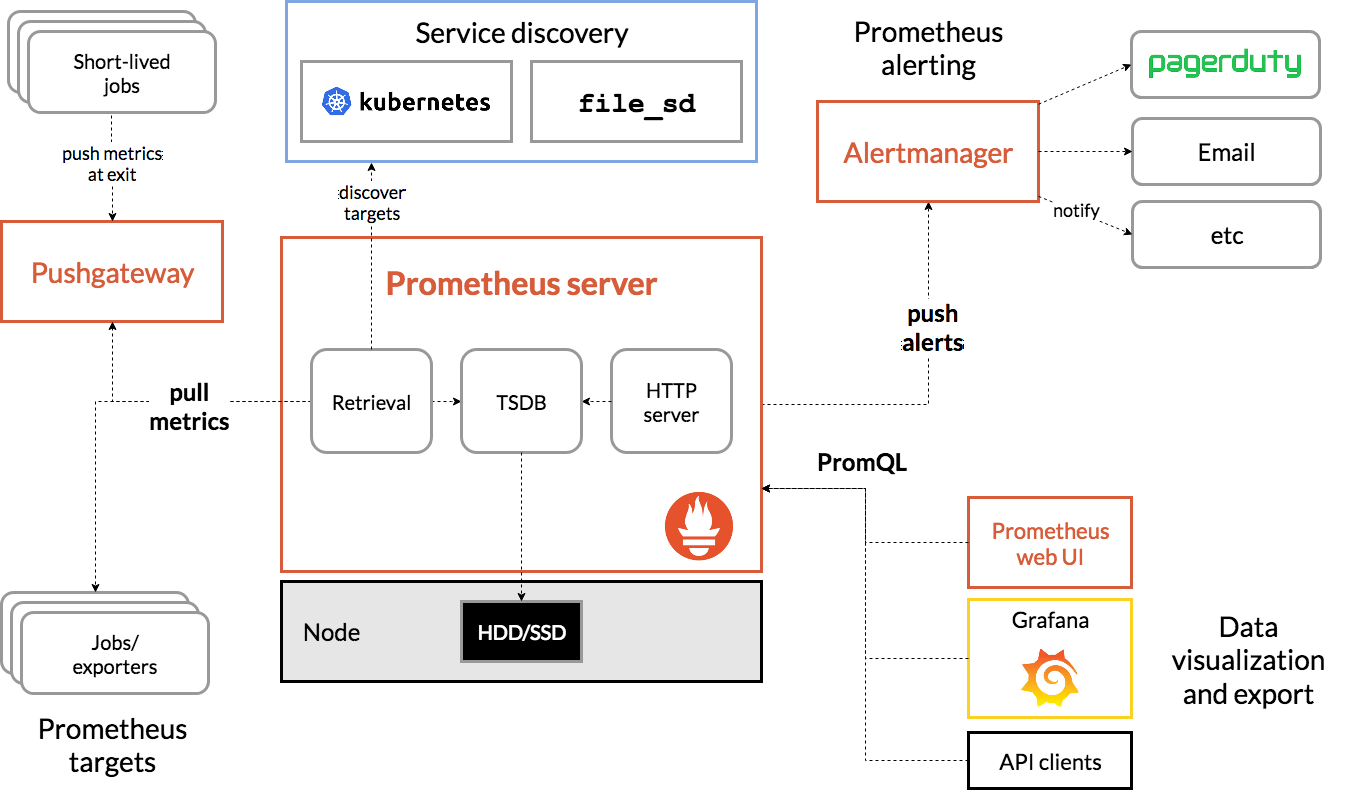
Prometheus Server
The core component of the service pulls and stores monitoring data from the Exporter through pull metrics, and provides a set of flexible query language (PromQL).
Pushgateway
Similar to a transfer station, it receives the data actively pushed and waits for the Prometheus Server to pull the data.
Some nodes can only push data in push mode for some reasons. For example, the pull action of Prometheus Server has intervals. If some containers or tasks survive for a short time, they may end before Prometheus Server comes to find them. Therefore, these containers or tasks need to actively send their own monitoring information to Prometheus, The Pushgateway receives and temporarily transfers these active push data.
Jobs/Exporter
It is responsible for collecting the performance data of the target object (host, container...) and providing it to the Prometheus Server through the HTTP interface.
Export er means that some applications may not have their own / metrics interface for Prometheus. In this case, we need to use additional exporter services to provide indicator data for Prometheus. For more exports, please see: https://prometheus.io/docs/instrumenting/exporters/
Service Discovery
Prometheus supports a variety of service discovery mechanisms: file, DNS, Consul,Kubernetes,OpenStack,EC2, etc.
The process of service discovery is not complicated. Through the interface provided by a third party, Prometheus queries the list of targets to be monitored, and then polls these targets to obtain monitoring data.
Alertmanager
After receiving alerts from the Prometheus server, it will remove duplicate data, group, route to the other party's acceptance method, and send an alarm. Common receiving methods include email, pageduty, etc.
2. Brief description of Prometheus configuration file
Binary can be installed through/ prometheus --config.file=prometheus.yml to specify the configuration file to run Prometheus. In k8s, the configuration file is generally saved in the form of configmap, and then used by mounting
The basic configuration of the configuration file is as follows
global:
  scrape_interval:     15s
  evaluation_interval: 15s
rule_files:
  # - "first.rules"
  # - "second.rules"
scrape_configs:
  - job_name: prometheus
    static_configs:
      - targets: ['localhost:9090']
The global module controls the global configuration of Prometheus Server:
scrape_interval: indicates the frequency at which prometheus grabs indicator data. The default value is 15s. We can override this value
evaluation_interval: used to control the frequency of evaluating rules. prometheus uses rules to generate new time series data or generate alerts
rule_files: Specifies the location of the alarm rule. prometheus can load the rule according to this configuration to generate new time series data or alarm information. At present, we have not configured any alarm rules.
scrape_configs is used to control which resources prometheus monitors. A job monitoring prometheus itself is configured here. If other resources need to be monitored, add the configuration here.
If prometheus is mentioned below YML refers to the prometheus configuration file. Other detailed configuration usage will be described below.
Binary installation can be through https://prometheus.io/download Download Prometheus. There is no extension here
II k8s deployment configuration prometheus
Create namespace: Kube mon in advance
1.prometheus-cm.yaml see
Configmap saves the prometheus configuration, and then modifies the prometheus configuration by modifying configmap
2.prometheus-rbac.yaml see
3.prometheus-dp.yaml see
- prometheus performance and data persistence. Here, we will directly persist data through hostPath
- --storage.tsdb.path=/prometheus specify the data directory in the container, and then mount the directory declaration to the host / data/prometheus
- The nodeSelector pins the Pod to a node with a monitor=prometheus tag
Label the target node: kubectl label node 172.10.10.21 monitor=prometheus
4.prometheus-svc.yaml
apiVersion: v1
kind: Service
metadata:
  name: prometheus-nodeport
  namespace: kube-mon
  labels:
    app: prometheus
spec:
  selector:
    app: prometheus
  type: NodePort
  ports:
    - name: web
      port: 9090
      targetPort: http
      nodePort: 8003
Create a NodePort type service to access the prometheus page
http://172.10.10.21:8003
The current prometheus is a single node, which can meet the basic use. How to build a highly available prometheus? In the future, we will try to build prometheus-operator
III Using prometheus
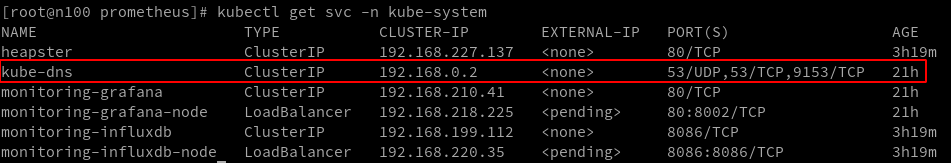
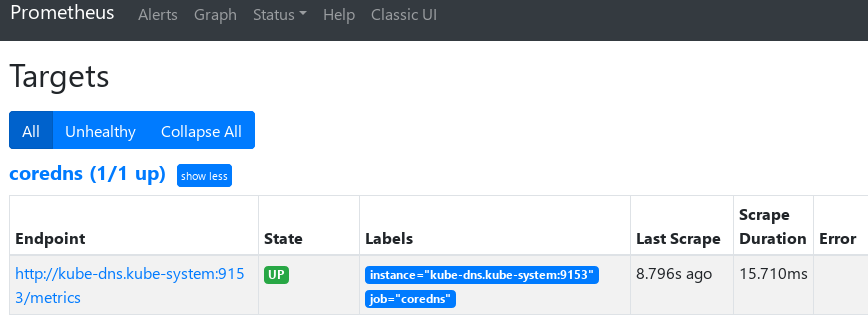
1. Monitor coreDns service
When we deployed coreDns, we configured prometheus: 9153 in the configMap. You must have guessed that coreDns itself provides the / metrics interface. We can directly configure prometheus for monitoring
prometheus.yaml addition
    scrape_configs:
    - job_name: 'coredns'
      static_configs:
      - targets: ['kube-dns.kube-system:9153']
Use Kube DNS Kube system is because prometheus and coreDns are not in the same namespace, so the namespace is brought when writing the service domain name
2. Monitoring traefik services
- traefik add parameter to enable metrics
--metrics=true
--metrics.prometheus=true
--metrics.prometheus.buckets=0.100000, 0.300000, 1.200000, 5.000000
--metrics.prometheus.entryPoint=traefik
-
Test metrics interface
curl http://192.168.177.109:8080/metrics
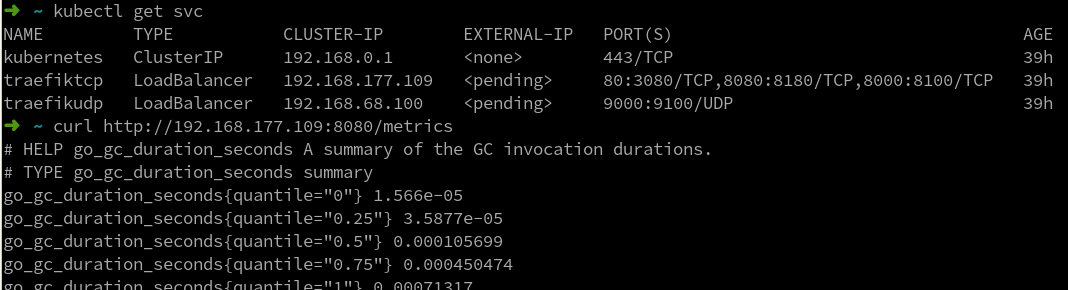
-
prometheus configuration job
    - job_name: 'traefik'
      static_configs:
        - targets: ['traefiktcp.default:8080']
Here's traefik TCP Default is the domain name of traefik svc in coreDns
curl -XPOST http://172.20.101.3:9090/ -/Reload overload prometheus configuration
Grab a screenshot of grafana to show the effect, and then explain the configuration and use of grafana in detail
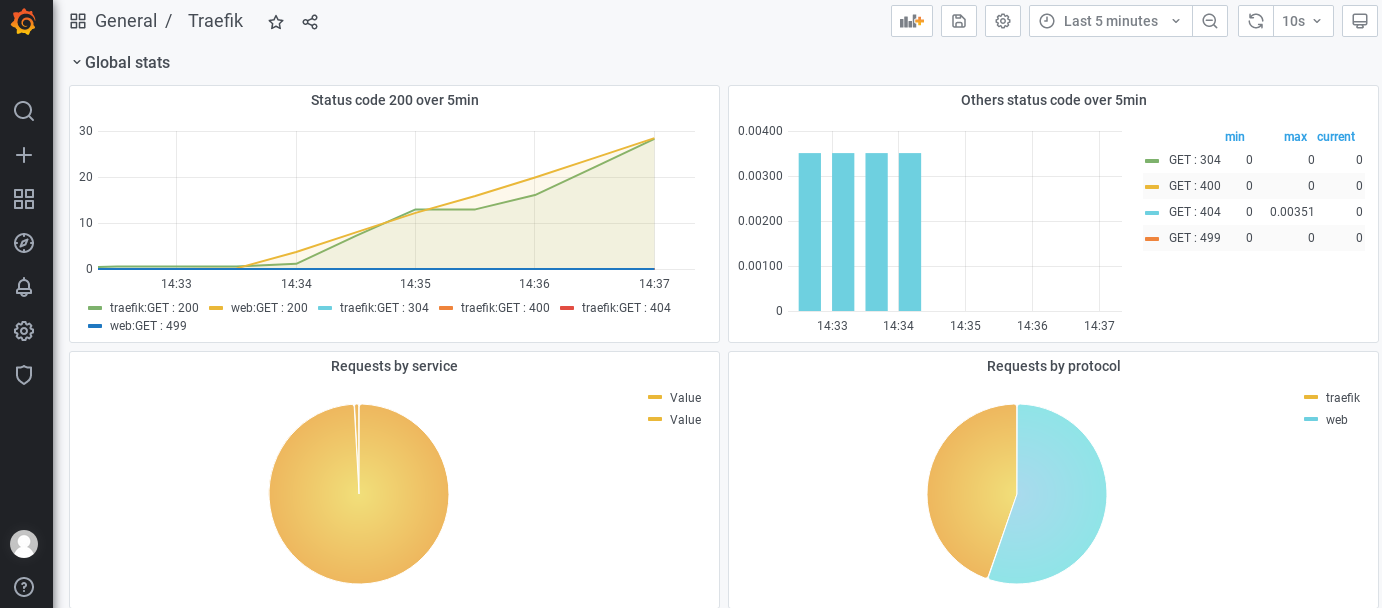
In the next section, let's see how to use grafana. After grafana is ready, we can monitor the k8s cluster
3. Monitor ingress nginx
- Add metrics service
The ingress nginx installed in the previous sections has its own metrics interface. We only need to expose it through svc
apiVersion: v1
kind: Service
metadata:
  name: ingress-nginx-metrics
  namespace: ingress-nginx
  labels:
    app.kubernetes.io/name: ingress-nginx
    app.kubernetes.io/part-of: ingress-nginx
spec:
  type: ClusterIP
  ports:
    - name: metrics
      port: 10254
      targetPort: 10254
      protocol: TCP
  selector:
    app.kubernetes.io/name: ingress-nginx
    app.kubernetes.io/part-of: ingress-nginx
- View svc and test
➜  ~ kubectl get svc -n ingress-nginx
NAME                    TYPE        CLUSTER-IP        EXTERNAL-IP   PORT(S)                    AGE
ingress-nginx           NodePort    192.168.175.255   <none>        80:8480/TCP,443:8443/TCP   59m
ingress-nginx-metrics   ClusterIP   192.168.201.61    <none>        10254/TCP                  21m
➜  ~ curl http://192.168.201.61:10254/metrics
go_gc_duration_seconds{quantile="0"} 9.336e-06
go_gc_duration_seconds{quantile="0.25"} 1.7991e-05
go_gc_duration_seconds{quantile="0.5"} 3.8044e-05
go_gc_duration_seconds{quantile="0.75"} 0.000102869
......
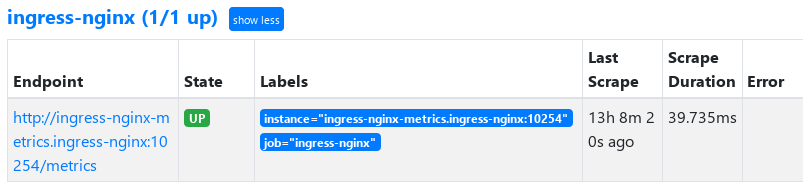
- Configure prometheus monitoring
    - job_name: 'ingress-nginx'
      static_configs:
        - targets: ['ingress-nginx-metrics.ingress-nginx:10254']
reload prometheus
Later, extend grafana to display monitoring statistics
Think about a problem. If you start traefik or ingress nginx of multiple nodes, the monitoring interface configured here obtains the monitoring information of different nodes every time, and its statistical data is inaccurate. The ideal statistical data is the summary of the data of multiple nodes. How to deal with this problem?
appendix
- prometheus-cm.yaml
apiVersion: v1
kind: ConfigMap
metadata:
  name: prometheus-config
  namespace: kube-mon
data:
  prometheus.yml: |
    global:
      scrape_interval: 15s
      scrape_timeout: 15s
    scrape_configs:
    - job_name: 'prometheus'
      static_configs:
      - targets: ['localhost:9090']
- prometheus-rbac.yaml
apiVersion: v1
kind: ServiceAccount
metadata:
  name: prometheus
  namespace: kube-mon
---
apiVersion: rbac.authorization.k8s.io/v1
kind: ClusterRole
metadata:
  name: prometheus
rules:
- apiGroups:
  - ""
  resources:
  - nodes
  - services
  - endpoints
  - pods
  - nodes/proxy
  verbs:
  - get
  - list
  - watch
- apiGroups:
  - "extensions"
  resources:
    - ingresses
  verbs:
  - get
  - list
  - watch
- apiGroups:
  - ""
  resources:
  - configmaps
  - nodes/metrics
  verbs:
  - get
- nonResourceURLs:
  - /metrics
  verbs:
  - get
---
apiVersion: rbac.authorization.k8s.io/v1beta1
kind: ClusterRoleBinding
metadata:
  name: prometheus
roleRef:
  apiGroup: rbac.authorization.k8s.io
  kind: ClusterRole
  name: prometheus
subjects:
- kind: ServiceAccount
  name: prometheus
  namespace: kube-mon
- prometheus-dp.yaml
apiVersion: apps/v1
kind: Deployment
metadata:
  name: prometheus
  namespace: kube-mon
  labels:
    app: prometheus
spec:
  selector:
    matchLabels:
      app: prometheus
  template:
    metadata:
      labels:
        app: prometheus
    spec:
      serviceAccountName: prometheus
      nodeSelector:
        monitor: prometheus    # Deploy to the specified node to prevent pod drift
      containers:
      - image: prom/prometheus:v2.26.0
        name: prometheus
        args:
        - "--config.file=/etc/prometheus/prometheus.yml"
        - "--storage.tsdb.path=/prometheus"  # Specify tsdb data path
        - "--storage.tsdb.retention.time=24h"
        - "--web.enable-admin-api"  # Controls access to the admin HTTP API, including functions such as deleting time series
        - "--web.enable-lifecycle"  # Support hot update. Execute localhost:9090/-/reload directly and take effect immediately
        - "--web.console.libraries=/usr/share/prometheus/console_libraries"
        - "--web.console.templates=/usr/share/prometheus/consoles"
        ports:
        - containerPort: 9090
          name: http
        volumeMounts:
        - mountPath: "/etc/prometheus"
          name: config-volume
        - mountPath: "/prometheus"
          name: data
        resources:
          requests:
            cpu: 100m
            memory: 512Mi
          limits:
            cpu: 100m
            memory: 512Mi
      securityContext:
        runAsUser: 0    # runAsUser=0 specifies that the running user is root, otherwise the container may not have permission to use the host volumes mounted below
      volumes:
      - name: data
        hostPath:
          path: /data/prometheus/
      - name: config-volume
        configMap:
          name: prometheus-config