1 installation
Install 1 (successful)
Mayavi's pip installation support is not good, so it is installed with a compiled whl file. The installation method is as follows. Mayavi and its test environment are:
# win10 system
# conda's new clean environment
# python version is 3.8
# Mayavi version is 4.7.3
The installation commands are as follows:
conda create -n env_name python=3.8
You need to install the following files (including versions) as follows:
- VTK==8.2
- Mayavi==4.7.3
- PyQt5==5.15.4
Among them, there is only vtk9 due to pip3 0 or above, so download the whl file before installing. whl downloaded from Unofficial Windows Binaries for Python Extension Packages , file name: VTK ‑ 8.2.0 ‑ cp38 ‑ cp38 ‑ win_amd64.whl. Where cp38 indicates that the python version is 3.8; AMD64 represents a 64 bit system. The installation commands are as follows:
# Activate environment
conda activate env_name
# Install VTK first
pip3 install xxxx route\VTK‑8.2.0‑cp38‑cp38‑win_amd64.whl
# Installing mayavi via pip
pip3 install mayavi==4.7.3
# PyQt5 is installed through pip. Version 5.15.4 is installed by default. It is found to be available
pip3 install PyQt5
There is also a visual data package called menpo, but no detailed query has been done. mark here first.
Installation 2 failed (unresolved)
Mayavi's pip installation support is not good, and the installation with the compiled whl file failed. So use the following method to install mayavi. The test environment is:
# win10 system
# conda's new clean environment
# python version is 3.7 (as of 20210721, Mayavi under conda does not support python version above 3.7)
The commands for creating a new environment are as follows:
# conda creates a new clean environment with python version 3.8
conda create -n env_name python=3.7
The Mayavi installation command is as follows:
# It has been found that the current maximum version is mayavi==4.7.1
conda install mayavi
Error reporting in actual operation:
********************************************************************************
WARNING: Imported VTK version (9.0) does not match the one used
         to build the TVTK classes (8.2). This may cause problems.
         Please rebuild TVTK.
********************************************************************************
Unresolved!
2 Mayavi's Python API
according to Mayavi's documentation , Mayavi's basic Python API has the following:
from mayavi import mlab

# 0D and 1D data
mlab.points3d()
mlab.plot3d()

# 2D data
mlab.imshow()
mlab.surf()
mlab.contour_surf()
mlab.mesh()
mlab.barchart()
mlab.triangular()

# 3D data
mlab.contour3d()
mlab.quiver3d()
mlab.flow()
volume_slice()
This article only introduces several API functions I actually use.
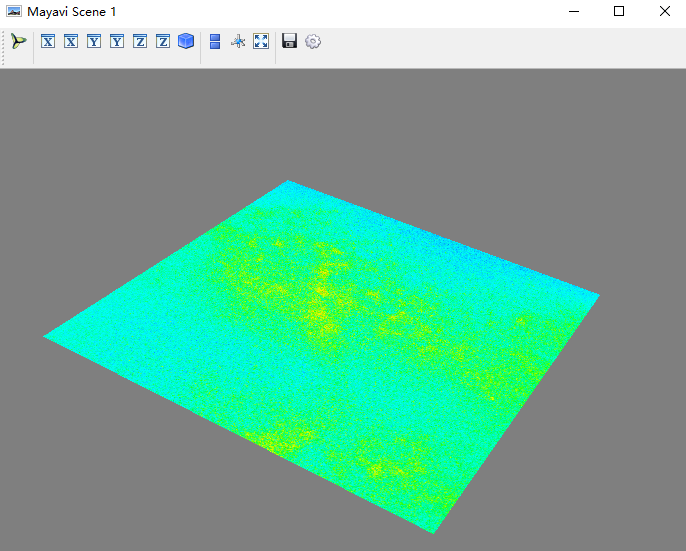
mayavi.mlab.imshow()
- Function function:
Display a two-dimensional array in the form of pictures.
- Usage:
from mayavi import mlab
img = xxxx  # img is a 2D nunmpy array
mlab.imshow(img)
mlab.show(
- Effect display:
mayavi.mlab.mesh()
- Function function:
The object surface is displayed in the form of mesh.
- mesh Description:
The following figure comes from Thousands of Sama's articles , it intuitively shows what mesh is. The original text has the gif animation shown in the figure below. Among them, each intersection is a grid point, and the matrix describing the coordinates of these grid points is the coordinate matrix. Each grid point needs three coordinate representations: x, y and z.
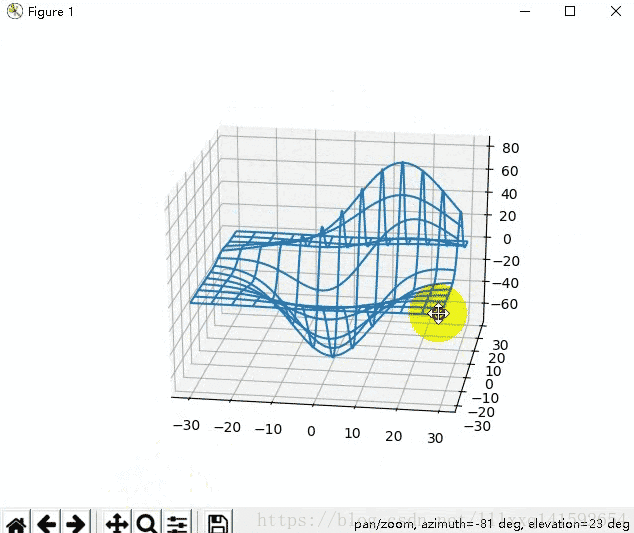
However, x, y and z are generally expressed in the form of two-dimensional matrix. for instance:
x = [[0, 1, 2],
	 [0, 1, 2],
	]
y = [[0, 0, 0],
	 [1, 1, 1],
	]
z = [[1, 2, 3],
	 [4, 5, 6],
	]
It means there are 6 points in total, which is a 3 x 2 Grid of. among:
	x There are three columns in the direction:[0, 1, 2]
	y There are 2 lines in the direction:[0, 1]
z The value of represents the value at the corresponding position z Axis value.
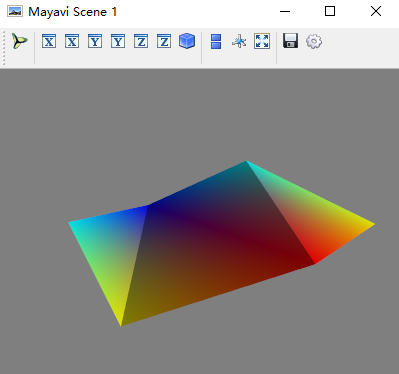
- Usage:
from mayavi import mlab

# Using numpy array may be better
x = [[0, 1, 2],
	 [0, 1, 2],
	]
y = [[0, 0, 0],
	 [1, 1, 1],
	]
z = [[1, 2, 1],
	 [-1, -2, -1],
	]
mlab.mesh(x, y, z)
mlab.show(
- Effect display:
mayavi.mlab.points3d()
- Function function:
The three-dimensional discrete points are represented in the form of balls.
- Usage:
Reference Big blue whale - blog Park article.
from mayavi import mlab

# Using numpy array may be better
x = [1, 2, 3, 4, 5]
y = [1, 2, 3, 4, 5]
z = [1, 2, 3, 4, 5]

s = [1.5, 4.7, -0.112, -3]
def f(x, y, z):
	return x + y - z

mlab.points3d(x, y, z)
or
mlab.points3d(x, y, z, s)
or
mlab.points3d(x, y, z, f)

mlab.show()
- Effect display: