Introduction: a solution for any IT infrastructure, service, application and resource monitoring
Bottleneck: the performance of mysql database will be the biggest bottleneck of zabbix
Core tasks: data collection, storage and display, followed by alarm notification
Key points: template making (key points); Distributed monitoring (proxy); Email wechat notification; Fault self-healing; Batch installation of agent; AIP
zabbix web: displays the collected server data in the form of web
zabbix server: the core service component of zabbix
zabbix proxy: when the service cluster is large, you need to join zabbix proxy, otherwise the update speed of ZABBIX server service will be very slow
zabbix agent: installed on the server to be monitored. It is responsible for collecting the information of the server and sending it to zabbix proxy or zabbix_proxy
zabbix installation:
The difference between active mode and passive mode of zabbix:
Whether it's mode or passive mode, it's standing on ZABBIX_ The working mode of agent;
Passive mode: zabbix_agent passively accepts ZABBIX_ The server sends instructions to collect data, and then sends it to ZABBIX through TCP protocol_ On the server, the zabbix server does not respond until it sends the zabbix agent, so the zabbix agent does not care about its monitoring items and data collection cycle interval. The disadvantage is that passive mode will increase zabbix_server workload, ZABBIX in the environment of more than hundreds of servers_ Server rotation training, all servers will ZABBIX_ The load of the server itself is very high, which will also lead to the failure to obtain the latest data in time; However, the configuration of passive mode is relatively simple and is set to the default mode;
Active mode: zabbix_agen takes the initiative to send the collected data to periodically
In the active mode, the zabbix agent initiates a tcp connection request to the 10051 port of the zabbix server. Therefore, in the active mode, the IP or host name of the zabbix server must be specified in the zabbixagent configuration file (which must be resolved to an IP address). Before connecting to the zabbix server, the zabbix agent does not know what data it wants to collect and how often it collects data, Then, after connecting to the zabbix server, get your own monitoring items and data collection interval, and then collect data according to the monitoring items and return it to the zabbix server. In the active mode, the zabbix server is no longer required to initiate connection requests to the zabbix agent. Therefore, the active mode can reduce the number of local random ports and processes opened by the zabbix server to a certain extent, Reduce the pressure of watching zabbix server to a certain extent;
1) zabbix installation:
1: Compile and install zabbix
2: Prepare databasewget https://jaist.dl.sourceforge.net/project/zabbix/ZABBIX%20Latest%20Stable/4.0.16/zabbix-4.0.16.tar.gz groupadd -g 1001 zabbix useradd -u 1001 -g 1001 zabbix tar xf zabbix-4.0.30.tar.gz cd zabbix-4.0.30/ #Dependency yum install gcc libxml2-devel net-snmp net-snmp-devel curl curl-devel php php-bcmath php-mbstring mariadb mariadb-devel libevent-devel java-1.6.0-openjdk-devel php-mysqlc php-gd php-xmlwriter php-ldap -y ./configure --prefix=/apps/zabbix_server --enable-server --enable-agent --with-mysql --with-net-snmp --with-libcurl --with-libxml2 --enable-java && make install
#Install database:

. /etc/init.d/functions

PA=mariadb-10.2.25-linux-x86_64.tar.gz

getent passwd mysql || groupadd -r -g 306 mysql && useradd -r -u 306 -g 306 -d /data/mysql -s /sbin/nologin mysql

mkdir /data/mysql

chown 306:306 /data/mysql

tar xf ${PA} -C /usr/local/ && action "The file has been extracted to $INPATH" || action "Decompression failed" fales

cd /usr/local/

ln -sv ` echo $PA | sed -nr 's@(.*)\.tar\.gz@\1@p'` mysql &> /dev/null && action "Soft link created successfully"

chown -R root:root mysql/

cd /usr/local/mysql/

./scripts/mysql_install_db --datadir=/data/mysql --user=mysql && action "Create database file"

mkdir /etc/mysql/

cp support-files/my-huge.cnf /etc/mysql/my.cnf

sed -i '/\[mysqld\]/a\datadir=/data/mysql' /etc/mysql/my.cnf && action "And the configuration file is complete"

cp /usr/local/mysql/support-files/mysql.server /etc/init.d/mysqld

chkconfig --list

chkconfig --add mysqld

chkconfig --list

service mysqld start

service mysqld stop

systemctl start mysqld.service && action "mysql Program started successfully"

mysql -uroot -h192.168.37.105 -e "create database zabbix_server character set utf8 collate utf8_bin;"

mysql -uroot -h192.168.37.105 -e "grant all on abbix_server.* to zabbix@'192.168.37.%' identified by 'lijian';"

#In ZABBIX_ Enter the data path on the server and perform the three data initialization in order;

mysql -uzabbix -plijian -h192.168.37.105 zabbix_server < schema.sql

mysql -uzabbix -plijian -h192.168.37.105 zabbix_server < images.sql

mysql -uzabbix -plijian -h192.168.37.105 zabbix_server < data.sql
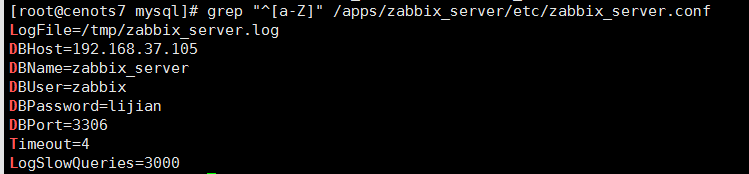
#Configure zabbix_server

vim /apps/zabbix_server/etc/zabbix_server.conf

grep "^[a-Z]" /apps/zabbix_server/etc/zabbix_server.conf

LogFile=/tmp/zabbix_server.log

DBHost=192.168.37.105

DBName=zabbix_server

DBUser=zabbix

DBPassword=lijian

DBPort=3306

Timeout=4

LogSlowQueries=3000
#Solve php error reporting#Try starting zabbix_server /apps/zabbix_server/sbin/zabbix_server -c /apps/zabbix_server/etc/zabbix_server.conf tail /tmp/zabbix_server.log #Copy php files mkdir /var/www/html/zabbix /usr/local/src/zabbix-4.0.30 cd /usr/local/src/zabbix-4.0.30/frontends/php/ cp -a . /var/www/html/zabbix/ #Install and start httpd systemctl start httpd

vim /etc/php.ini

post_max_size=16M

max_execution_time=300

max_input_time=300

date.timezone =Asia/Shanghai

systemctl restart mysqld

systemctl restart httpd

Save / var / www / HTML / ZABBIX / conf / ZABBIX Conf.php file
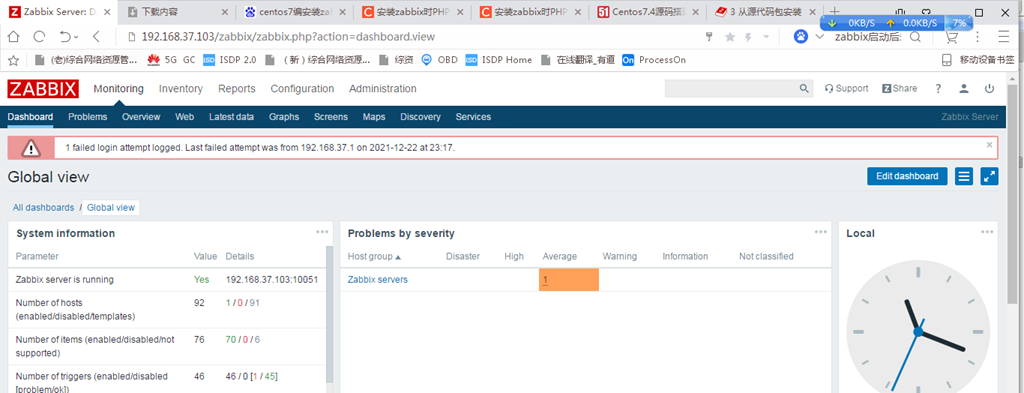
Login succeeded:
Start zabbix agent:
# /apps/zabbix_server/sbin/zabbix_agentd
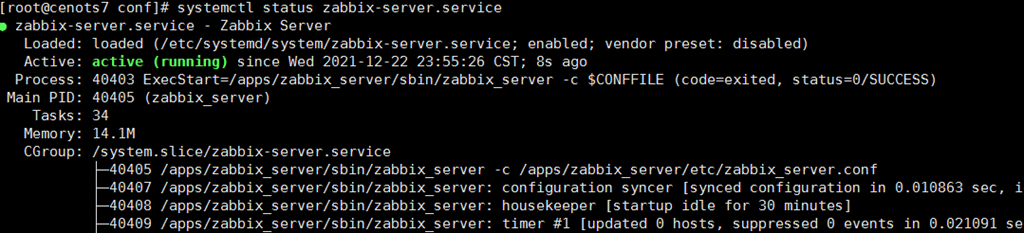
verification

#zabbix server startup file
#Stop the current zabbix server process first

pkill zabbix_server

cat > /etc/systemd/system/zabbix-server.service << EOF

[Unit]

Description=Zabbix Server

After=syslog.target

After=network.target

[Service]

Environment="CONFFILE=/apps/zabbix_server/etc/zabbix_server.conf"

EnvironmentFile=-/etc/default/zabbix-server

Type=forking

Restart=on-failure

PIDFile=/tmp/zabbix_server.pid

KillMode=control-group

ExecStart=/apps/zabbix_server/sbin/zabbix_server -c \$CONFFILE

ExecStop=/bin/kill -SIGTERM \$MAINPID

RestartSec=20s

#TimeoutSec=infinity

[Install]

WantedBy=multi-user.target

EOF

systemctl daemon-reload

systemctl enable --now zabbix-server.service
#Encounter problems
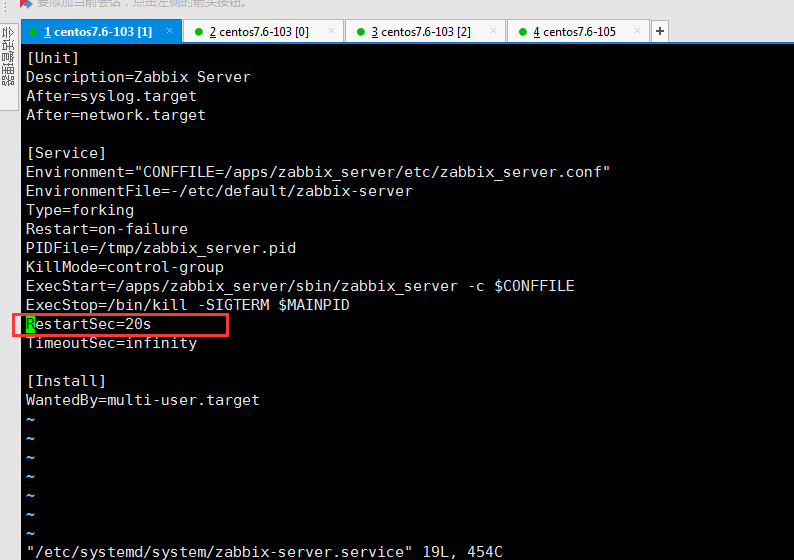
Phenomenon usage / apps/zabbix_server/sbin/zabbix_server -c /apps/zabbix_server/etc/zabbix_server.conf can be started. Modify the startup file RestartSec=10s to RestartSec=20s. The problem can be solved and the startup can be successful;
Problem screenshot
Before modification:

After modification:
#Encounter problem 2
Modify RestartSec=20s, the server still cannot be started after restart, log off #TimeoutSec=infinity, and the emotional problem cannot be solved after restart;

Web interface Chinese menu environment:
current version

Also in the chart is English:

Find the font on the control panel of window, select your favorite Chinese font and copy it to the desktop

Upload the windows font file to the zabbix web directory. The specific path is / ZABBIX/WEB/PATH/assets/fonts /, as follows:
cd /var/www/html/zabbix/assets/fonts

chown zabbix.zabbix ./*

#Modify two lines

vim /var/www/html/zabbix/include/defines.inc.php

define('ZBX_GRAPH_FONT_NAME', 'msyh'); // font file name

define('ZBX_FONT_NAME', 'msyh');

#View after refreshing the page
2) Implement the active mode proxy and data collection of zabbix#Query start status journalctl -u zabbix-server -f #agent startup file pkill zabbix_agentd cat > /etc/systemd/system/zabbix-agent.service <<EOF [Unit] Description=Zabbix Agent After=syslog.target After=network.target [Service] Environment="CONFFILE=apps/zabbix_server/etc/zabbix_agentd.conf" EnvironmentFile=-/etc/default/zabbix-agent Type=forking Restart=on-failure PIDFile=/tmp/zabbix_agentd.pid KillMode=control-group ExecStart=/apps/zabbix_server/sbin/zabbix_agentd -c \$CONFFILE ExecStop=/bin/kill -SIGTERM \$MAINPID RestartSec=10s User=zabbix Group=zabbix [Install] WantedBy=multi-user.target EOF systemctl daemon-reload systemctl status zabbix-agent.service
Passive mode data acquisition
Install ZABBIX agen
yum install zabbix40-agent.x86_64
Profile:
# vim /etc/zabbix/zabbix_agentd.conf

##### Passive checks related #Passive check related configuration

Server=192.168.37.106 #Point to the current zabbix server

### Option: ListenPort

ListenPort=10050 #Listening port

ServerActive=192.168.37.106 #Active mode zabbix server address

### Option: StartAgents

StartAgents=3 #In the passive state, the number of instances (processes) started by default is 0, and no port is monitored

### Option: Hostname

Hostname=192.168.37.106 #A value that is case sensitive and unique on the zabbix server

Include=/etc/zabbix/zabbix_agentd.d/*.conf

systemctl start zabbix-agent.service

systemctl status zabbix-agent.service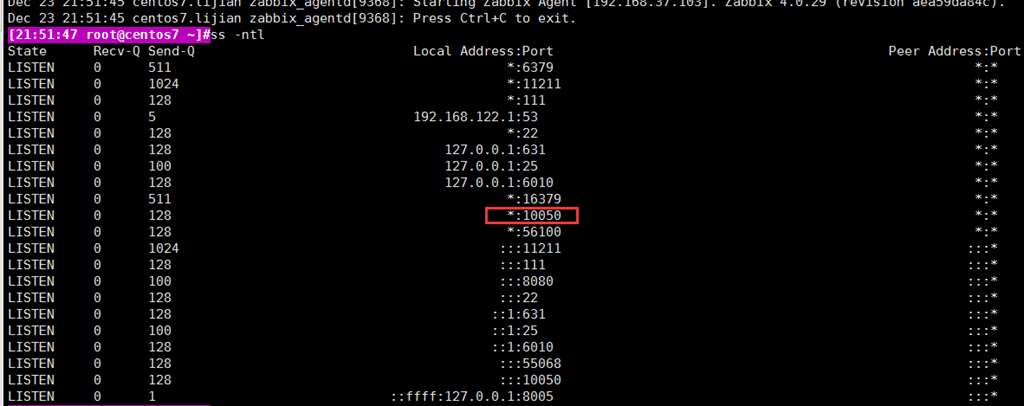
Passive mode:
Add the monitored host to the zabbix web interface: Click

Click clone:

Associated monitoring template

Add the template as follows
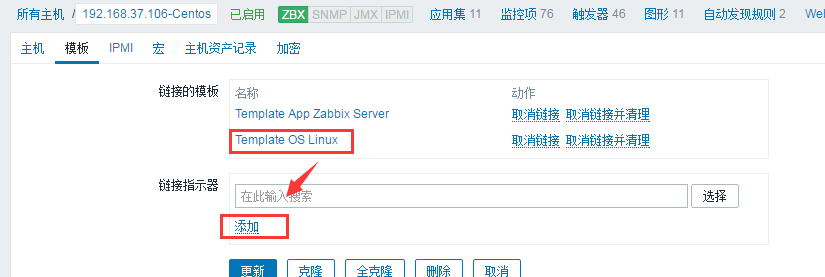
Select template

Click Add

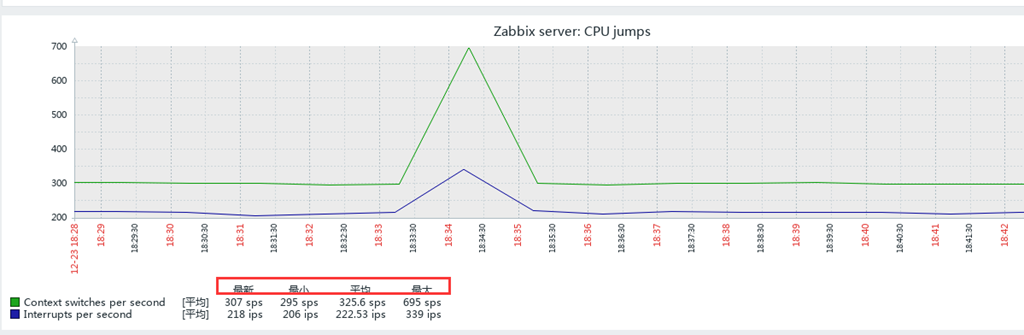
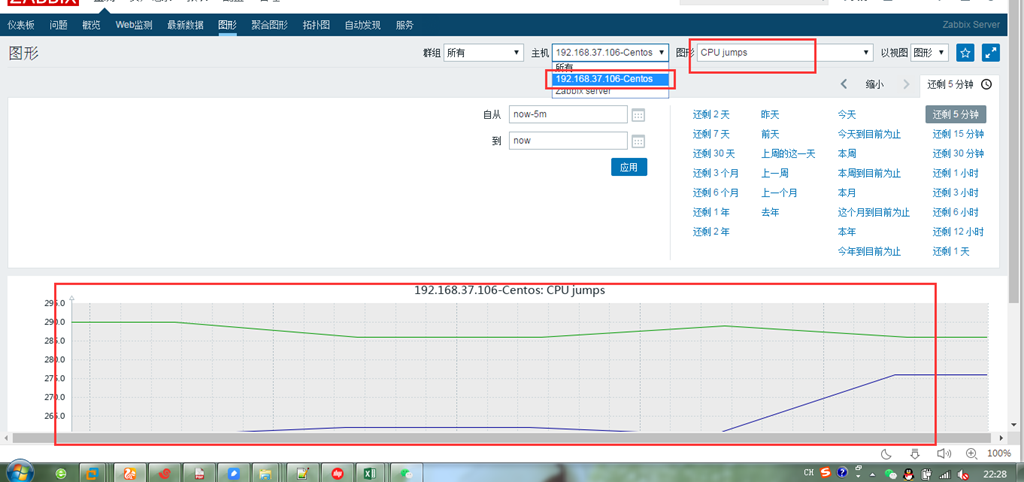
After a period of data collection, verify whether the zabbix server has the monitoring data and graphics of the newly added host. The graphics are shown as follows:
Active mode monitoring:
Delete the previous host 192.168.37.106 in passive mode and modify it to active mode again;
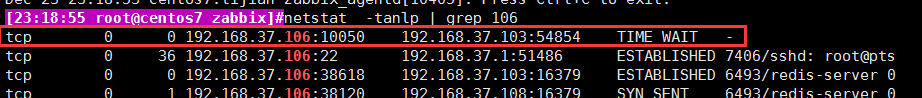
Modify 106's configuration file

systemctl start zabbix-agent.service

netstat -tanlp | grep 106
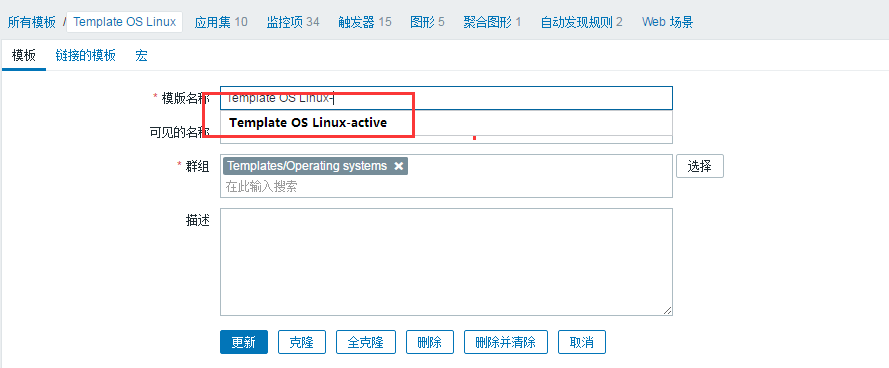
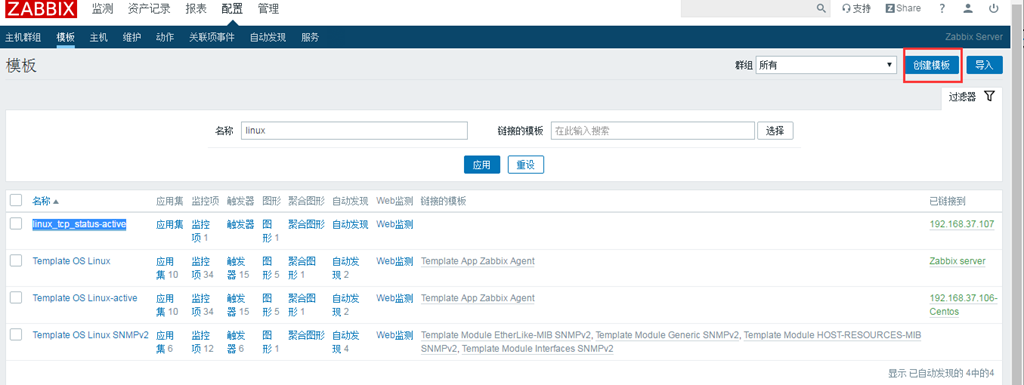
Create a template for active mode
1) Click a template to clone; Modify name
2) Click the monitoring item; Modify the active mode of monitoring items; Batch selected monitoring item names; Click batch update at the bottom;
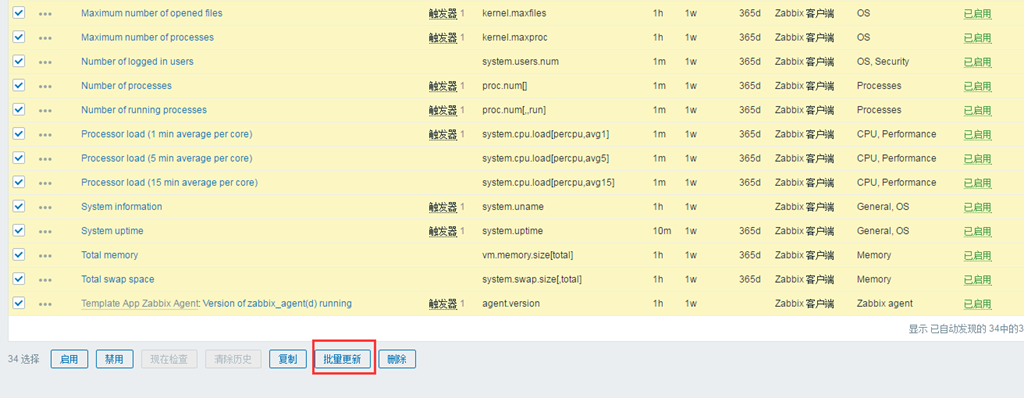
3) The modification type is active;
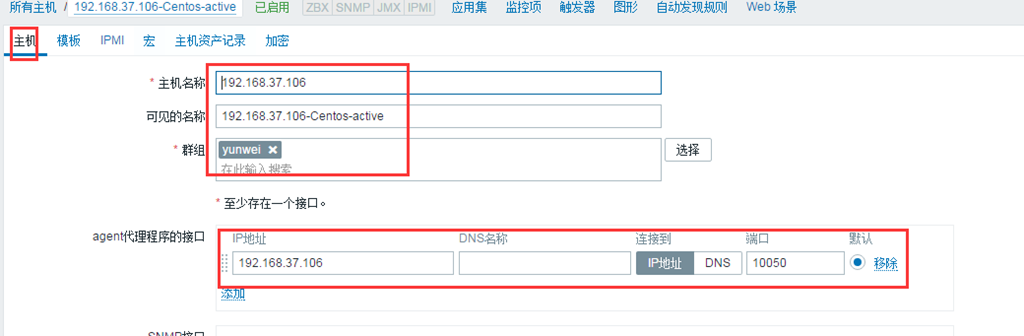
Configure host entries
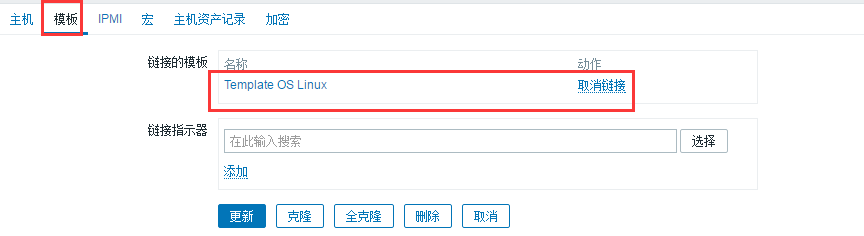
Associated template:
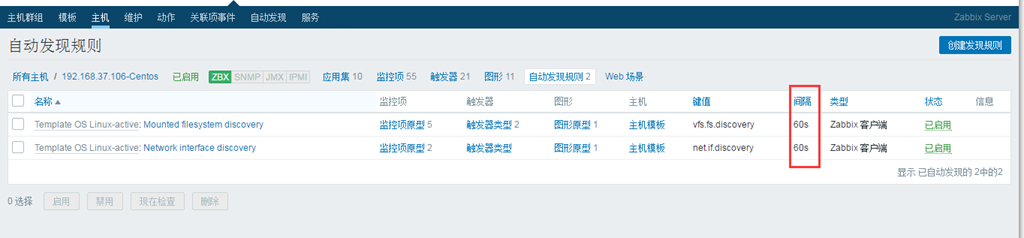
Modify autodiscover interval:
Number of connections monitoring TCP 11 status:
CLOSED: the port is CLOSED by default.
LISTEN: the server program starts listening to a port, which is the LISTEN status.
SYN_RCVD: the port status after the second handshake of the third handshake, which is the syn sent by the client_ The status after the sent packet. This status is very short and is rarely seen on the server normally. Unless the server deliberately does not send the last handshake packet, the server will set its own port to syn after returning the syn confirmation to the client_ RCVD.
SYN_SENT: SYN_ Sent status indicates that the client has sent a connection request message with SYN=1. After sending, the client will set its port status to SYN_SENT.
ESTABLISHED: indicates that the connection has been successful. After receiving the confirmation message from the server, the client will reply to the server, and then set the port to ESTABLISHED. After receiving the Ack confirmation from the client for the third time, the server will set the port to ESTABLISHED and start transmitting data.
FIN_WAIT_1: Appears on the active shutdown side, FIN_WAIT_1 status actually means that when the SOCKET is in the ESTABLISHED status, when either party wants to actively close the connection and sends a disconnection request message with FIN=1 to the other party, the SOCKET enters FIN_WAIT_1 status. When the other party responds to the ACK message, it enters FIN_WAIT_2 status. Of course, under actual normal conditions, no matter what the other party's situation, it should immediately respond to the ACK message, so FIN_WAIT_1 status is generally difficult to see, while FIN_WAIT_2. The status can often be seen with netstat.
FIN_WAIT_2: Appears on the active closing party when the passive party responds to FIN_WAIT_1, then enter FIN_WAIT_2 status
TIME_WAIT: it appears at the active shutdown party, indicating that it has received the other party's FIN request shutdown message and sent an ACK message. It can return to the CLOSED available state after waiting for 2*MSL(Max Segment Lifetime). If FIN_WAIT_1. When receiving the message with FIN flag and ACK flag from the other party, you can directly enter TIME_WAIT status without going through FIN_WAIT_2 status.
CLOSING: this state is special. It should be rare in practice. It belongs to a rare exception state. Under normal circumstances, when you send a FIN message, it is reasonable to receive (or receive) the other party's ACK message first, and then the other party's FIN message. However, the CLOSING status indicates that you did not receive the other party's ACK message after sending the FIN message, but also received the other party's FIN message. Under what circumstances will this happen? In fact, if you think about it carefully, it is not difficult to draw a conclusion: that is, if both sides close a SOCKET almost at the same time, then both sides send FIN messages at the same time, that is, the CLOSING state will appear, indicating that both sides are CLOSING the SOCKET connection.
CLOSE_WAIT: indicates that the port is waiting to be closed. This state exists on the side of passive shutdown.
LAST_ACK: when the passive closing party actively closes, one party waits for the other party's ACK message after sending FIN message. When the ACK message is received again, it can enter the CLOSED available state.
Monitoring host ip: 192.168.37.105
Compile and install zabbix_agent:
1: Installing zabbix_agent collects the data of monitoring items through commands or scripts
script:
#!/bin/bash

tar xvf zabbix-agent-onekey-install-4.0.30.tar.gz

cd zabbix-agent-onekey-install-4.0.30

DIR=`pwd`

ZBX_VERSION="4.0.30"

grep "Ubuntu" /etc/issue &> /dev/null

if [ $? -eq 0 ];then

apt update

apt-get -y install iproute2 ntpdate tcpdump telnet traceroute nfs-kernel-server nfs-common lrzsz tree openssl libssl-dev libpcre3 libpcre3-dev zlib1g-dev ntpdate tcpdump telnet traceroute gcc openssh-server lrzsz tree openssl libssl-dev libpcre3 libpcre3-dev zlib1g-dev ntpdate tcpdump telnet traceroute iotop unzip zip make

fi

grep "Kernel" /etc/issue &> /dev/null

if [ $? -eq 0 ];then

yum install vim iotop bc gcc gcc-c++ glibc glibc-devel pcre pcre-devel openssl openssl-devel zip unzip zlib-devel net-tools lrzsz tree ntpdate telnet lsof tcpdump wget libevent libevent-devel bc systemd-devel bash-completion traceroute -y

fi

tar xvf zabbix-${ZBX_VERSION}.tar.gz && cd zabbix-${ZBX_VERSION} && ./configure --prefix=/apps/zabbix_agent --enable-agent && make && make install

useradd zabbix

mkdir /apps/zabbix_agent/pid

mkdir /apps/zabbix_agent/logs

\cp ${DIR}/zabbix-agent.service /lib/systemd/system/zabbix-agent.service

\cp ${DIR}/zabbix_agentd.conf /apps/zabbix_agent/etc/zabbix_agentd.conf

\cp ${DIR}/zabbix_agentd.conf.d/* /apps/zabbix_agent/etc/zabbix_agentd.conf.d/

HOST_IP=`ifconfig eth0 | grep -w inet | awk '{print $2}'`

sed -i "s/Hostname=/Hostname=${HOST_IP}/g" /apps/zabbix_agent/etc/zabbix_agentd.conf

chown zabbix.zabbix -R /apps/zabbix_agent/

systemctl daemon-reload && systemctl enable zabbix-agent && systemctl restart zabbix-agent

To create a monitoring script:
2: In ZABBIX_ Add custom monitoring items to agent configuration and restart zabbix_agentcat > /etc/zabbix/zabbix_agentd.d/tcp_conn_plugin.sh <<EOF #!/bin/bash tcp_conn_status(){ TCP_STAT=\$1 ss -ant | awk 'NR>1 {++s[$1]} END {for(k in s) print k,s[k]}' > /tmp/tcp_conn.txt TCP_NUM=\$(grep "\$TCP_STAT" /tmp/tcp_conn.txt | cut -d ' ' -f2) if [ -z \$TCP_NUM ];then TCP_NUM=0 fi echo \$TCP_NUM } main(){ case \$1 in tcp_status) tcp_conn_status \$2; ;; esac } main \$1 \$2 EOF
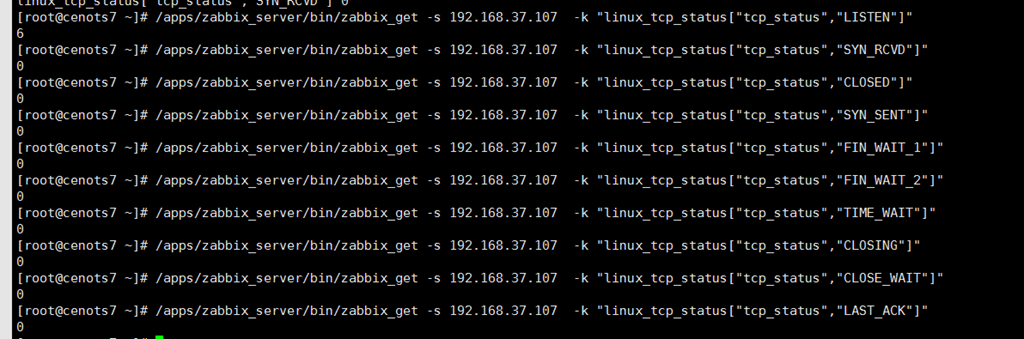
3: zabbix_server via ZABBIX_ The get command tests whether the data of the monitoring item can be obtainedcd /apps/zabbix_agent/etc/zabbix_agentd.conf.d cat > /apps/zabbix_agent/etc/zabbix_agentd.conf.d/all.conf << EOF UserParameter=linux_tcp_status[*],/apps/zabbix_agent/etc/zabbix_agentd.conf.d/tcp_conn.sh "$1" "$2" EOF
/apps/zabbix_server/bin/zabbix_get -s 192.168.37.107 -k "linux_tcp_status["tcp_status","ESTAB"]"

4: Add monitoring items in the template or on the host
Create template
Template naming:
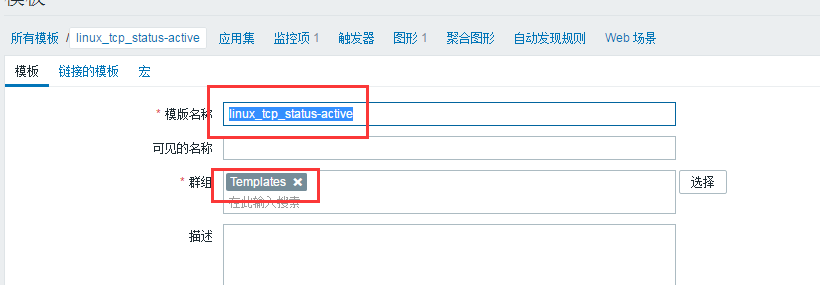
Create monitoring items; Select Create monitor item

Enter monitoring item configuration:

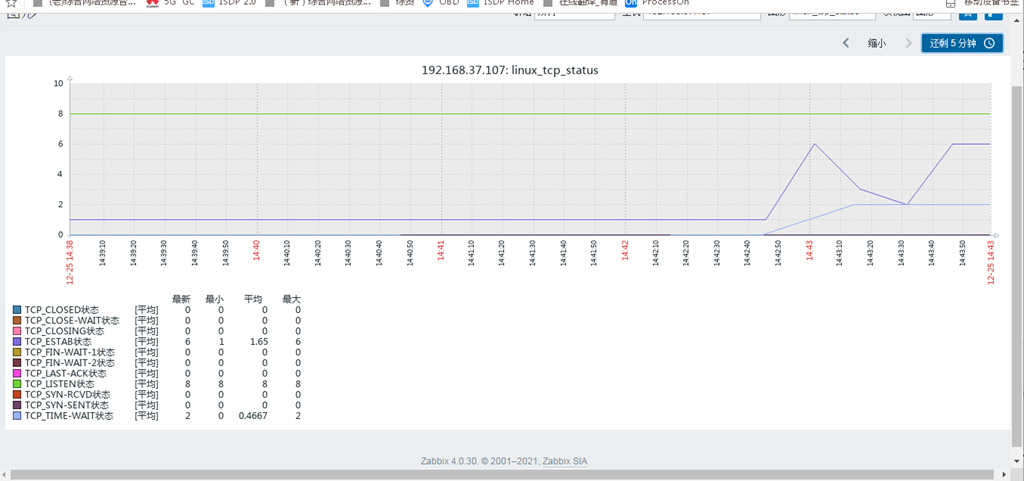
Create graphics, select create graphics;

Add graphics

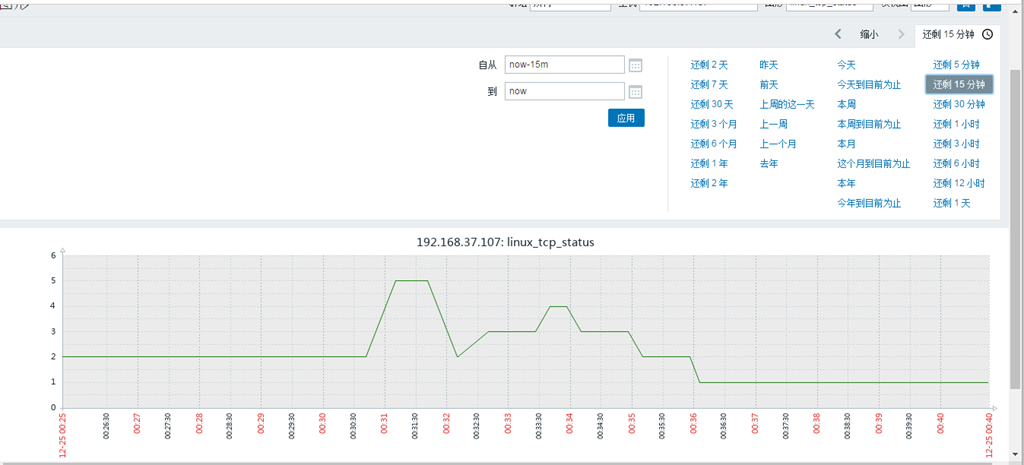
View the graphics of the monitoring item;
Repeat step 34 to add all the connection states in the remaining 10 TCP;
/apps/zabbix_server/bin/zabbix_get -s 192.168.37.107 -k "linux_tcp_status["tcp_status","CLOSED"]" /apps/zabbix_server/bin/zabbix_get -s 192.168.37.107 -k "linux_tcp_status["tcp_status","LISTEN"]" /apps/zabbix_server/bin/zabbix_get -s 192.168.37.107 -k "linux_tcp_status["tcp_status","SYN-RCVD"]" /apps/zabbix_server/bin/zabbix_get -s 192.168.37.107 -k "linux_tcp_status["tcp_status","SYN-SENT"]" /apps/zabbix_server/bin/zabbix_get -s 192.168.37.107 -k "linux_tcp_status["tcp_status","FIN-WAIT-1"]" /apps/zabbix_server/bin/zabbix_get -s 192.168.37.107 -k "linux_tcp_status["tcp_status","FIN-WAIT-2"]" /apps/zabbix_server/bin/zabbix_get -s 192.168.37.107 -k "linux_tcp_status["tcp_status","TIME-WAIT"]" /apps/zabbix_server/bin/zabbix_get -s 192.168.37.107 -k "linux_tcp_status["tcp_status","CLOSING"]" /apps/zabbix_server/bin/zabbix_get -s 192.168.37.107 -k "linux_tcp_status["tcp_status","CLOSE-WAIT"]"
/apps/zabbix_server/bin/zabbix_get -s 192.168.37.107 -k "linux_tcp_status["tcp_status","LAST-ACK"]"
Enter template, enter linux_tcp_status-active Enter the monitoring items and clone the monitoring items of the remaining 10 TCP states of the threading parts;
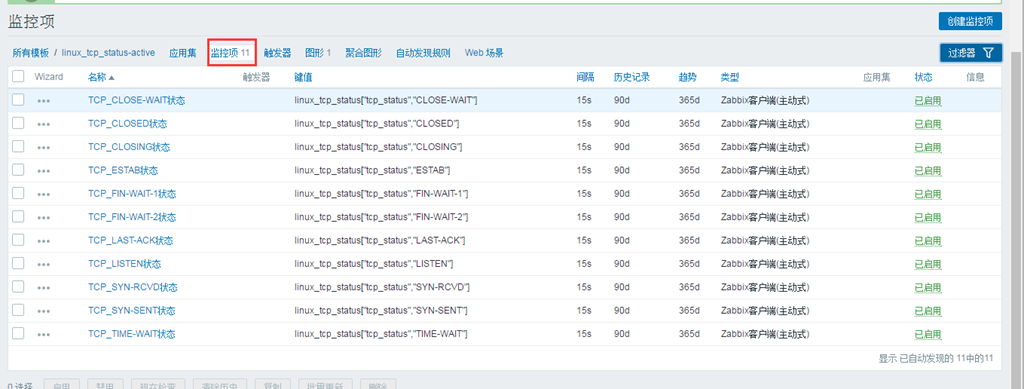
result:
4) zabbix email, wechat notification
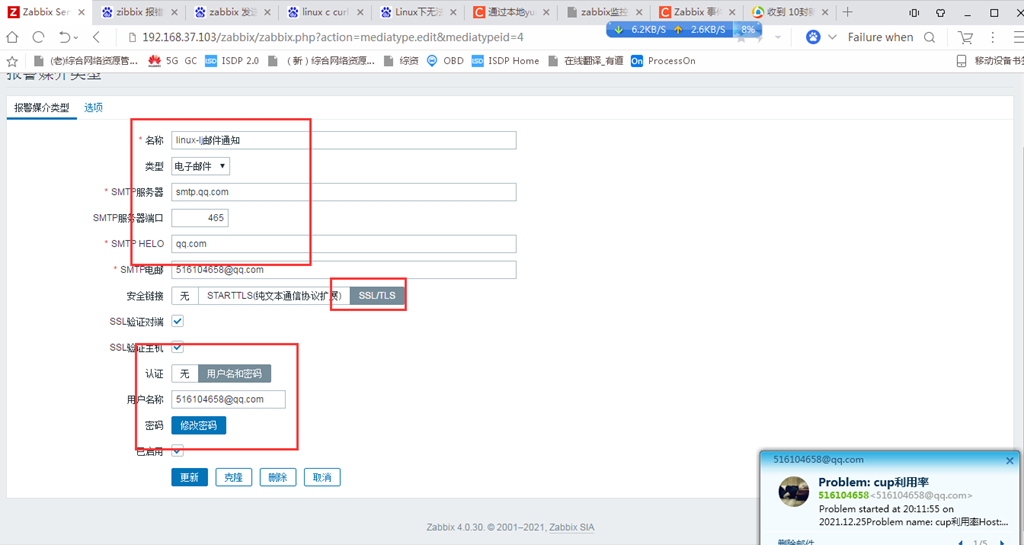
Email notification:
Obtain the authorization code of QQ email; riwodlkjkafvbiea (available)
vkdxsaeqbsdtbghb
To create a test script:
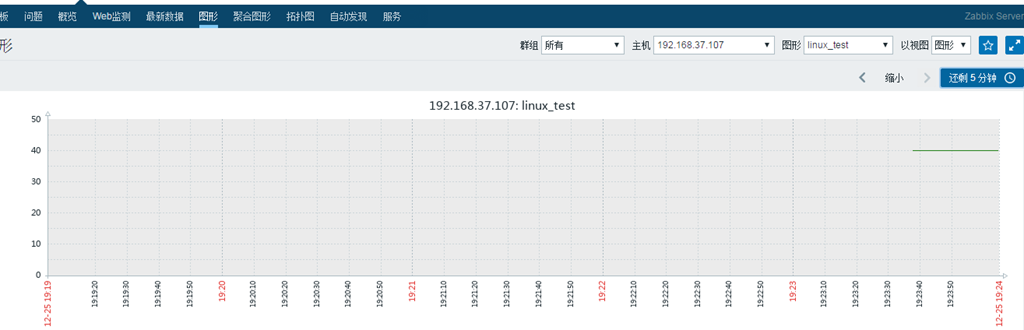
Here, an echo output is directly used to simulate the cpu load (just change the number directly)vim /apps/zabbix_agent/etc/zabbix_agentd.conf.d/all.conf UserParameter=linux_test[*],/apps/zabbix_agent/etc/zabbix_agentd.conf.d/CPU.sh
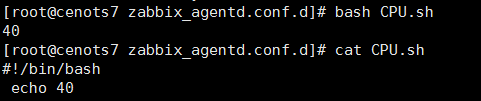
chmod a+x CPU.sh
Test on server
/apps/zabbix_server/bin/zabbix_get -s 192.168.37.107 -k "linux_test"

Add monitor item and graph: test successful
Create for alarm media:
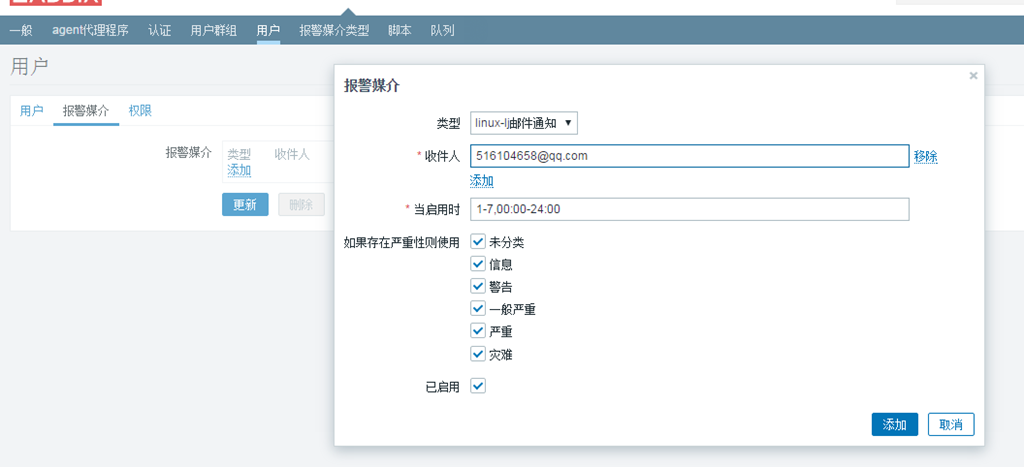
User added alarm media:
Create action: configure -- > action -- > create action:
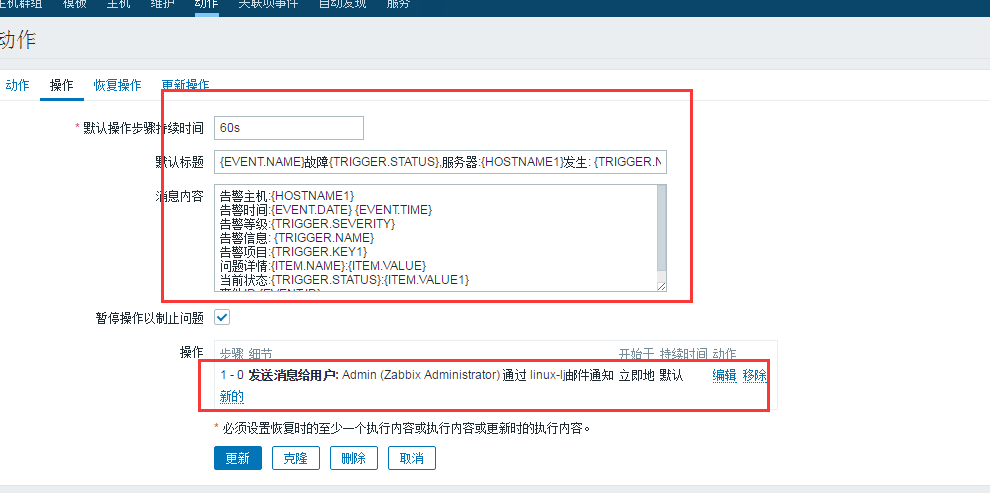
Create operation:
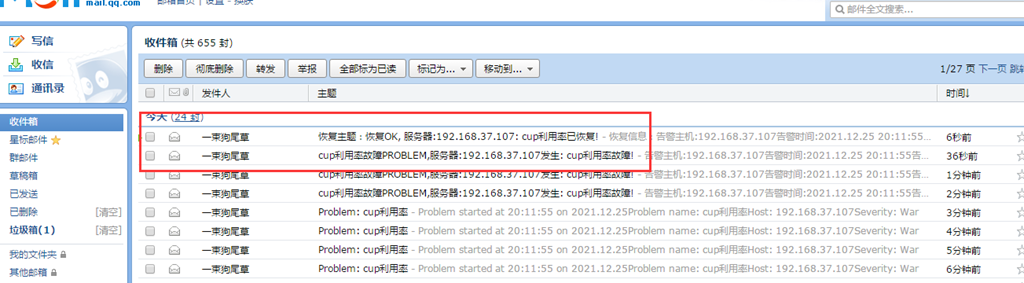
Subject: Problem: {EVENT.NAME} failure {TRIGGER.STATUS}, server: {HOSTNAME1} failure: {TRIGGER.NAME} failure!
Content: alarm host: {HOSTNAME1}
Alarm time: {EVENT.DATE} {EVENT.TIME}
Alarm level: {TRIGGER.SEVERITY} alarm information: {TRIGGER.NAME}
Alarm item: {TRIGGER.KEY1}
Question details: {ITEM.NAME}:{ITEM.VALUE}
Current status: {TRIGGER.STATUS}:{ITEM.VALUE1}
Event ID:{EVENT.ID}
Create recovery operation:
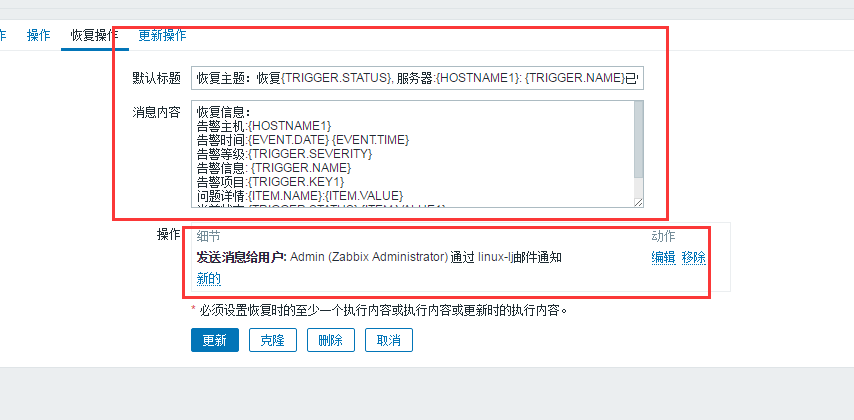
Recovery subject: recovery {TRIGGER.STATUS}, server: {HOSTNAME1}: {TRIGGER.NAME} recovered!
Recovery information: alarm host: {HOSTNAME1}
Alarm time: {EVENT.DATE} {EVENT.TIME}
Alarm level: {TRIGGER.SEVERITY}
Alarm information: {TRIGGER.NAME}
Alarm item: {TRIGGER.KEY1}
Question details: {ITEM.NAME}:{ITEM.VALUE}
Current status: {TRIGGER.STATUS}:{ITEM.VALUE1}
Event ID:{EVENT.ID}
Create trigger: configuration, template, host, trigger
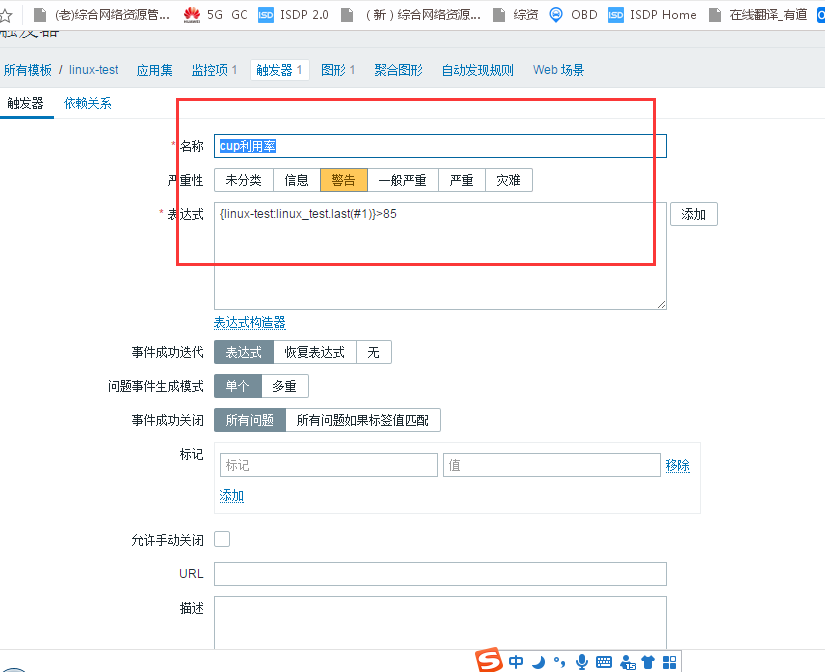
Result verification: