1. Have you studied the startup of APP? Have you done any startup optimization?
programmer:
The startup principle of Application has been studied before hot repair. Some startup optimization has also been done in the project.
interviewer:
Oh, did you study overheating repair before? (at this time, you may ask about the principle of hot repair in depth, and we won't discuss the principle of hot repair here.) what optimization have you done for startup?
programmer:
- I found that when the program is cold started, there will be a white screen flashing for about 1 s, and the low version will be black. During this period, I found that the system AppTheme has set a windowBackground by browsing the system theme source code. Therefore, it is inferred that this attribute is the ghost. At first, I found that although there is no white screen by setting the windowIsTranslucent transparent attribute, However, there is still a small section invisible in the middle, which is still a bad user experience. Finally, I observed that most Android Software on the market will have a Splash ad page when it is cold started. At the same time, a countdown timer is added, and finally it enters the login page or main page. I finally did the same, because the advantage of doing so is that users can first have a basic understanding of the APP based on advertising, and reserve some preparations for plug-ins and some necessary or time-consuming initialization during the countdown.
> Ps: This will make the interviewer feel that you are a user experience oriented person
- By browsing the source code started by the Application, when we click the desktop icon to enter our software Application, AMS will send a fork sub process message to Zygote through the Socket. After the Zygote fork sub process is completed, the ActivityThread##main function will be started through reflection, Finally, AMS tells ActivityThread##H through aidl to start the creation of Application instances, and executes attachBaseContext and onCreate life cycles in turn. It can be seen that we cannot do time-consuming operations of the main thread in these two life cycles.
> Ps: This will make the interviewer feel that you are right App The research on the application startup process is relatively deep. I have really read the underlying source code instead of reciting the answers.
- Knowing that attachBaseContext and onCreate are started first in the application, we can detect the time-consuming specific functions through performance detection tools such as TreceView, and then optimize them.
- The code needed by the project is loaded asynchronously.
- Some initialization with low utilization will be lazy loaded.
- Some time-consuming tasks will be processed by opening an IntentService.
- It also rearranges the class files through the redex, arranges the files needed in the startup phase in the APK file, uses the pagecache mechanism of the Linux file system as much as possible, reads as many files needed in the startup phase with the least disk IO times, and reduces IO sales, so as to improve the startup performance.
- Through the tiktok release, the article knows that the MultiDex version can be optimized in the 5 low version. When the first boot is started, it will load the original DEX without OPT optimization directly, so that APP can start normally. Then start a separate process in the background and slowly finish the opt of DEX to avoid affecting the normal use of the foreground app as much as possible.
> Ps: 1. The interviewer here will think that you really know well about startup optimization and have some experience in startup optimization.
>
> 2.  In the fifth point, the interviewer will feel that you pay more attention to the dynamics of the circle, find good solutions and can be used in your own projects. This is a bonus item!
- After the Application is started, AMS will find the Activity to be started at the top of the foreground stack. Finally, it notifies ActivityThread#H through AIDL to instantiate the Activity and execute the onCreate, onStart and onRemuse functions in the lifecycle in turn. Here, if setContentView function is called during the onCreate lifecycle, The bottom layer will pass XML2View, so this process must be time-consuming. Therefore, we should streamline the XML layout code and optimize the layout by using ViewStub, include and merge tags as much as possible. Then, in the onResume declaration cycle, JNI will be requested to receive the Vsync (vertical synchronization refresh signal) request. After 16ms, if a refresh message is received, the DecorView will be drawn with onmeasure - > onlayout - > OnDraw. Finally, the DecorView, the root layout of the Activity, is added to the Window and handed over to the SurfaceFlinger for display.
So in addition to streamlining this step XML Layout and customization View The measurement, layout, drawing and other functions can not be time-consuming and lead to GC Operation of. Finally, it can also be passed `TreaceView` Tool to detect the time-consuming of these three declaration cycles, so as to further optimize and reach the limit.
> This step gives the interviewer the feeling that you are interested in the whole process Activity Start up and View There is in-depth research on the drawing and refresh mechanism, so at the moment, you must have left a good impression on the interviewer, indicating that you usually have extensive and thorough research on these source code levels.
Summary: finally, based on the above optimization, I reduced the startup time by 50%.
Interviewer: Well, I've studied it deeply. I usually have a lot of source code. Let's see.
Programmer: here, I know this level is over!
2. Have you done any memory optimization?
programmer:
Yes, there are still a lot of memory optimization in the current project. Why don't I talk about the benefits of memory optimization first? We can't optimize blindly!
Sometimes you must take the initiative to lead the interview in your familiar field.
interviewer:
sure.
Ps: most interviewers here will agree to your request unless they meet someone who wears B.
programmer:
Benefits:
- Reducing OOM can improve the stability of the program.
- Reduce jamming and improve application fluency.
- Reduce memory consumption and improve application background memory activity.
- Reduce program exceptions, reduce application Crash rate and improve stability.
Based on these four points, my program is optimized as follows:
- 1. Reduce OOM
In the application development stage, I prefer to use LeakCanary The advantage of this performance detection tool is that it can tell me in real time which class has found a memory leak(If you're right LeakCanary If you understand the principle of, you can say how it is detected).
And we need to understand why applications send OOM ,How to avoid it?
happen OOM The scenario is when applying for 1 M If you want to save 2 to the memory space M Data, then this will happen OOM.
In the application, we should not only avoid directly causing OOM We should also avoid indirect causes OOM The scene. Indirectly, that is to avoid memory leakage.
The memory leak scenario is that when the object is no longer used, the application will complete the final life cycle. However, for some reasons, although the object is no longer used, it will still exist in memory GC It will not be recycled, which means that a memory leak has occurred.(Here can introduce GC Recycling mechanism, recycling algorithm and knowledge points shall be expanded as far as possible without departing from the subject)
Finally, let's talk about the scenario of avoiding memory leakage in actual development:
- Resource object not closed: Cursor,File
- Registered object not destroyed: broadcast, callback, listening
- The static variables of the class hold large data objects
- Static instances of non static inner classes
- Handler temporary memory leak: use static + weak reference, and destroy upon exiting
- Memory leak caused by objects in container not cleaned up
- WebView: using a separate process
In fact, these are the foundation. Just write it down. Remember more, you will have an impression in the actual development.
- 2. Reduce Caton
How to reduce Caton? Then we can discuss the root cause of Caton from two principles. The first principle is the drawing principle, and the other is the refresh principle.
1. Drawing principle:

2. Refresh principle:
View of requestLayout and ViewRootImpl##setView will eventually call the requestLayout method of viewrootimpl, then submit a drawing task to the Choreographer through the scheduleTraversals method, and then request the vsync vertical synchronization signal from the bottom layer through the DisplayEventReceiver. When the vsync signal comes, it will call back through JNI and post an asynchronous task to the message queue through the Handler, Finally, ViewRootImpl executes the rendering task, and finally calls the performTraversals method to complete the rendering.
Please refer to the following flow chart for detailed flow:

The root cause of carton:
From the refresh principle, the basic principle of Caton is that there are two places that will cause frame loss:
One is that the main thread has other time-consuming operations, resulting in doFrame No chance in vsync Called within 16 milliseconds after the signal is sent;
Another is the current doFrame Method takes too long to draw, next vsync The frame was not finished when the signal came, resulting in frame loss.
Now that we know the root cause of Caton, we can monitor Caton and optimize Caton to the extreme. We can monitor the application from the following four aspects:
1. be based on Looper of Printer The time difference of message distribution is used to determine whether it is stuck.
```
//1. Enable monitoring
Looper.myLooper().setMessageLogging(new
LogPrinter(Log.DEBUG, "ActivityThread"));
//2. As long as the message is distributed, the message will be printed before and after
public static void loop() { final Looper me = myLooper();
if (me == null) { throw new RuntimeException("No Looper; Looper.prepare() wasn't called on this thread."); }
final MessageQueue queue = me.mQueue;
...
for (;;) { Message msg = queue.next(); // might block
...
//Print before distribution
final Printer logging = me.mLogging;
if (logging != null) { logging.println(">>>>> Dispatching to " + msg.target + " " + msg.callback + ": " + msg.what);
}
...
try { //Distribute messages
msg.target.dispatchMessage(msg);
...
//Print after distribution
if (logging != null) { logging.println("<<<<< Finished to " + msg.target + " " + msg.callback); }
}
}
```
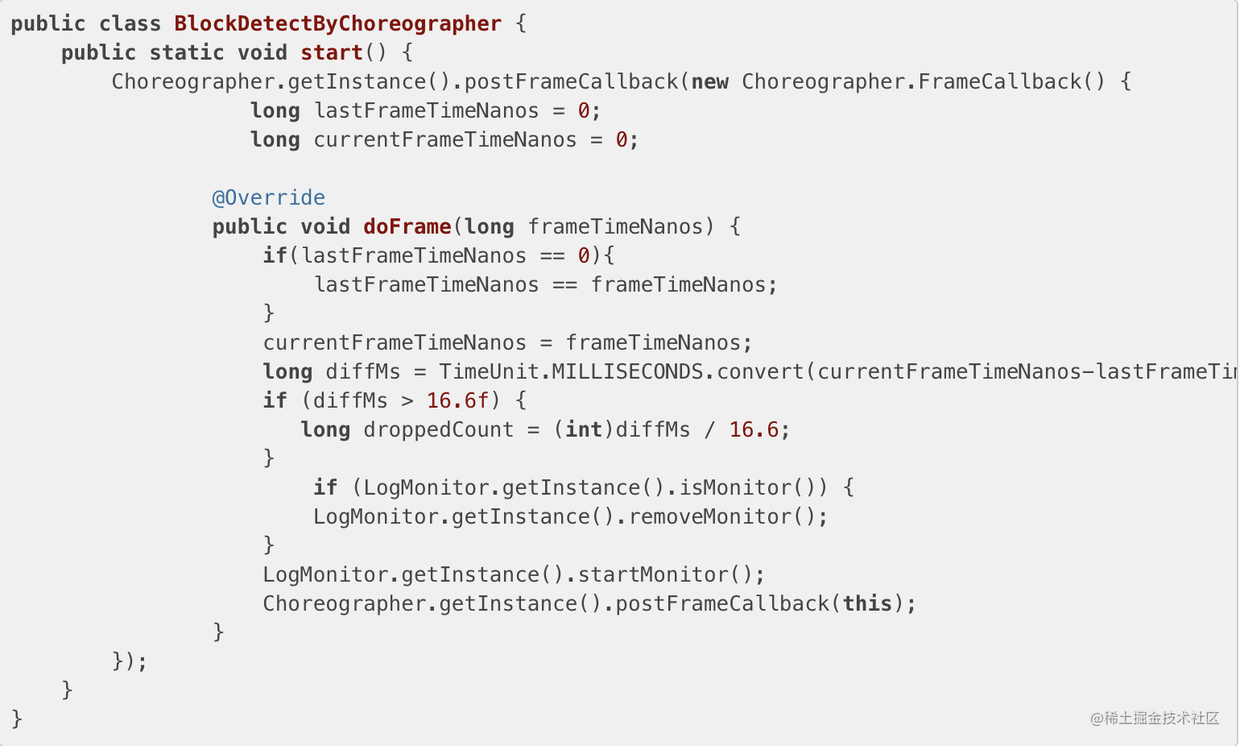
2. be based on Choreographer Callback function postFrameCallback To monitor
- Based on open source framework BlockCanary To monitor
- Based on open source framework rabbit-client To monitor
How to avoid getting stuck:
Be sure to avoid time-consuming tasks in the main thread. Summarize the main thread scenario in Android:
- Control of UI life cycle
- Handling of system events
- Message processing
- Interface layout
- Interface drawing
- Interface refresh
- ...
Another important thing is to avoid memory jitter and avoid frequent memory allocation and release in a short time.
Based on these points, there must be no problem with carton.
- 3. Reduce memory usage
It can be explained from the following aspects:
1. AutoBoxing(Automatic packing): You can use the small one, but you don't have to use the big one.
2. Memory reuse
3. Use the best data type
4. Enumeration type: Use annotation enumeration to restrict substitution Enum
5. Picture memory optimization Glide Wait for the open source framework to say how they are designed)
    1.  Select the appropriate bitmap format
    2.  bitmap Memory reuse, compression
    3.  Multi level caching of pictures
6.  If the basic data type does not need to be modified, write all the suggestions static final,Because it does not need initialization, it is packaged directly into dex It can be used directly without applying for memory in the class
7. String splicing +=,use StringBuffer or StringBuilder
8. Don't be onMeause, onLayout, onDraw Refresh in UI
9. Try to use C++ Transcoding YUV Format, don't use it Java Transcoding RGB And other formats, which really takes up memory
- 4. Reduce program exceptions
Reduce program exceptions, then we can start from stability and Crash To explain separately.
We will introduce the stability and stability of the program in detail in the fourth point Crash .
If you say these, there should be no problem to illustrate how to solve them in the actual development.
3. Did you meet the Caton problem in the project? How did you check carton? How is it optimized?
programmer:
There are some problems, such as time-consuming operations in the main thread, frequent creation and destruction of objects, frequent GC recycling, multiple levels of layout, etc.
interviewer:
Well, let's talk about how to optimize it.
programmer:
Here we can explain it from the display principle and optimization suggestions, as shown below:
- Display principle:
- Drawing principle:

- Refresh principle:
View of requestLayout and ViewRootImpl##setView will eventually call the requestLayout method of viewrootimpl, then submit a drawing task to the Choreographer through the scheduleTraversals method, and then request the vsync vertical synchronization signal from the bottom layer through the DisplayEventReceiver. When the vsync signal comes, it will call back through JNI and post an asynchronous task to the message queue through the Handler, Finally, ViewRootImpl executes the rendering task, and finally calls the performTraversals method to complete the rendering.
Please refer to the following flow chart for detailed flow:

- Root cause of Caton:
From the refresh principle, the basic principle of Caton is that there are two places that will cause frame loss:
One is that the main thread has other time-consuming operations, resulting in doFrame No chance in vsync Called within 16 milliseconds after the signal is sent;
Another is the current doFrame Method takes too long to draw, next vsync The frame was not finished when the signal came, resulting in frame loss.
Now that we know the root cause of Caton, we can monitor Caton and optimize Caton to the extreme. We can monitor the application from the following four aspects:
1. be based on Looper of Printer The time difference of message distribution is used to determine whether it is stuck.
```
//1. Enable monitoring
Looper.myLooper().setMessageLogging(new
LogPrinter(Log.DEBUG, "ActivityThread"));
//2. As long as the message is distributed, the message will be printed before and after
public static void loop() { final Looper me = myLooper();
if (me == null) { throw new RuntimeException("No Looper; Looper.prepare() wasn't called on this thread."); }
final MessageQueue queue = me.mQueue;
...
for (;;) { Message msg = queue.next(); // might block
...
//Print before distribution
final Printer logging = me.mLogging;
if (logging != null) { logging.println(">>>>> Dispatching to " + msg.target + " " + msg.callback + ": " + msg.what);
}
...
try { //Distribute messages
msg.target.dispatchMessage(msg);
...
//Print after distribution
if (logging != null) { logging.println("<<<<< Finished to " + msg.target + " " + msg.callback); }
}
}
```
2. be based on Choreographer Callback function postFrameCallback To monitor

3. Based on open source framework [BlockCanary](https://link.juejin.cn/?target=https%3A%2F%2Fgithub.com%2Fmarkzhai%2FAndroidPerformanceMonitor "https://github.com/markzhai/AndroidPerformanceMonitor ") to monitor
4. Based on open source framework [rabbit-client](https://link.juejin.cn/?target=https%3A%2F%2Fgithub.com%2FSusionSuc%2Frabbit-client "https://github.com/SusionSuc/rabbit-client ") to monitor
- How can we improve the smooth running of the program
**1.Layout optimization:**
1.1 Layout optimization analysis tool:

1.2 Optimization scheme:

- Improve animation performance
1.  Try not to use gap animation but attribute animation, because it is found that gap animation is redrawn very frequently through performance monitoring
2.  Use hardware acceleration to improve rendering speed and achieve smooth animation effects. How to avoid getting stuck:
Be sure to avoid doing time-consuming tasks in the main thread. To sum up Android Scenario of main thread in:
1.  UI Life cycle control
2.  Handling of system events
3.  Message processing
4.  Interface layout
5.  Interface drawing
6.  Interface refresh
7.  ...
Based on these points, there must be no problem with carton.
4. How to ensure the stable operation of APP?
programmer:
To ensure the stability of the program, we can optimize from memory, code quality, Crash, ANR, background survival and other knowledge points.
interviewer:
What exactly did you do?
programmer:
1. Memory
Memory optimization can be explained from the second point
2. Code quality
- The team reviewed each other's code before, which ensured the quality of the code and learned the ideas of other colleagues.
- Use Link to scan the code for defects.
- Crash
- By implementing thread The uncaughtexceptionhandler interface is used to globally monitor the abnormal status, upload the log to the background in time in case of Crash, and repair it through the plug-in package in time.
- Native online monitors program abnormalities in real time through the Bugly framework, and offline LANs use Google's open source breakpad framework. Collect logs and upload them to the server when exceptions occur (note the performance of log upload, which will be explained in the power saving module later)
- ANR
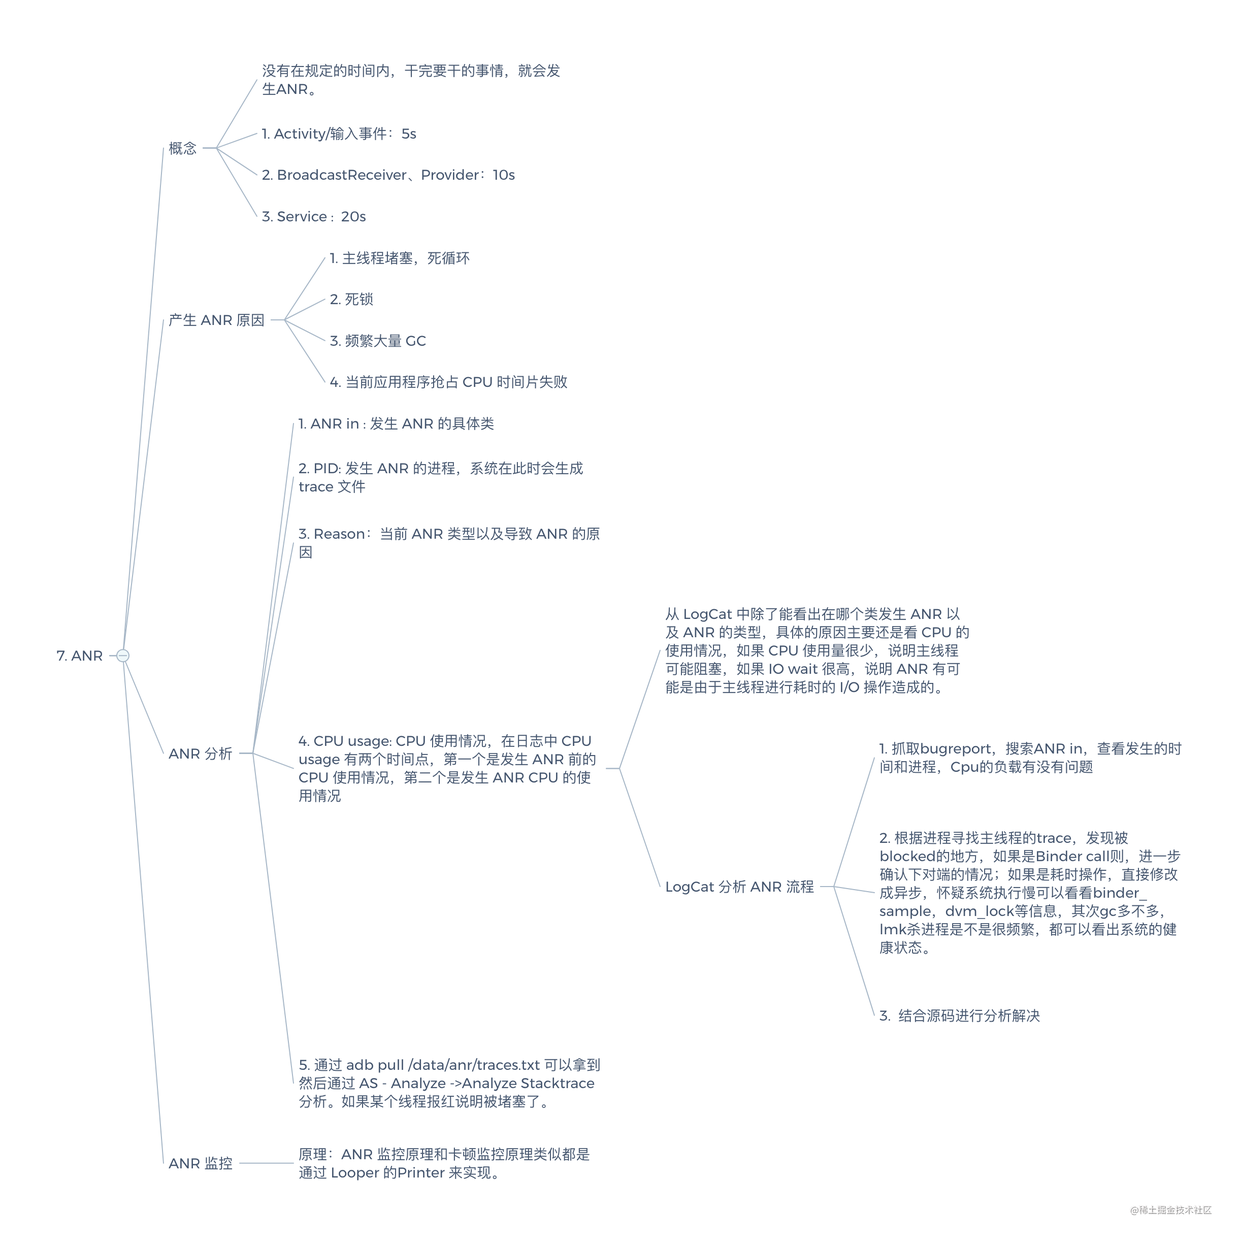
- Backstage survival
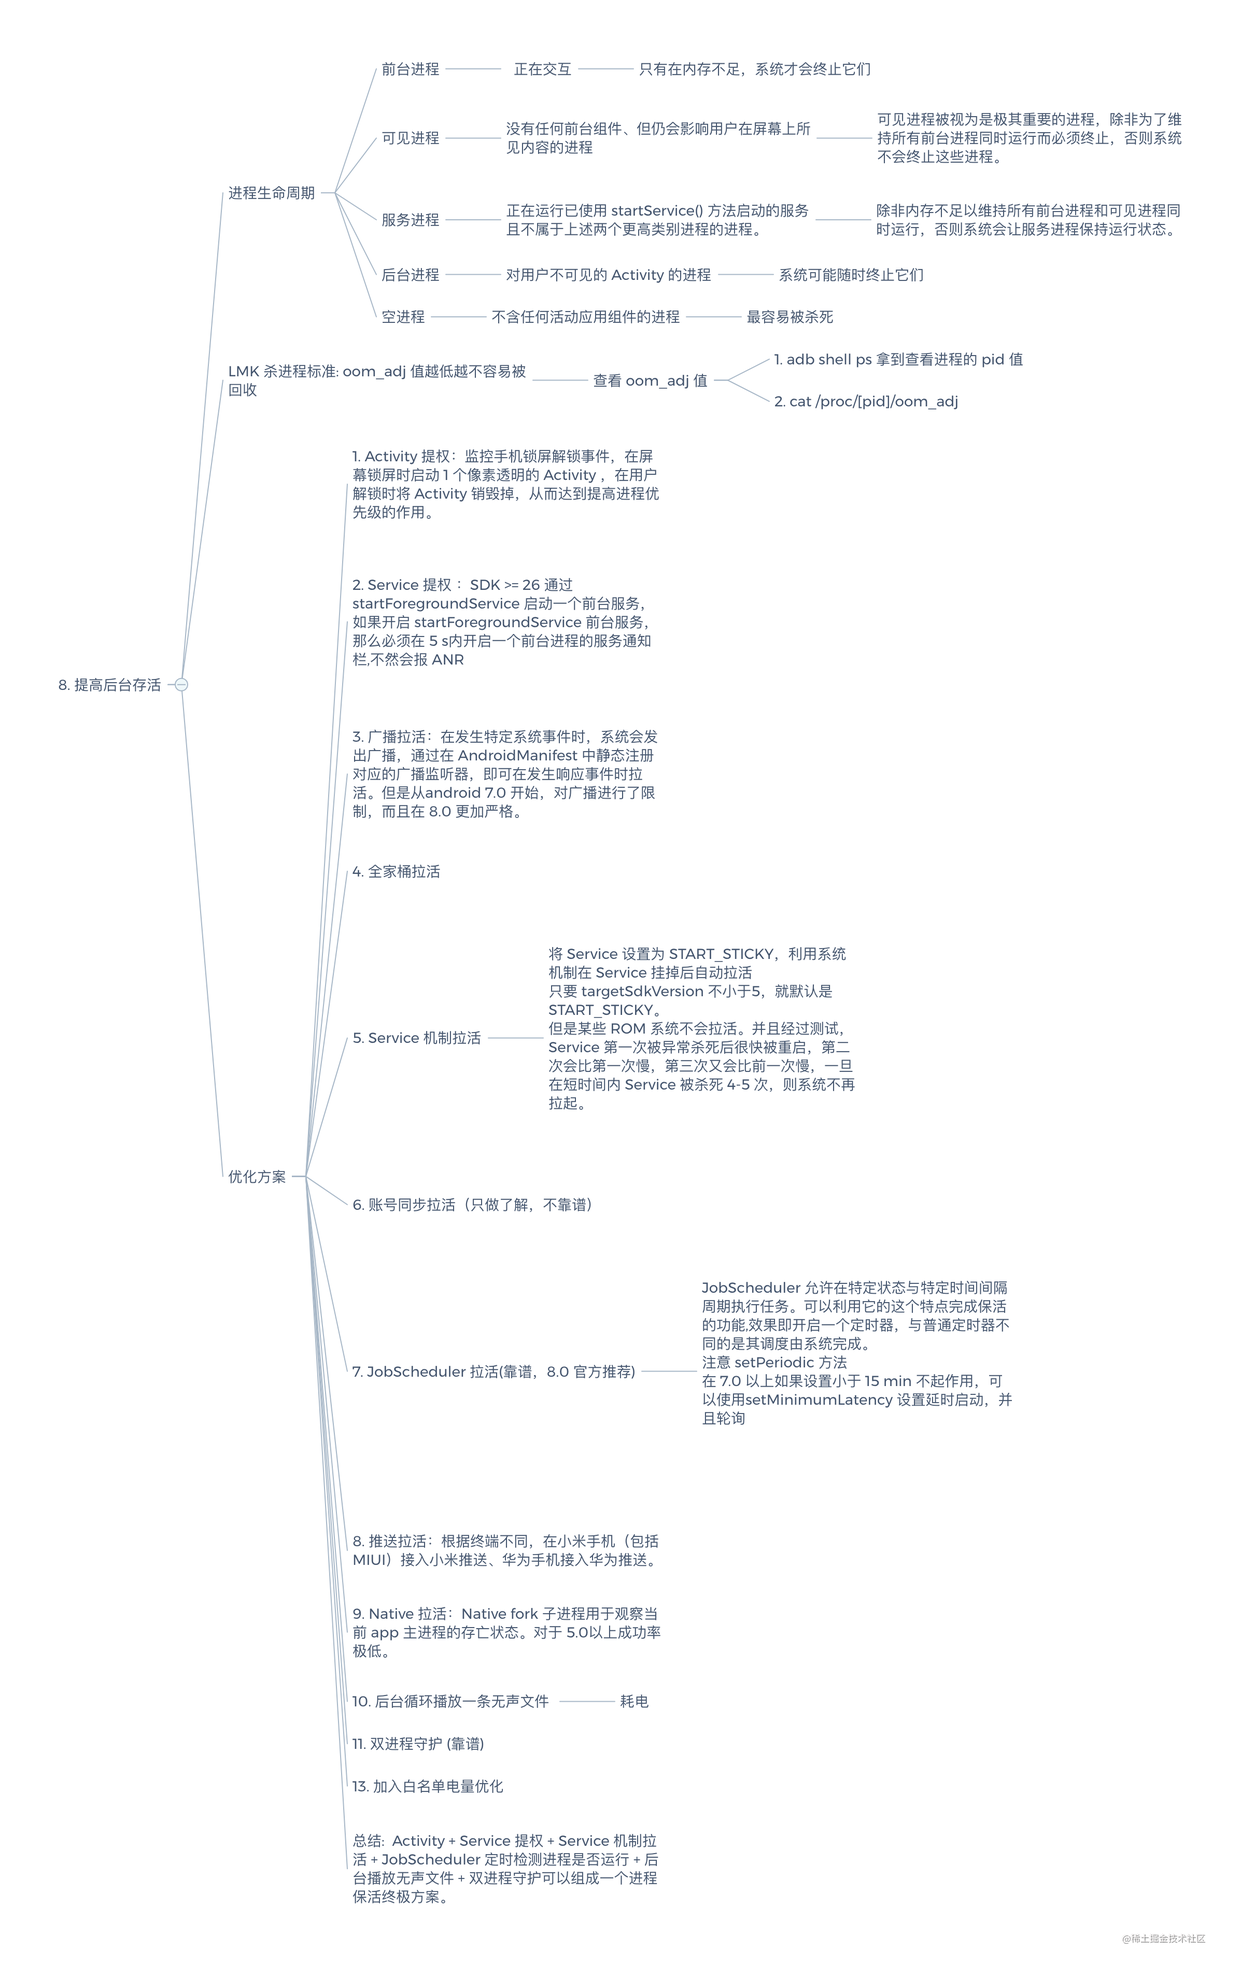
interviewer:
Well, you have a good grasp of knowledge.
With these words, this level has passed.
5. Tell me about your network optimization in the project?
programmer:
Yes, you can actually talk about this through the OKHTTP connection pool and Http cache (of course, we won't analyze the OKHTTP source code here)
interviewer:
Let's be specific
programmer
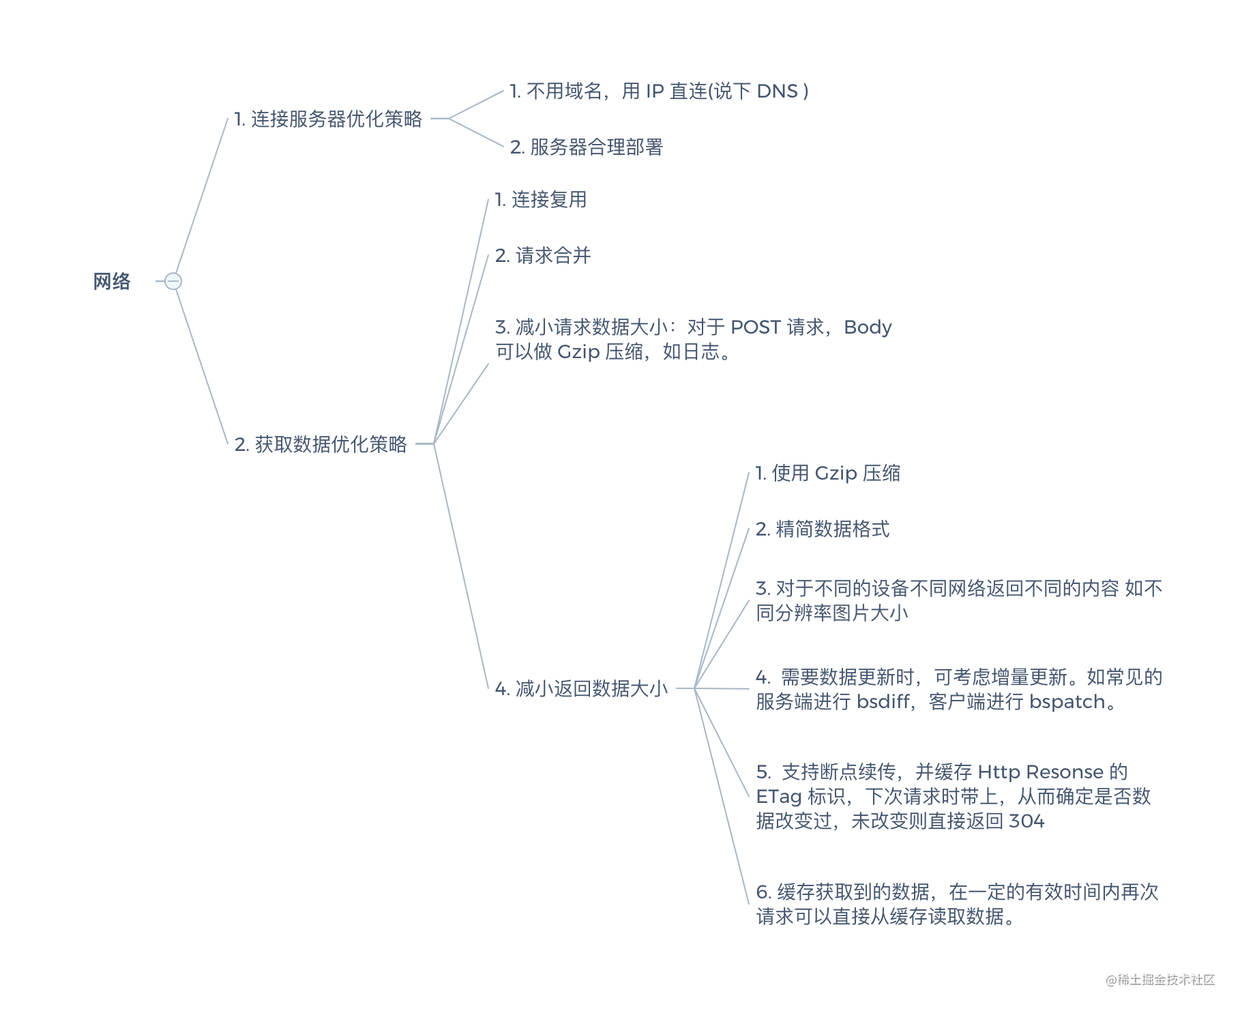
After that, let's talk about the optimization of the network framework you currently use, such as OKHTTP(Socket connection pool, Http cache, responsibility chain) and retrofit (dynamic proxy). Having said that, generally, this level is passed.
6. What storage methods have you used in the project? Have their performance been optimized?
programmer:
Mainly used sp, file and sqlite storage methods. sp and sqlite are optimized.
interviewer:
What optimizations have you done?
programmer:
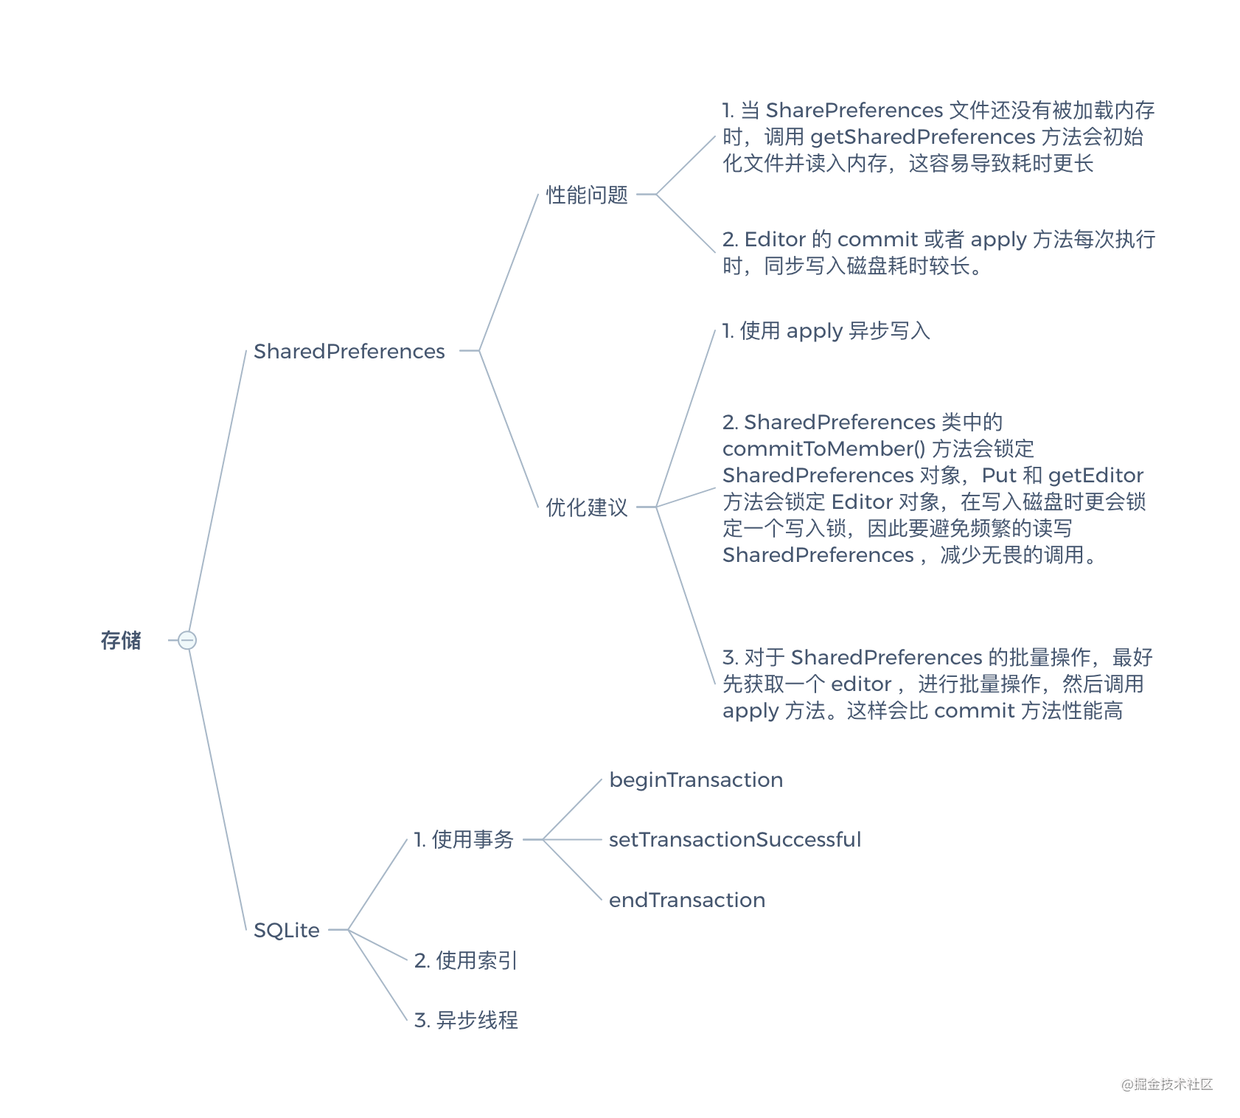
In this section, if you have used other third-party databases, you can talk about their principles and their access methods.
7. Have you ever made a custom View in the project? Has it been optimized?
programmer:
Yes. For example, repeated drawing and large and long drawings have been optimized.
interviewer:
Let's be specific
programmer:
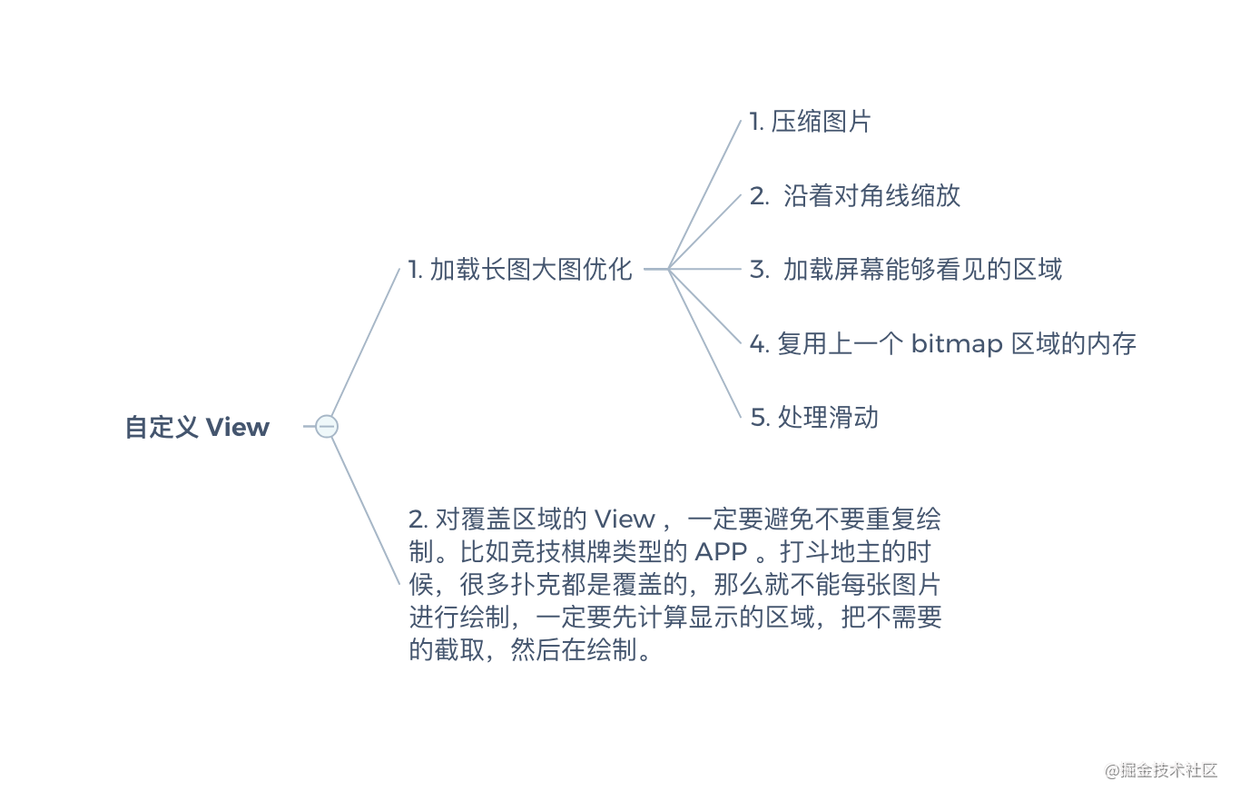
Finally, it is also a combination of real scenes.
8. How about the power consumption of your project? Have you done optimization?
programmer:
The power consumption of continuous operation for 30 minutes before optimization is 8%, and after optimization is 4%.
interviewer:
Then tell me how you optimized it.
programmer:
Because our product is a social communication software with audio and video calls, GPS positioning reporting and long connection scenarios, it is really a little difficult to optimize. However, in the end, half of the power was optimized. The main optimization is as follows:
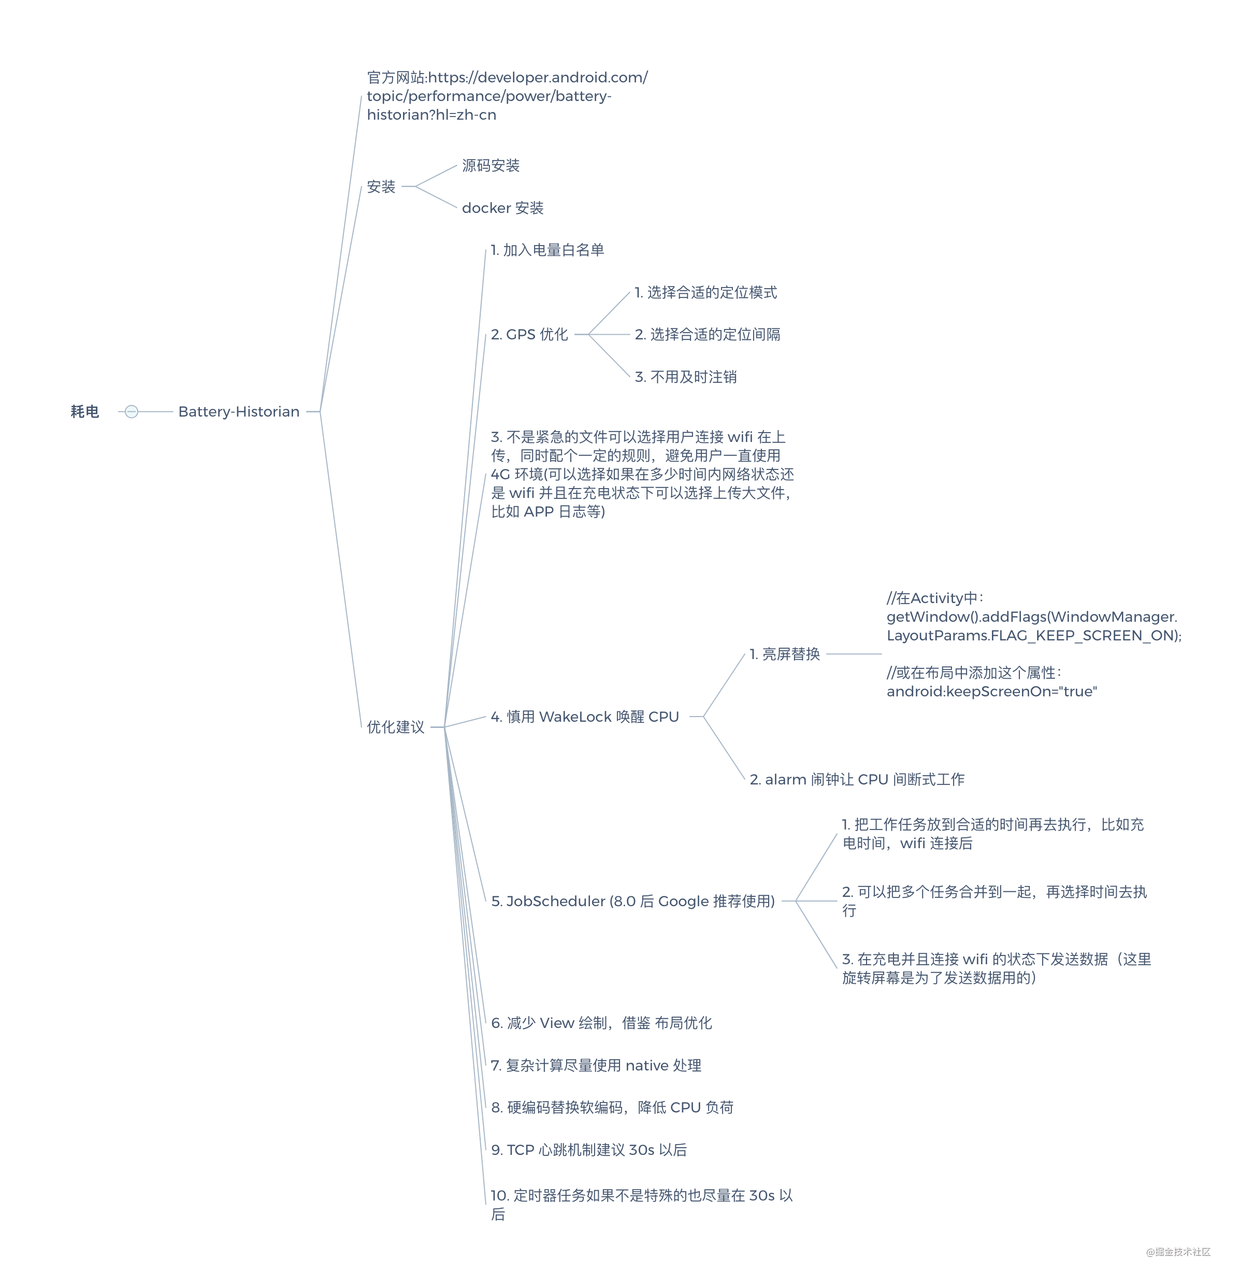
After saying this, explain it in combination with a real optimization point of the project.
9. Have you done log optimization?
programmer:
With optimization, without considering any performance before, I write files directly with log s. Although I open the thread pool to write files, as long as the software is running, it will frequently make the CPU work. This also indirectly leads to power consumption.
interviewer:
How did you solve this problem in the end?
programmer:
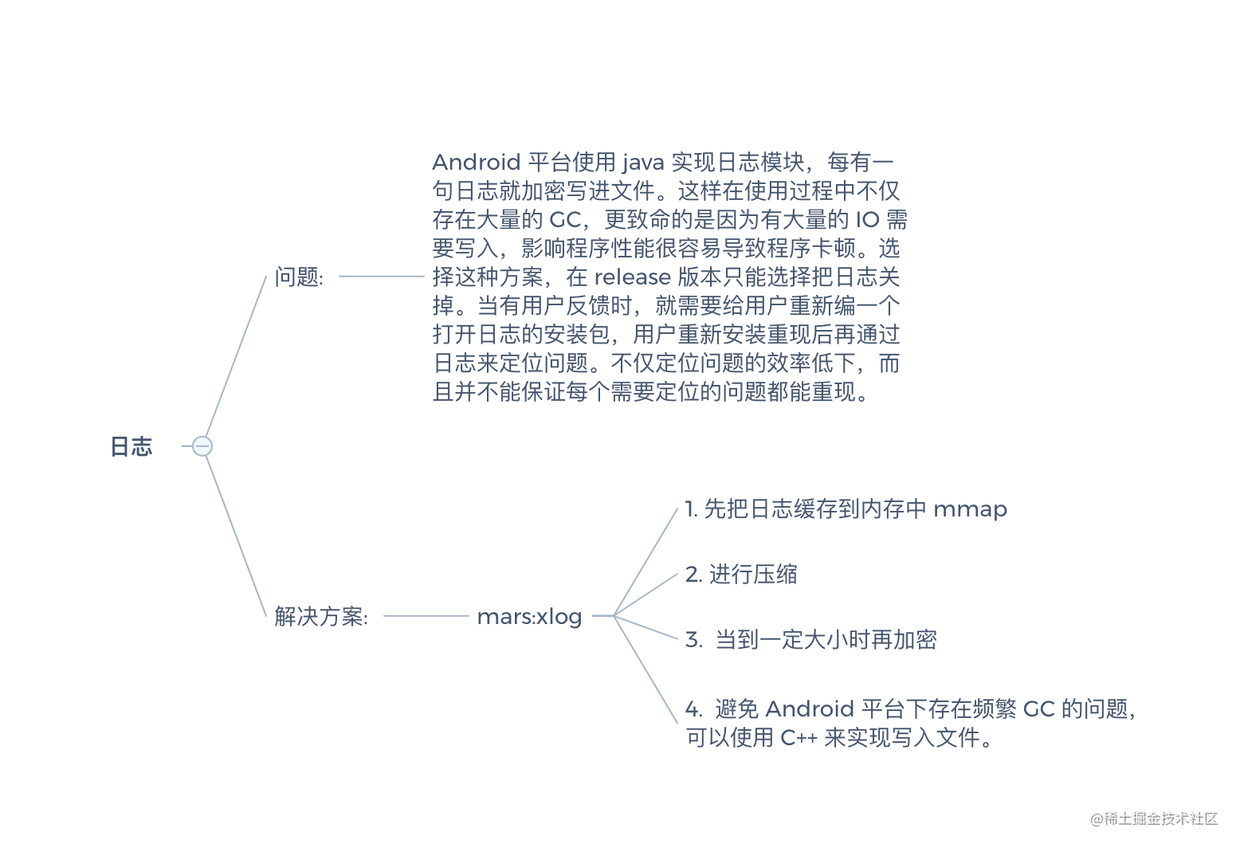
After unfolding these points, the interviewer will generally not embarrass you.
10. How big is your APK? Have you done APK volume related optimization?
programmer:
It has been optimized. Before optimization, the package size of the project is 80M, and after optimization, it is 50M
interviewer:
Tell me how it is optimized
programmer:
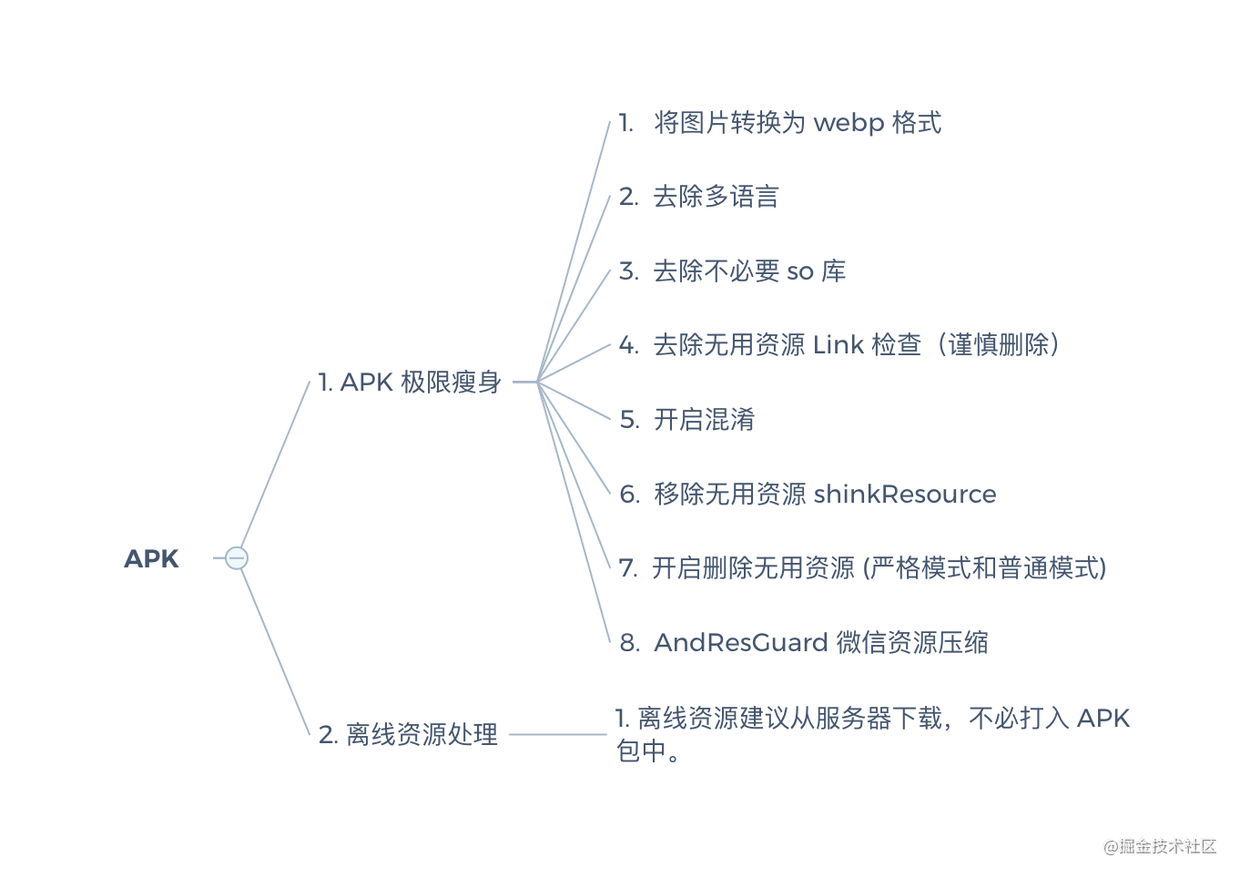
Based on these optimization schemes, the APK volume problem can generally be solved. Finally, just combine the APK volume optimization steps of your project with the above points.
summary
In fact, performance optimization points are closely related. For example, Caton will involve memory and display, and startup will also involve the impact of APK dex. Therefore, performance optimization is not just a unilateral optimization. We must master the most basic optimization scheme in order to further explore the performance principle.
It is also established here that we can see more popular open source framework source code, such as Glide (memory) and OKhttp (network connection). The optimization is really extreme. Here we have finished the knowledge of performance optimization. We must digest it well.
Related videos:
This article is transferred from https://juejin.cn/post/6844904105438134286 , in case of infringement, please contact to delete.