1. Introduction to Prometheus
Prometheus is an open source system for monitoring and alarming. It has now joined the CNCF Foundation as the second CNCF-hosted project after k8s. In the kubernetes container management system, Prometheus is often used for monitoring. It also supports multiple exporter s for data collection and pushgateway for data reporting. Prometheus performance is sufficient to support tens of thousands of clusters
2. Prometheus principle
Prometheus is written in the Go language, uses Pull to obtain monitoring information, and provides a multidimensional data model and a flexible query interface. Prometheus not only configures monitoring objects through static files, but also supports automatic discovery mechanism. It can dynamically obtain monitoring objects through Kubernetes, Consl, DNS and other methods. In data collection, with the high concurrency of GoVoice, Prometheus can take hundreds of nodes to monitor data. For data storage, Prometheus can collect 10 million metrics per second as the local time series database is continuously optimized, and remote storage is also supported if a large amount of historical monitoring data needs to be stored.
3. Features of Prometheus
-
Multidimensional data model:
Each time series data is uniquely determined by the metrics measure name and its label labels key pair set: the metrics measure name specifies the measurement characteristics of the monitoring target system (for example, http_requests_total - the total count of received http requests). Labels opens Prometheus's multidimensional data model: for the same measure name, a specific measure dimension instance is created by combining different label lists. (For example, all HTTP requests that contain the measure name / api/tracks, labeled method=POST, form a specific http request). This query language filters and aggregates these metrics and tag lists. Changing any label value on any measure results in a new time series diagram -
PromQL: You can add, multiply, join and so on metrics metrics indicators collected
-
Can be deployed locally without relying on other distributed storage
-
Collecting time series data by pull based on HTTP
-
Time series data can be pushed to prometheus server by pushgateway, an intermediate gateway
-
Target service objects can be discovered through service discovery or static configuration
-
There are many visual image interfaces, such as Grafana, etc.
-
Efficient storage, about 3.5 bytes per sample, 3 million time series, 30 s interval, 60 days reserved, approximately 200G disk consumption
-
High availability, remote backups of data, federated clusters, multiple sets of prometheus deployed, pushgateway reporting data
4. What is a sample
Sample: Each point in the time series is called a sample, which consists of three parts:
- Indicator (metric): Indicator name and labelsets describing current sample characteristics
- Timestamp: a timestamp that is accurate to milliseconds
- Sample value: A folat64 floating-point data represents the value of the current sample
Representation: Represents the time series of the specified indicator name and the specified set of labels by the following expressions: <metric name>{<label name>=<label value>,...}
For example, the indicator name is api_http_requests_total, time series labeled method="POST" and handler="/messages" can be expressed as api_http_requests_total{method="POST", handler="/messages"}
5. Advantages and disadvantages of Prometheus:
-
Provides a multidimensional data model and a flexible query method, which combines monitoring data with any dimension by associating monitoring indicators with multiple tag s, provides a simple PromQL query method, and provides an HTTP query interface to easily display data in combination with GUI components such as Grafana
-
Supports local storage of server nodes without relying on external storage, enabling 10 million levels of data storage per second through Prometheus'own time series database; Moreover, in scenarios where large amounts of historical data are stored, Prometheus can dock third-party time series databases, OpenTSDB, and so on.
-
Open Indicator Data Standard is defined to collect time series data in Pull mode based on HTTP. Only Prometheus monitoring data can be collected, summarized and supported by Prometheus to Push time series data to intermediate gateway. It is more flexible to cope with multiple monitoring scenarios.
-
Supports the discovery of monitoring objects through static file configuration and dynamic discovery mechanisms, and automatically completes data collection. Prometheus now supports Kubernetes, etcd, Consul and many other service discovery mechanisms
-
Easy to maintain, can be started directly from binary files, and provides a containerized deployment image.
-
Supports partitioned sampling and federated deployment of data, large-scale cluster monitoring
6. Prometheus architecture
The basic principle of Prometheus is to periodically capture the state of monitored components through HTTP, and any component can intervene in Prometheus monitoring as long as it provides the corresponding HTTP interface and conforms to the data format defined by Prometheus.

Prometheus Server payload periodically grabs metrics (metrics) data on the target, and each grab target needs to expose an HTTP service interface for Prometheus periodic grab. This way of calling the monitored object to obtain monitoring data is called Pull. The Pull approach reflects Prometheus's unique design philosophy, which is different from most monitoring using the Push approach.
The advantage of Pull mode is that it can automatically monitor upstream and horizontally, has fewer configurations, is easier to expand, is more flexible, and is easier to achieve high availability. Simply put, the Pull method reduces coupling. Because in the push system, it is easy to be paralyzed by the monitoring system because of the failure of pushing data to the monitoring system. Therefore, through Pull mode, the collected side does not need to be aware of the existence of the monitoring system, completely independent of the monitoring system, so data collection is completely controlled by the monitoring system
6.1 Prometheus supports two Pull methods for collecting data
- Static configuration through configuration files, text, and so on
- Support Zookeeper, Consul, Kubernetes and other ways of dynamic discovery, such as dynamic discovery of Kuernetes, Prometheus uses Kubernetes API to query and monitor changes in container information, dynamically update monitoring objects, so that container creation and deletion can be perceived by Prometheus
7. Introduction to Prometheus components
-
Prometheus Server: Used to collect and store time series data
-
Client Library: A client library that detects application code and sends the current status of all tracked metrics metrics metrics metrics metrics to the prometheus server when Prometheus grabs the HTTP endpoint of an instance
-
Exporters: prometheus supports multiple exporters, through which metrics data can be collected and sent to the prometheus server side. All programs that provide monitoring data to promtheus server can be called exporters
-
Alertmanager: When alerts are received from Prometheus server, they are de-duplicated, grouped and routed to the appropriate recipient to give an alert. Common ways of receiving alerts are e-mail, WeChat, Staple, slack, etc.
-
Grafana: Monitor dashboards, visualize monitoring data
-
Pushgateway: Each target host can report data to the pushgateway, and then prometheus server pulls data from the pushgateway uniformly.
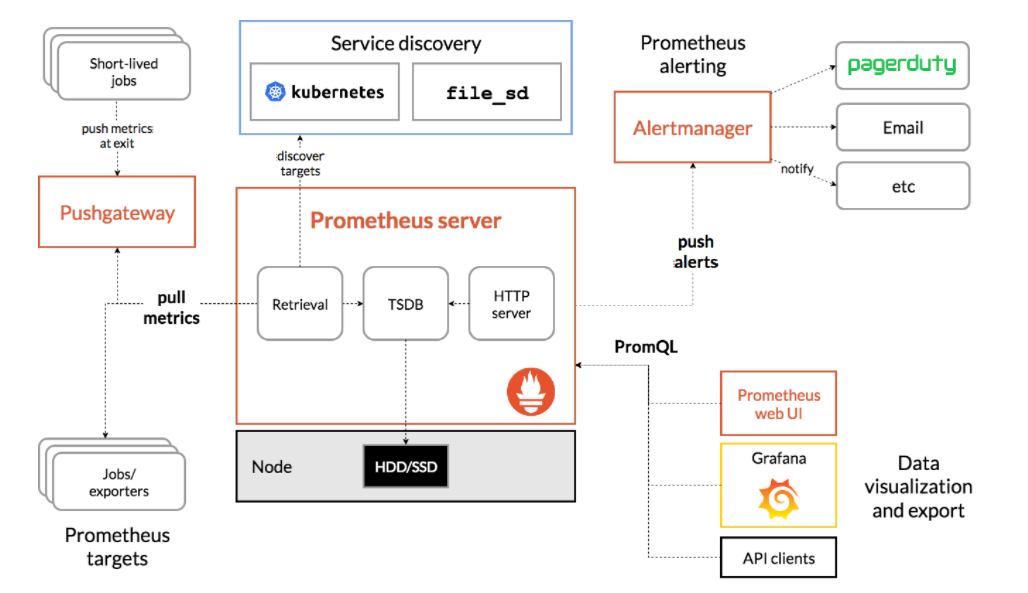
From the above figure, we can see that Prometheus ecosystem consists of Prometheus server, Exporter, pushgateway, alertmanager, grafana, Web ui interface, Prometheus server is composed of three parts, Retrieval, Storage, PromQL
- Retrieval is responsible for fetching monitoring indicator data on an active target host
- Storage storage mainly stores the collected data to disk
- PromQL is a query language module provided by Prometheus
8. Prometheus workflow
-
Prometheus server can periodically pull monitoring indicator data from active (up) target hosts, which can be collected by Prometheus server by configuring static job or service discovery, which pulls indicators by default. The data collected can also be reported to the Prometheus server through the pushgateway. You can also collect data from components via their own exporter
-
Prometheus server saves collected monitoring indicator data to a local disk or database
-
Monitoring indicator data collected by Prometheus is stored in time series and triggered alarms are sent to alertmanager by configuring alarm rules
-
Alertmanager configures alarm receivers to send alerts to mail, WeChat, pins, etc.
-
Prometheus comes with a web ui interface that provides a PromQL query language for querying monitoring data
-
Grafana can access prometheus data sources to graphically display monitoring data
9. Several deployment modes for Prometheus
Basic High Availability Mode
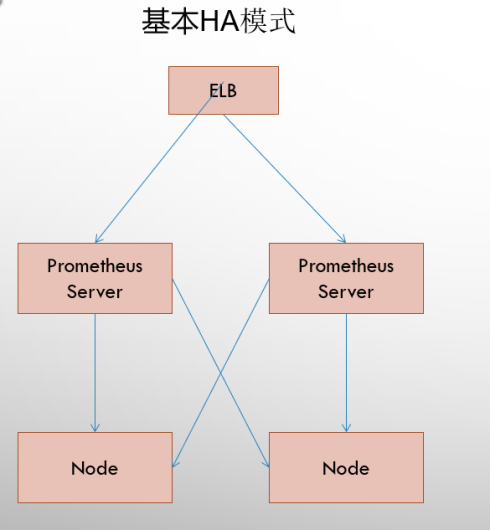
The basic HA mode only ensures the availability of the Promthues service, but it does not address data consistency and persistence issues between Prometheus Server s (which cannot be recovered after data loss), nor can it be dynamically extended. This deployment is therefore appropriate for scenarios where monitoring is small, Promthues Server does not migrate frequently, and only needs to save short-cycle monitoring data.
9.1 Basic High Availability + Remote Storage
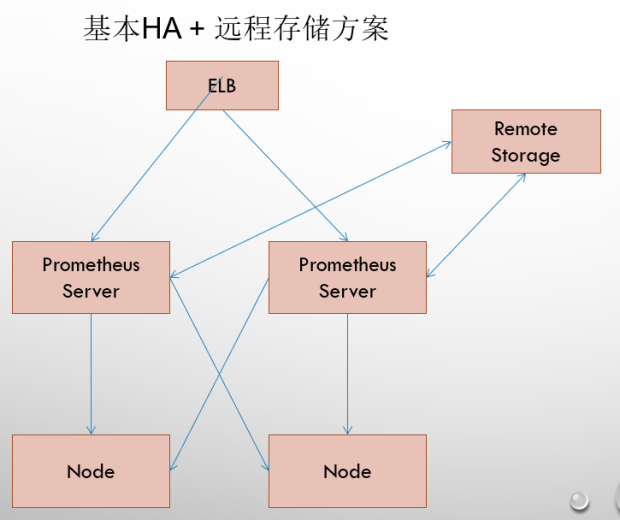
On the basis of resolving the availability of Promthues service and ensuring the persistence of data, Promthues Server can be quickly recovered in case of downtime or data loss. Promthues Server may also be a good migrator. Therefore, this scenario is appropriate for scenarios where user monitoring is small, but you want to be able to persist monitoring data while ensuring the portability of Promthues Server.
9.2 Basic HA+Remote Storage+Federal Cluster Scheme

Promthues performance bottleneck is mainly due to a large number of collection tasks, so users need to take advantage of the Prometheus Federal Cluster to partition different types of collection tasks into different Promthues sub-services to achieve functional partitioning. For example, one Promthues Server is responsible for collecting infrastructure-related monitoring indicators, and the other Prometheus Server is responsible for collecting application monitoring indicators. Upper Prometheus Server Aggregates Data
Environmental Instructions:
| system | Prometheus version |
|---|---|
| redhat8.2 | 2.31.1 |
10. Deploy Prometheus
10.1 First go to Prometheus to download the corresponding tar package
[root@localhost local]# wget https://github.com/prometheus/prometheus/releases/download/v2.31.1/prometheus-2.31.1.linux-amd64.tar.gz
10.2 Unzip tar package
[root@localhost local]# tar xf prometheus-2.31.1.linux-amd64.tar.gz
10.3 Soft connection for later operation
[root@localhost local]# pwd
/usr/local

[root@localhost local]# ln -s prometheus-2.31.1.linux-amd64 prometheus
10.4 Enter unzipped directory
[root@localhost local]# cd prometheus

[root@localhost prometheus]# vim prometheus.yml
 modify prometheus.yml Configuration file to configure the items to be monitored
// Here we monitor the status of another Linux host
# my global config
global:
  scrape_interval: 15s # Set the scrape interval to every 15 seconds. Default is every 1 minute.
  evaluation_interval: 15s # Evaluate rules every 15 seconds. The default is every 1 minute.
  # scrape_timeout is set to the global default (10s).

# Alertmanager configuration
alerting:
  alertmanagers:
    - static_configs:
        - targets:
          # - alertmanager:9093

# Load rules once and periodically evaluate them according to the global 'evaluation_interval'.
rule_files:
  # - "first_rules.yml"
  # - "second_rules.yml"

# A scrape configuration containing exactly one endpoint to scrape:
# Here it's Prometheus itself.
scrape_configs:
  # The job name is added as a label `job=<job_name>` to any timeseries scraped from this config.
  - job_name: "prometheus"
  - job_name: "linux"  // Write items to monitor here

    # metrics_path defaults to '/metrics'
    # scheme defaults to 'http'.

    static_configs:
      - targets: ["localhost:9090"]
      - targets: ["192.168.182.143:9100"]  //IP address of linux host
Here we control Prometheus through systemctl.
10.5 Provide service file
[root@localhost prometheus]# cat /usr/lib/systemd/system/prometheus.service
[Unit]
Description=prometheus server daemon
After=network.target

[Service]
Type=simple
ExecStart=/usr/local/prometheus/prometheus \
  --config.file=/usr/local/prometheus/prometheus.yml \
  --web.read-timeout=5m \
  --web.max-connections=512 \
  --storage.tsdb.retention=15d \
  --query.timeout=2m

ExecReload=/bin/kill -HUP $MAINPID
Restart=on-failure

[Install]
WantedBy=multi-user.target
10.6 Start Prometheus
// Reload service to make it work
[root@localhost prometheus]# systemctl daemon-reload
// Open Prometheus Service
[root@localhost prometheus]# systemctl start prometheus.service //Set boot-up self-start
[root@localhost prometheus]# systemctl enable --now prometheus.service
Created symlink /etc/systemd/system/multi-user.target.wants/prometheus.service → /usr/lib/systemd/system/prometheus.service.
[root@localhost prometheus]# systemctl status prometheus.service
● prometheus.service - prometheus server daemon
   Loaded: loaded (/usr/lib/systemd/system/prometheus.service; enabled; vendor preset: disabled)
   Active: active (running) since Thu 2021-11-25 20:40:18 CST; 4min 23s ago
 Main PID: 1739 (prometheus)
    Tasks: 7 (limit: 23790)
   Memory: 107.3M
10.7 Remember to restart the service after modifying the configuration file
[root@localhost prometheus]# systemctl restart prometheus.service
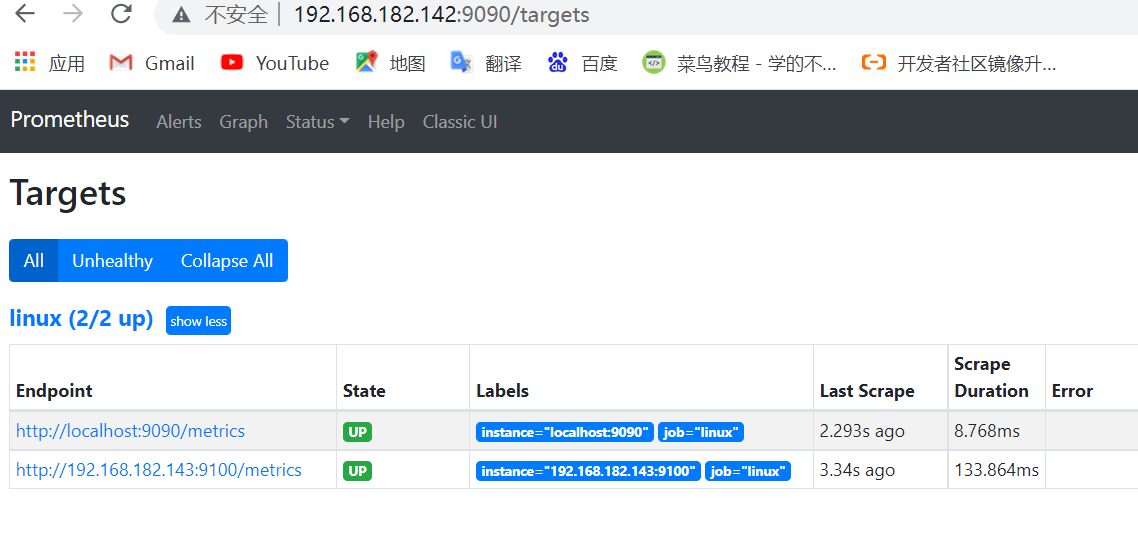
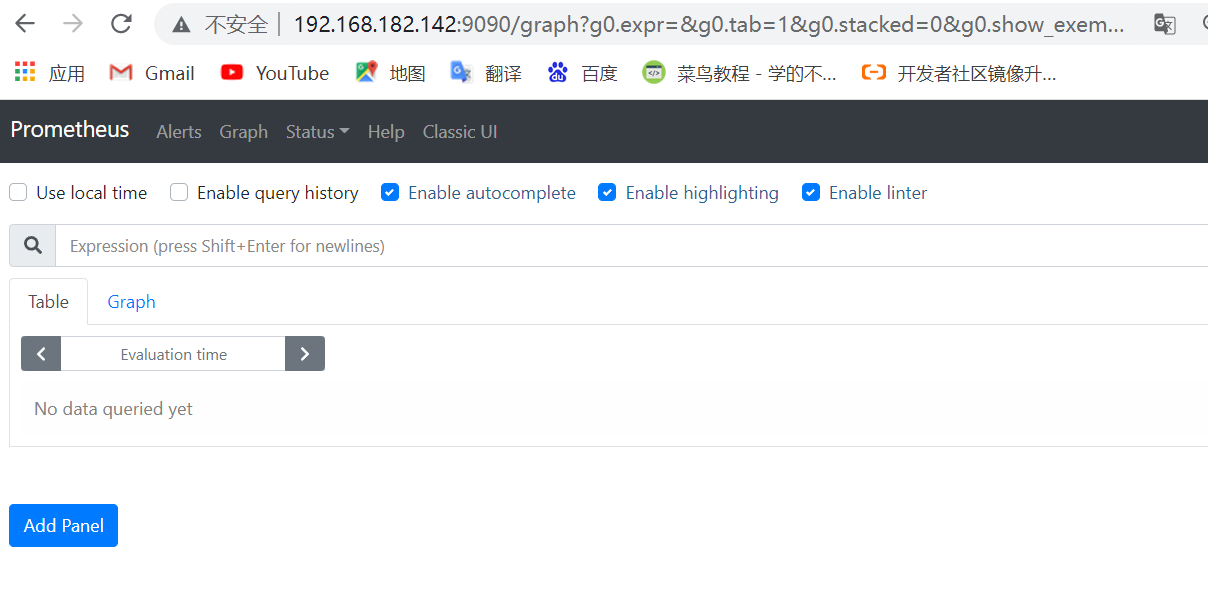
Here we access it by IP+port number
11.Download exporter on host 192.168.182.142
[root@localhost local]# wget https://github.com/prometheus/node_exporter/releases/download/v1.3.0/node_exporter-1.3.0.linux-amd64.tar.gz
11.1 Unzip the exporter package
[root@localhost local]# tar xf node_exporter-1.3.0.linux-amd64.tar.gz
11.2 Make Software Links
[root@localhost local]# ln -s node_exporter-1.3.0.linux-amd64 exporter
11.3 Provide service file
[root@localhost local]# cat /usr/lib/systemd/system/node_exporter.service
[Unit]
Description=Node Export
After=network.target
Documentation=https://prometheus.io/docs/guides/node-exporter/

[Service]
Type=simple
WorkingDirectory=/tmp/
ExecStart=/usr/local/exporter/node_exporter
Restart=on-failure

[Install]
WantedBy=multi-user.target
11.4 Start exporter
[root@localhost local]# systemctl daemon-reload
[root@localhost local]# systemctl start node_exporter.service

[root@localhost local]# systemctl status node_exporter.service
● node_exporter.service - Node Export
   Loaded: loaded (/usr/lib/systemd/system/node_exporter.service; disabled; vendor preset: disabled)
   Active: active (running) since Sun 2021-11-28 12:39:37 CST; 6s ago
     Docs: https://prometheus.io/docs/guides/node-exporter/
 Main PID: 10227 (node_exporter)
    Tasks: 4 (limit: 23790)
Click status and then target to see the target status.
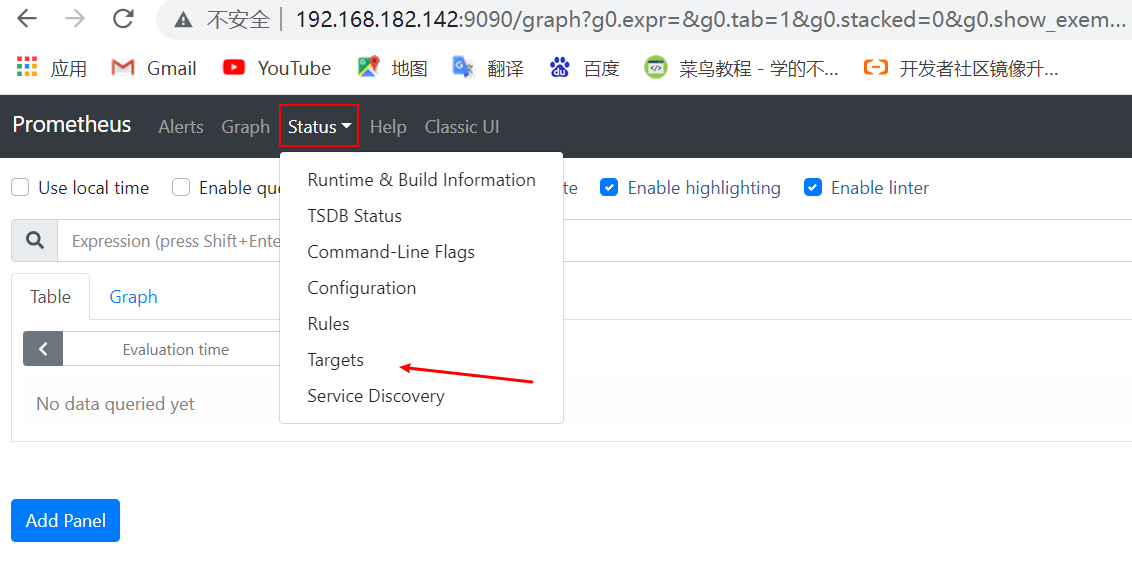
Two up instructions were successfully monitored.