Now that we have set up the stages of Viewer configuration, imagery and terrain for our application, we can add geocache data, the main focus of our application.
To facilitate visualization, Cesium supports popular vector formats GeoJson and KML, as well as an open source format of our own team. We specially developed [] CZML] for describing Cesium scenarios.( https://github.com/Analytical....
Regardless of the initial format, all spatial data in Cesium is represented by the Entity API. Entity API provides a flexible visualization in an effective way to render Cesium. Cesium Entity is a data object that can be paired with stylized graphical representations and located in space and time. A lot is provided in the test sandbox. An example of a simple Entity . To speed up on the basis of the Entity API, take a break from the application and read Visualizing Spatial Data tutorial.
Here are some examples of different entity types:
Once you have an Entity look, loading data sets with Cesium will become easy to understand. To read the data file, you need to create a data source suitable for the data format, DataSource, which parses the data file hosted in the specified URL and creates an EntityCollection containing Entity for each geospatial object in the data set. DataSource just defines an interface -- the exact type of data source you need will depend on the data format. For example, KML uses KmlDataSource source code. For example:
var kmlOptions = {
    camera : viewer.scene.camera,
    canvas : viewer.scene.canvas,
    clampToGround : true
};
// Load geocache points of interest from a KML file
// Data from : http://catalog.opendata.city/dataset/pediacities-nyc-neighborhoods/resource/91778048-3c58-449c-a3f9-365ed203e914
var geocachePromise = Cesium.KmlDataSource.load('./Source/SampleData/sampleGeocacheLocations.kml', kmlOptions);
The above code reads our sample geocahce point and calls KmlDataSource.load(optinos) with some configuration from a KML file. Camera and Canvas configuration items are required for a KmlDataSource. The clamptoGround option activates ground clamping, a popular description configuration for geometric entities such as polygons and ellipses that conform to the terrain and follow WGS84 ellipses.
Since these data are loaded asynchronously, a Proise is returned for the KmlDataSource, which will contain all our newly created entities.
If you are not familiar with the Promise API using asynchronous functions, the "asynchrony" here basically means that you should complete the required data in the provided callback functions. Then. In order to actually add these entity collections to the scenario, we have to wait until promise is complete, and then add the KmlDataSource to viewer. datasrouce. S. Cancel the following lines of comment:
// Add geocache billboard entities to scene and style them
geocachePromise.then(function(dataSource) {
    // Add the new data as entities to the viewer
    viewer.dataSources.add(dataSource);
});
By default, these newly created entities have useful functionality. Click to display the information box Infobox for the metadata associated with the entity, and double-click zoom and view the entity. To stop viewing the entity, click the "home" button, or click the "scratch out" camera icon on the "information box". Next, we will add custom style s to improve the look and feel of our application.
For KML and CZML files, declarative styles can be established in the files. However, for this application, let's practice designing our entities manually. To do this, we will take a similar approach. This style example Wait for our data source to load, then iterate over all entities in the data source set, modify and add attributes. By default, our geocache point tags are created as Billboards and Labels, so in order to modify the appearance of these entities, we do this:
// Add geocache billboard entities to scene and style them
geocachePromise.then(function(dataSource) {
    // Add the new data as entities to the viewer
    viewer.dataSources.add(dataSource);

    // Get the array of entities
    var geocacheEntities = dataSource.entities.values;

    for (var i = 0; i < geocacheEntities.length; i++) {
        var entity = geocacheEntities[i];
        if (Cesium.defined(entity.billboard)) {
            // Entity styling code here
        }
    }
});
We can improve the appearance of tags by adjusting their anchors, removing tags to reduce clutter and setting isplay Distance Conditions so that only points within a certain distance from the camera are visible.
// Add geocache billboard entities to scene and style them
if (Cesium.defined(entity.billboard)) {
    // Adjust the vertical origin so pins sit on terrain
    entity.billboard.verticalOrigin = Cesium.VerticalOrigin.BOTTOM;
    // Disable the labels to reduce clutter
    entity.label = undefined;
    // Add distance display condition
    entity.billboard.distanceDisplayCondition = new Cesium.DistanceDisplayCondition(10.0, 20000.0);
}
For more help on distance Display Conditions, see sandcastle example.
Next, let's improve the Infobox for each geocache entity. The title of the information box is the entity name, and the content is the entity description, which is displayed as HTML.
You will find that the default description is not very helpful. Since we are displaying geocache locations, let's update them to show the longitude and latitude of the points.
First, we convert the location of the entity into a map, then read longitude and latitude from Cartographic and add it to the description in the HTML table.
When clicked, our geocache entity will now display a well-formed Infobox that only needs the data we need.
// Add geocache billboard entities to scene and style them
if (Cesium.defined(entity.billboard)) {
    // Adjust the vertical origin so pins sit on terrain
    entity.billboard.verticalOrigin = Cesium.VerticalOrigin.BOTTOM;
    // Disable the labels to reduce clutter
    entity.label = undefined;
    // Add distance display condition
    entity.billboard.distanceDisplayCondition = new Cesium.DistanceDisplayCondition(10.0, 20000.0);
    // Compute longitude and latitude in degrees
    var cartographicPosition = Cesium.Cartographic.fromCartesian(entity.position.getValue(Cesium.JulianDate.now()));
    var longitude = Cesium.Math.toDegrees(cartographicPosition.longitude);
    var latitude = Cesium.Math.toDegrees(cartographicPosition.latitude);
    // Modify description
    // Modify description
    var description = '<table class="cesium-infoBox-defaultTable cesium-infoBox-defaultTable-lighter"><tbody>' +
        '<tr><th>' + "Longitude" + '</th><td>' + longitude.toFixed(5) + '</td></tr>' +
        '<tr><th>' + "Latitude" + '</th><td>' + latitude.toFixed(5) + '</td></tr>' +
        '</tbody></table>';
    entity.description = description;
}
Our geocache tag should now look like this: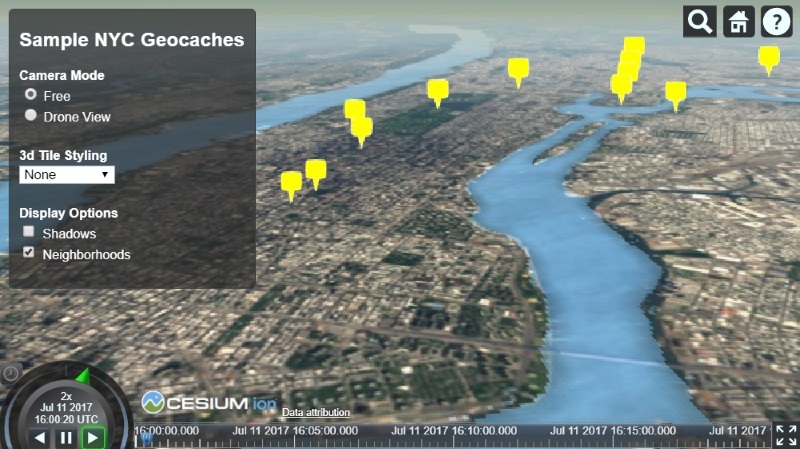
Visualizing the neighborhood of a particular point can also be helpful for our geographic applications. Let's try to record a GeoJson file containing polygons for each New York block. Loading the GeoJson file is ultimately very similar to the loading process we just used for KML. But in this case, we use GeoJson Data Source. As with the previous data source, we need to add it to viewer. data sources to actually add data to the scenario.
var geojsonOptions = {
    clampToGround : true
};
// Load neighborhood boundaries from KML file
var neighborhoodsPromise = Cesium.GeoJsonDataSource.load('./Source/SampleData/neighborhoods.geojson', geojsonOptions);

// Save an new entity collection of neighborhood data
var neighborhoods;
neighborhoodsPromise.then(function(dataSource) {
    // Add the new data as entities to the viewer
    viewer.dataSources.add(dataSource);
});
Let's adjust the neighborhood polygon we loaded. Like the billboard style we just made, we first iterate through neighborhood data source entities after the data source is loaded, this time checking that the polygons of each entity are defined:
// Save an new entity collection of neighborhood data
var neighborhoods;
neighborhoodsPromise.then(function(dataSource) {
    // Add the new data as entities to the viewer
    viewer.dataSources.add(dataSource);
    neighborhoods = dataSource.entities;

    // Get the array of entities
    var neighborhoodEntities = dataSource.entities.values;
    for (var i = 0; i < neighborhoodEntities.length; i++) {
        var entity = neighborhoodEntities[i];

        if (Cesium.defined(entity.polygon)) {
            // entity styling code here
        }
    }
});
Now that we are displaying neighborhood, let's rename each entity using neighborhood as its name. The original GeoJson file in our neighborhood is read as an attribute. Cesium stores the GeoJson attribute in enty.properties, so that we can set such a neighborhood name:
// entity styling code here

// Use geojson neighborhood value as entity name
entity.name = entity.properties.neighborhood;
We can assign each polygon to a new color material property and set random color colors through the Color Material Property instead of setting all regions to the same color.
// entity styling code here

// Set the polygon material to a random, translucent color.
entity.polygon.material = Cesium.Color.fromRandom({
    red : 0.1,
    maximumGreen : 0.5,
    minimumBlue : 0.5,
    alpha : 0.6
});

// Tells the polygon to color the terrain. ClassificationType.CESIUM_3D_TILE will color the 3D tileset, and ClassificationType.BOTH will color both the 3d tiles and terrain (BOTH is the default)
entity.polygon.classificationType = Cesium.ClassificationType.TERRAIN;
Finally, let's generate a label Label for each entity with some basic style options. To keep it neat, we can use Disability Depth Test Distance to keep Cesium's tags hidden from any 3D object.
Note, however, that the tag is always located at entity.position. Polygon is created from an undefined location because it has a list of locations that define the boundaries of a polygon. We can generate a position by taking the center of the polygon position:
// entity styling code here

// Generate Polygon position
var polyPositions = entity.polygon.hierarchy.getValue(Cesium.JulianDate.now()).positions;
var polyCenter = Cesium.BoundingSphere.fromPoints(polyPositions).center;
polyCenter = Cesium.Ellipsoid.WGS84.scaleToGeodeticSurface(polyCenter);
entity.position = polyCenter;
// Generate labels
entity.label = {
    text : entity.name,
    showBackground : true,
    scale : 0.6,
    horizontalOrigin : Cesium.HorizontalOrigin.CENTER,
    verticalOrigin : Cesium.VerticalOrigin.BOTTOM,
    distanceDisplayCondition : new Cesium.DistanceDisplayCondition(10.0, 8000.0),
    disableDepthTestDistance : 100.0
};
This gives us a polygon that looks like this: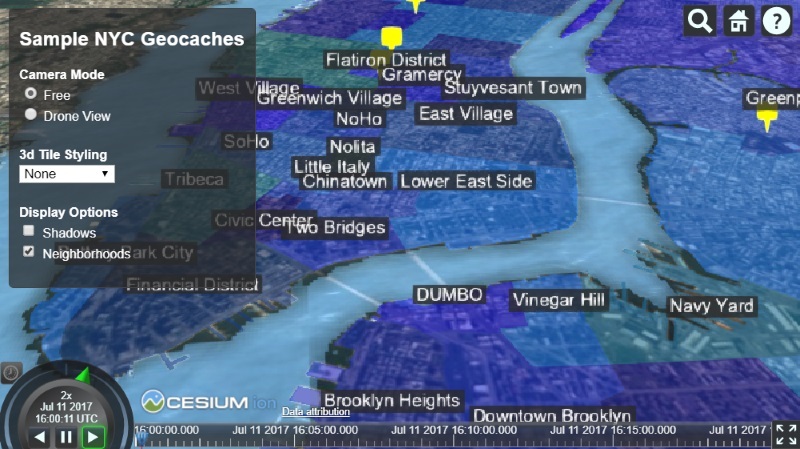
Finally, let's increase our NYC geocaches'high-tech perspective by adding UAV flights over cities.
Since flight paths are only a series of locations that vary over time, we can add these data from CZML files. CZML is a format for describing temporal dynamic graphical scenarios and is mainly used for display in Web browsers running Cesium. It describes lines, points, billboards, models, and other graphic primitives, and specifies how they change over time. CZML is the standard format for Cesium, equivalent to KML for Google Earth, which allows most Cesium features to be used through declarative style languages (in this case JSON mode).
Our CZML file defines an entity (default is a visual point) whose location is defined as a series of locations at different points in time. There are several attribute types in entity API that can be used to process time dynamic data. See the following demonstration example:
// Load a drone flight path from a CZML file
var dronePromise = Cesium.CzmlDataSource.load('./Source/SampleData/SampleFlight.czml');

dronePromise.then(function(dataSource) {
    viewer.dataSources.add(dataSource);
});
The CZML file uses Cesium to display UAV flight, and the path is an attribute of the entity's position over time. A path is visualized by connecting discrete points to a continuous line by interpolation.
Finally, let's improve the appearance of UAV flight. First, instead of simply solving the problem, we can load a 3D model to represent our UAV and attach it to the entity.
Cesium supports loading 3D models based on glTF (GL transport format), an open specification developed by the Cesium team with Khronos group to effectively load 3D models of applications by minimizing file size and run time processing. Is there no gLTF model? We provide an online converter that converts COLLADA and OBJ files into glTF format.
Let's load a UAV Model with good physics-based shadows and some animations:
var drone;
dronePromise.then(function(dataSource) {
    viewer.dataSources.add(dataSource);
    // Get the entity using the id defined in the CZML data
    drone = dataSource.entities.getById('Aircraft/Aircraft1');
    // Attach a 3D model
    drone.model = {
        uri : './Source/SampleData/Models/CesiumDrone.gltf',
        minimumPixelSize : 128,
        maximumScale : 1000,
        silhouetteColor : Cesium.Color.WHITE,
        silhouetteSize : 2
    };
});
Now our model looks good, but unlike the original point, the UAV model is directional, and it looks strange when the UAV moves forward. Fortunately, Cesium provides one VelocityOrientationProperty It will automatically calculate the direction based on the forward and backward sampling positions of an entity:
// Add computed orientation based on sampled positions
drone.orientation = new Cesium.VelocityOrientationProperty(drone.position);
Now our UAV model will be on schedule.
Another thing we can do is improve the appearance of our UAVs. From a distance, it may not be obvious, but UAV paths are made up of seemingly unnatural lines, because Cesium uses linear interpolation to construct paths from default sampling points. However, interpolation options can be configured.
In order to get a smoother flight path, we can change the interpolation options as follows:
// Smooth path interpolation
drone.position.setInterpolationOptions({
    interpolationDegree : 3,
    interpolationAlgorithm : Cesium.HermitePolynomialApproximation
});

Cesium Chinese Communication QQ Group: 807482793
This article is based on admin Creation, adoption Knowledge Sharing Signature 3.0 Mainland China Licensing Agreement License.
It can be reproduced and quoted freely, but the author should be signed and the source of the article should be indicated.