Introduction to Logstash
introduce
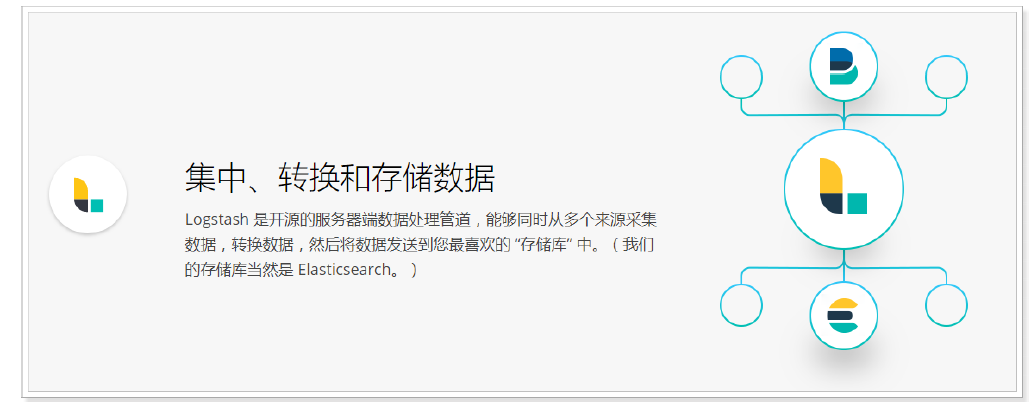
Logstash is an open source server-side data processing pipeline, which can collect data from multiple sources at the same time, convert data, and then send data to your favorite repository (our repository is ElasticSearch of course)
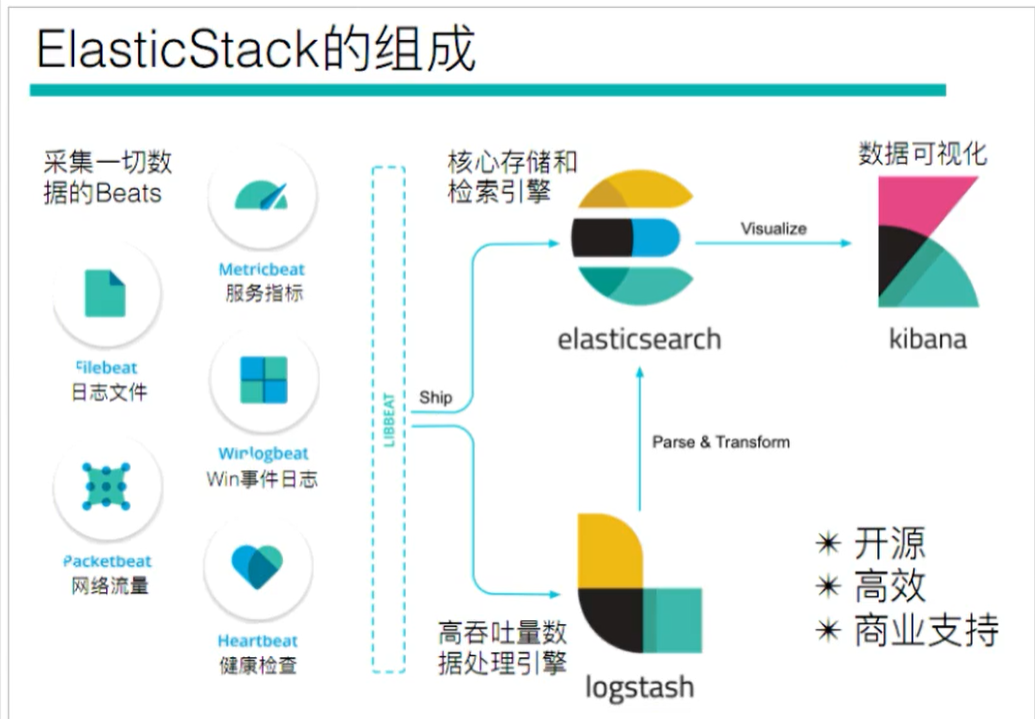
When we return to the architecture diagram of ElasticStack, we can see that logstack acts as the requirement of data processing. When our data needs to be processed, it will be sent to logstack for processing, otherwise it will be sent directly to ElasticSearch
purpose
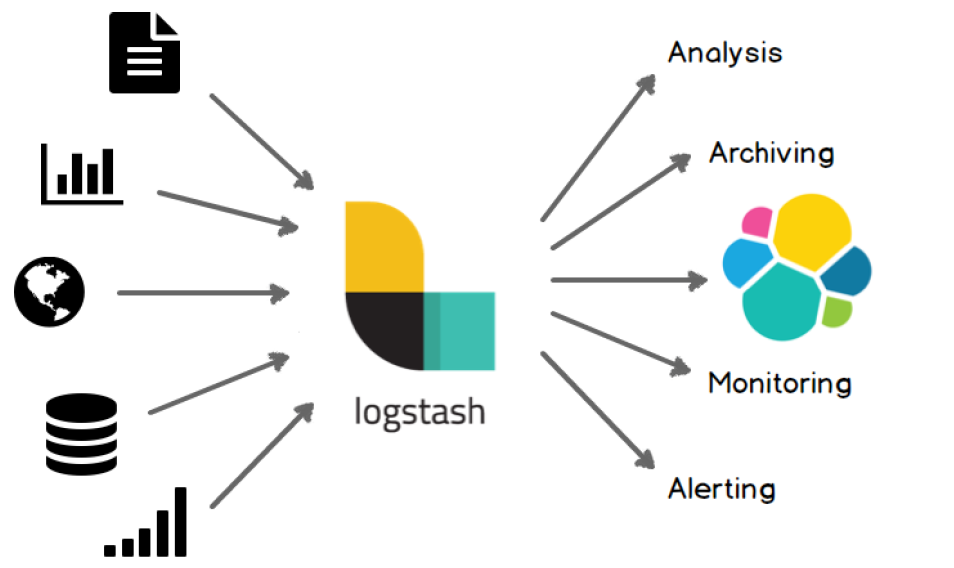
Logstash can process all kinds of inputs, from documents, charts =, databases, and then send them to
Deployment installation
Logstash mainly processes the data of the data source line by line, and also directly filters and cuts the data.
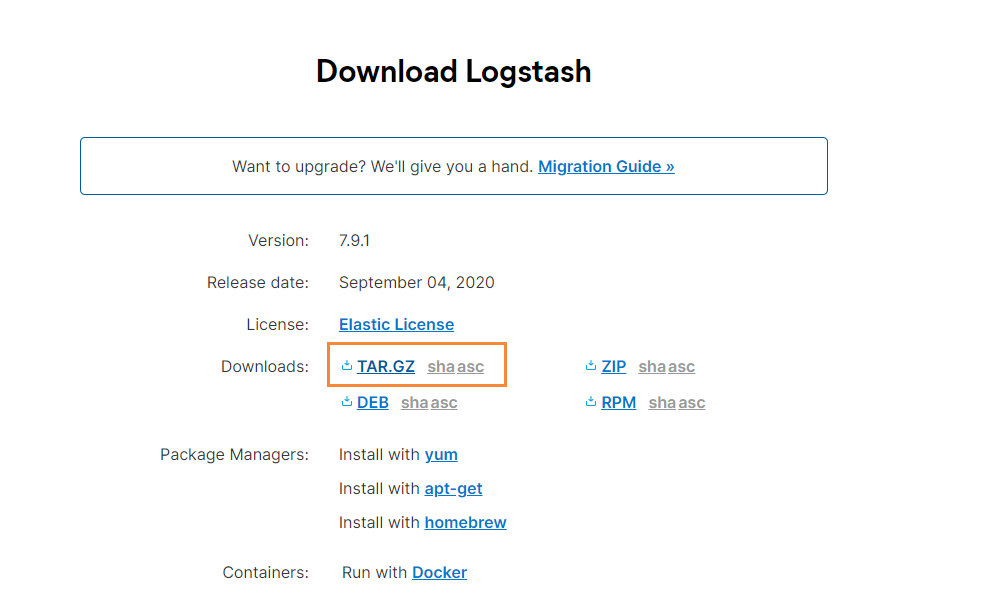
First, Download logstash from the official website: https://www.elastic.co/cn/downloads/logstash
Select the version we need to download:
After downloading, use the xftp tool to drop it into the server
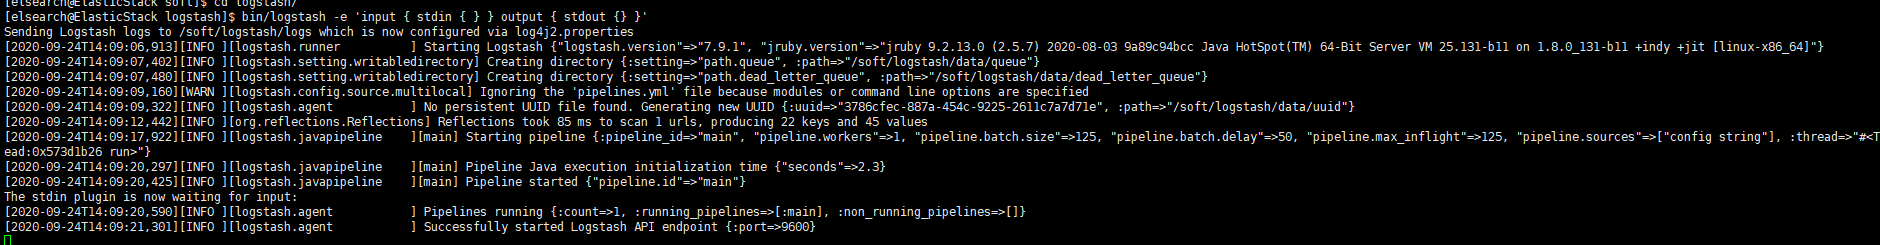
#Check the JDK environment and require jdk1 8+
java -version

#Unzip the installation package
tar -xvf logstash-7.9.1.tar.gz

#First logstash example
bin/logstash -e 'input { stdin { } } output { stdout {} }'
In fact, the original function of logstash is to collect data, but because the speed of logstash is relatively slow, beats is used to replace logstash later. When we use the above command to start, we can find it. Because logstash is written in java, we first need to start the virtual machine. Finally, the following figure is a screenshot of the completion of startup
test
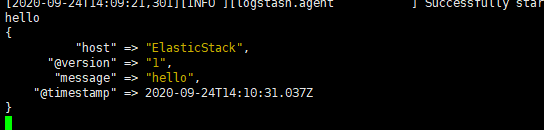
We type hello on the console and we'll see its output right away
Configuration details
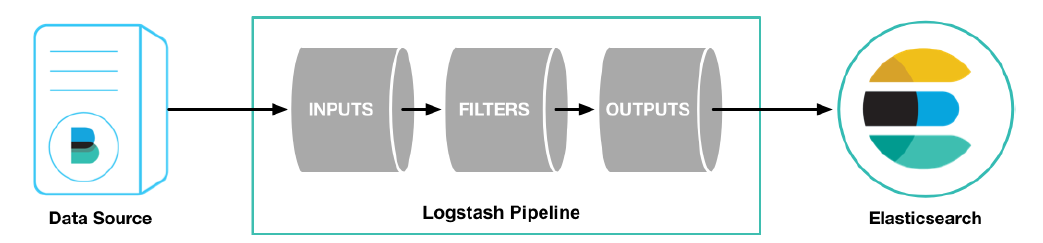
The Logstash configuration has three parts, as shown below
input { #input
stdin { ... } #Standard input
}
filter { #Filtering, data segmentation, interception and other processing
...
}
output { #output
stdout { ... } #standard output
}
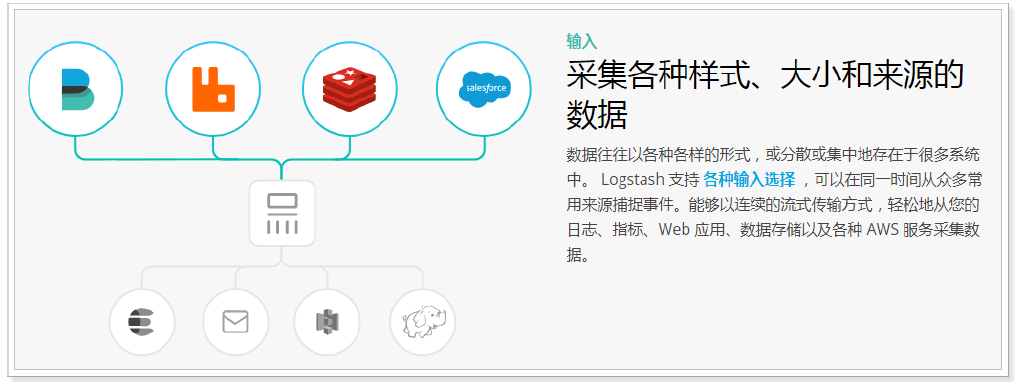
input
- Collect data of various styles, sizes and sources. The data often exist in many systems in various forms, or scattered or centralized.
- Logstash supports various input options and can capture events from many common sources at the same time. It can easily collect data from your logs, indicators, Web applications, data storage and various AWS services in a continuous streaming mode.
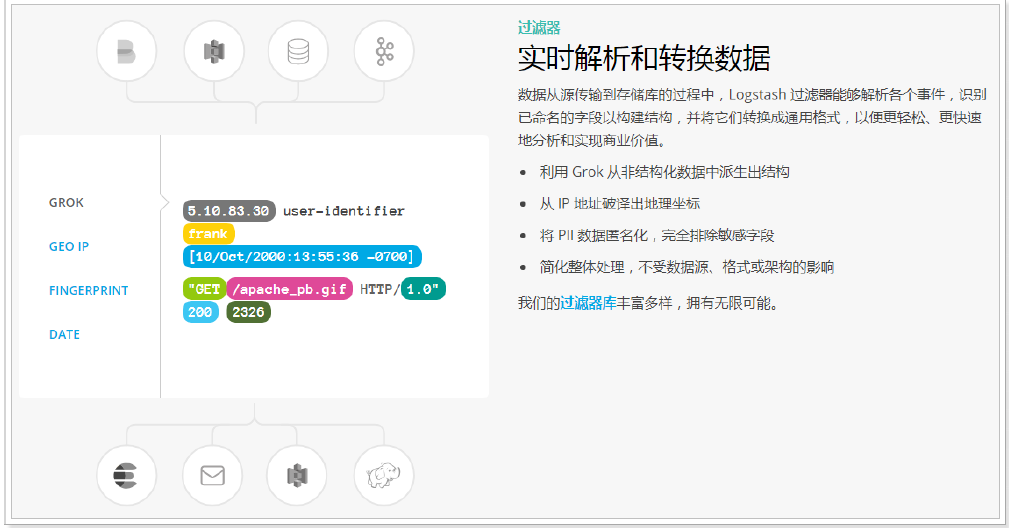
filter
- Analyze and convert data in real time
- In the process of data transfer from the source to the repository, the Logstash filter can parse various events, identify named fields to build structures, and convert them into a common format to analyze and realize business value more easily and quickly.
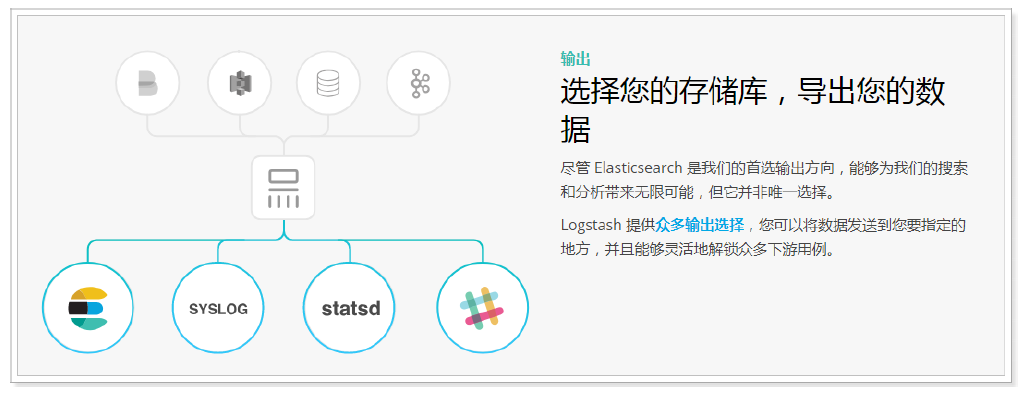
output
Logstash provides many output options. You can send data to the place you want to specify, and you can flexibly unlock many downstream use cases.
Read custom log
Previously, we read nginx logs through Filebeat. If it is a custom structure log, it needs to be read and processed before it can be used. Therefore, Logstash needs to be used at this time, because Logstash has strong processing power and can deal with various scenarios.
Log structure
2019-03-15 21:21:21|ERROR|1 Error reading data|Parameters: id=1002
It can be seen that the content in the log is segmented by "|". When using, we also need to segment the data.
Write configuration file
vim mogublog-pipeline.conf
Then add the following
input {
    file {
        path => "/soft/beats/logs/app.log"
        start_position => "beginning"
    }
}
filter {
    mutate {
        split => {"message"=>"|"}
    }
}
output {
    stdout { codec => rubydebug }
}
start-up
#start-up
./bin/logstash -f ./mogublog-pipeline.conf
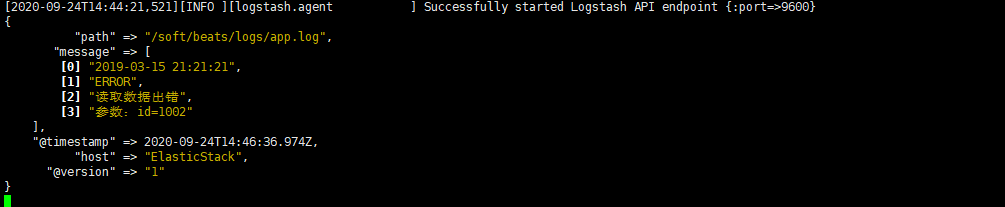
Then we insert our test data
echo "2019-03-15 21:21:21|ERROR|Error reading data|Parameters: id=1002" >> app.log
Then we can see that logstash will capture the data we just inserted, and our data will be segmented
Output to Elasticsearch
We can modify our configuration file and output our log records to ElasticSearch
input {
    file {
        path => "/soft/beats/logs/app.log"
        start_position => "beginning"
    }
}
filter {
    mutate {
        split => {"message"=>"|"}
    }
}
output {
    elasticsearch {
        hosts => ["127.0.0.1:9200"]
    }
}
Then restart our logstash
./bin/logstash -f ./mogublog-pipeline.conf
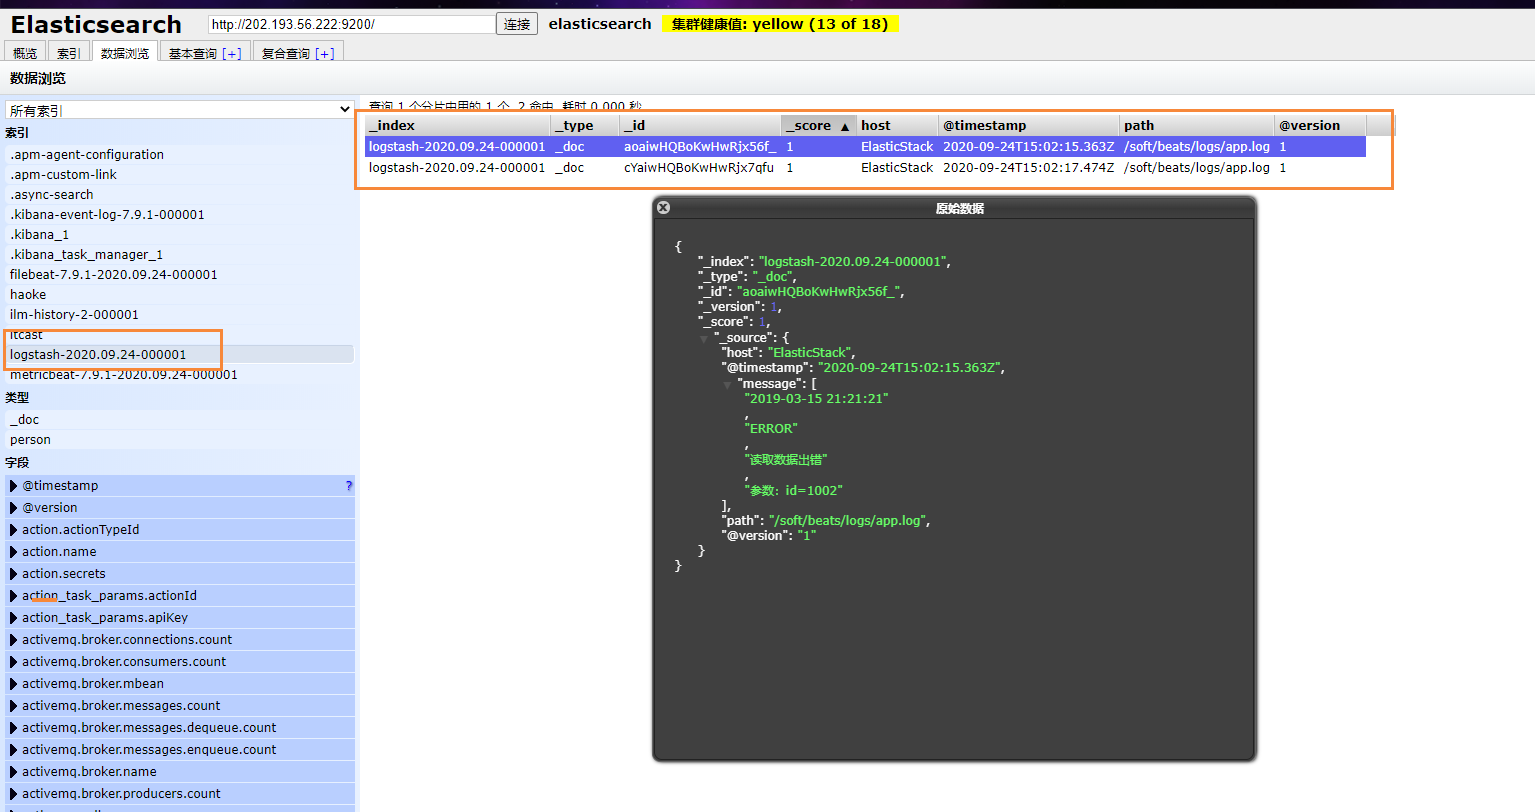
Then insert two pieces of data into the log record
echo "2019-03-15 21:21:21|ERROR|Error reading data|Parameters: id=1002" >> app.log
echo "2019-03-15 21:21:21|ERROR|Error reading data|Parameters: id=1002" >> app.log
Finally, we can see the data we just inserted
Background start
nohup ./filebeat -e -c mogu-dashboard.yml > catalina.out 2>&1 &