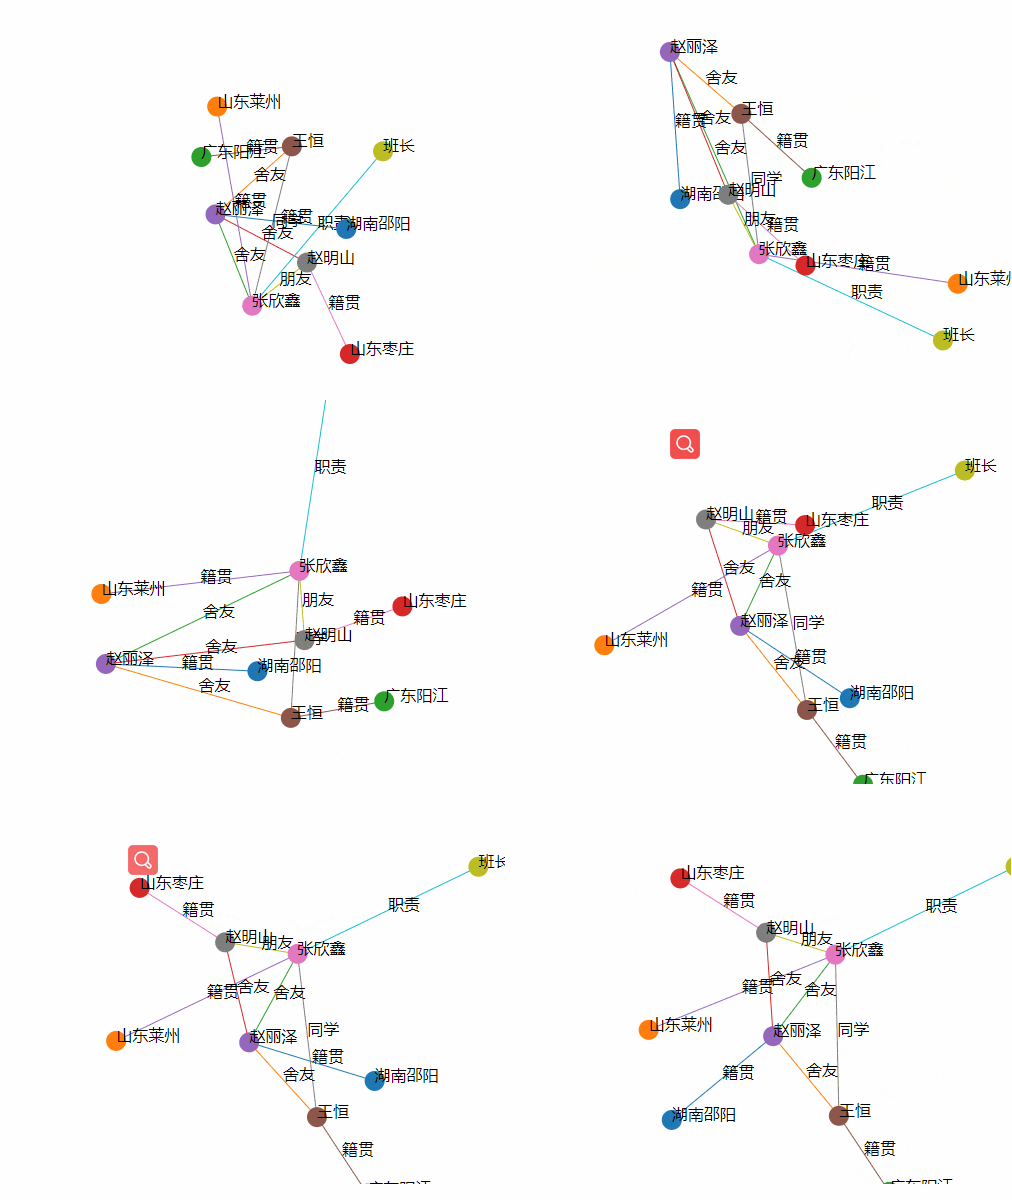
The concept of force oriented graph is not discussed in detail here. It is suitable for drawing relational information;
Here are a few knowledge points about the force guide diagram:
Create a new force map;
2,simulation.force(name[, force])
If force is specified, the force (mechanical model) of the specified name is added and the simulation is returned, as follows:
var simulation = d3.forceSimulation(nodes).force("charge", d3.forceManyBody());
If you want to remove the simulation of the corresponding name, you can specify null for it, as follows:
simulation.force("charge", null);
If nodes is specified, the nodes of the simulation are set to the specified array of objects, and their positions and speeds are created as required. Then, reinitialize and bind force to return the current simulation. If no nodes are specified, an array of nodes for the current simulation is returned.
Creates a spring force model based on the specified links and default parameters. If link is not specified, it defaults to an empty array.
If links is specified, it is set as the associated edge array of the spring force model, and the distance and strength parameters of each edge are recalculated to return to the current force model. If link is not specified, it returns the edge array of the current force model, which is empty by default.
In short, let the force guide diagram update and move at any time.
Create a new drag behavior and return to itself. Drag is not only an object, but also a function, which is usually applied to selected elements through selection.call.
d3.selectAll(".node").call(d3.drag().on("start", started));
With this new knowledge, we can start drawing
Code:
<!DOCTYPE html>
<html lang="en">
<head>
    <meta charset="UTF-8">
    <title>force</title>
    <script src="https://d3js.org/d3.v5.min.js"></script>
</head>
<body>

<svg height="400" width="500"></svg>

</body>

<script>

    //data
    var nodes = [//Node set
        {name:"Shaoyang, Hunan"},
        {name:"Laizhou, Shandong"},
        {name:"Yangjiang, Guangdong"},
        {name:"Zaozhuang, Shandong"},
        {name:"Zhao Li se"},
        {name:"Wang Heng"},
        {name:"Zhang Xin Xin"},
        {name:"Ming Shan Zhao"},
        {name:"Monitor"}
    ];
    var edges = [//Edge set
        {source:0,target:4,relation:"Native place",value:1.3},
        {source:4,target:5,relation:"Roommate",value:1},
        {source:4,target:6,relation:"Roommate",value:1},
        {source:4,target:7,relation:"Roommate",value:1},
        {source:1,target:6,relation:"Native place",value:2},
        {source:2,target:5,relation:"Native place",value:0.9},
        {source:3,target:7,relation:"Native place",value:1},
        {source:5,target:6,relation:"Classmate",value:1.6},
        {source:6,target:7,relation:"Friend",value:0.7},
        {source:6,target:8,relation:"Duty",value:2}
    ];

    var margin = 30;//Margin
    var svg = d3.select('svg');
    var width = svg.attr('width');
    var height = svg.attr('height');

    //Create a group and set the offset
    var g = svg.append('g').attr('transform','translate('+ margin +','+ margin +')');


    //Create a new color scale
    var scaleColor = d3.scaleOrdinal()
        .domain(d3.range(nodes.length))
        .range(d3.schemeCategory10);

    //Create a new force guide diagram
    var forceSimulation = d3.forceSimulation()
        .force("link",d3.forceLink())
        .force("charge",d3.forceManyBody())
        .force("center",d3.forceCenter());


    //Generate node data
    forceSimulation.nodes(nodes)
        .on('tick',linksTick);//This function will be explained below


    //Generate edge data
    forceSimulation.force('link')
        .links(edges)
        .distance(function (d,i) {
            return d.value*100;//Set side length
        });

    //Set drawing center point
    forceSimulation.force('center')
        .x(width/2)//Set x coordinate
        .y(height/2)//Set y coordinate

    //Let's look at vertex data and edge data
    console.log(nodes);
    console.log(edges);


    //Draw the edge. Note that the drawing order is hierarchical in d3. The first one is drawn below
    var links = g.append('g')
        .selectAll('line')
        .data(edges)
        .enter()
        .append('line')
        .attr('stroke',function (d,i) {
            return scaleColor(i);//Set edge color
        })
        .attr('storke-width','1');//Set border width


    //Draw text on edge
    var linksText = g.append('g')
        .selectAll('text')
        .data(edges)
        .enter()
        .append('text')
        .text(function (d,i) {
            return d.relation;
        });


    //Create node groups
    var gs = g.selectAll('.circle')
        .data(nodes)
        .enter()
        .append('g')
        .attr('transform',function (d,i) {
            return 'translate('+ d.x +','+ d.y +')'
        })
        .call(
            d3.drag()//The drag gesture on the mobile end is divided into three stages
                .on('start',start)
                .on('drag',drag)
                .on('end',end)
        );

    //Draw nodes
    gs.append('circle')
        .attr('r',10)
        .attr('fill',function (d,i) {
            return scaleColor(i);
        });

    //Draw text
    gs.append('text')
        .text(function (d,i) {
            return d.name;
        });


    function linksTick(){
        links
            .attr("x1",function(d){return d.source.x;})
            .attr("y1",function(d){return d.source.y;})
            .attr("x2",function(d){return d.target.x;})
            .attr("y2",function(d){return d.target.y;});

        linksText
            .attr("x",function(d){
                return (d.source.x+d.target.x)/2;
            })
            .attr("y",function(d){
                return (d.source.y+d.target.y)/2;
            });

        gs && gs.attr('transform',function (d,i) {
            return 'translate('+ d.x +','+ d.y +')';
        })

    }


    function start(d){
        if(!d3.event.active){//The event.active attribute judges the start event and end event in the sequence of concurrent drag gestures: 0 at the beginning of the drag gesture and 0 at the end of the last drag gesture
            //This is the process of drag
            forceSimulation.alphaTarget(0.8).restart();//Set the attenuation coefficient to simulate the movement process of node position. The higher the value is, the faster the movement is. The numerical range [0, 1]
        }
        d.fx = d.x;
        d.fy = d.y;
    }

    function drag(d){
        d.fx = d3.event.x;
        d.fy = d3.event.y;
    }

    function end(d) {
        if (!d3.event.active) {
            forceSimulation.alphaTarget(0);
        }
        d.fx = null;
        d.fy = null;
    }


</script>

</html>
Effect:
