Python wechat ordering applet course video
https://edu.csdn.net/course/detail/36074
Python actual combat quantitative transaction financial management system
https://edu.csdn.net/course/detail/35475
This article has been included https://github.com/lkxiaolou/lkxiaolou Welcome, star.
In Java, we use Junit as unit test, JMH as performance benchmark, async profiler to analyze cpu performance, and jstack, jmap, arthas, etc. to troubleshoot problems.
As a relatively new programming language, are these tools of golang easier to use?
unit testing
Java unit testing requires the use of third-party libraries, usually Junit, which is complex to configure. After using golang, I found that the unit test provided by golang is really very simple.
If we have a cal Go file, then its corresponding unit test file is cal_test.go, in which the method name must be TestXxx. This method of unit testing according to the name is simple and effective. It is also commonly known as "Convention is greater than configuration".
Let's take a simple example:
package unit

func add(a int, b int) int {
   return a + b
}

func sub(a int, b int) int {
   return a - b
}
package unit

import (
    "github.com/stretchr/testify/assert"
    "testing"
)

func TestAdd(t *testing.T) {
    assert.Equal(t, 10, add(5, 5))
}

func TestSub(t *testing.T) {
    assert.Equal(t, 0, sub(5, 5))
}
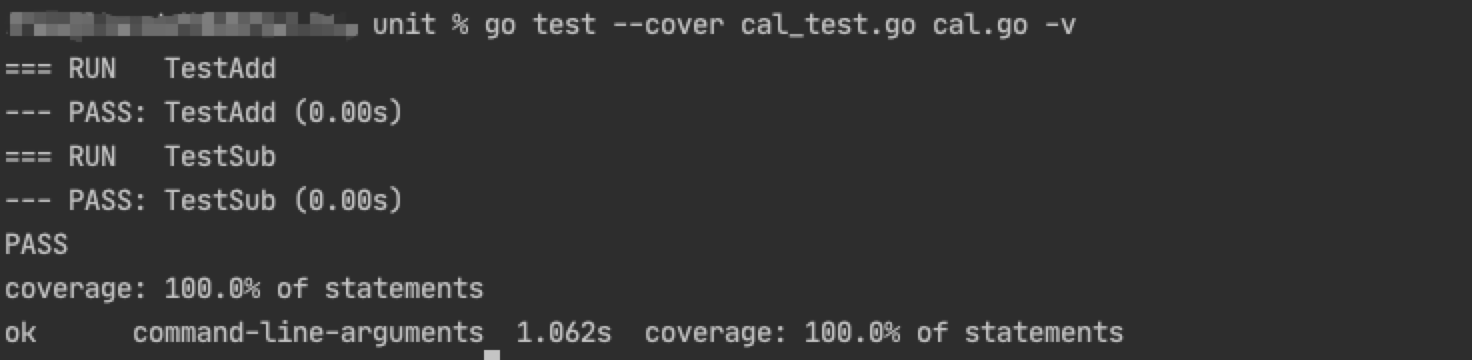
To execute a unit test, you only need to run it (refer to go help test for more usage)
go test --cover cal_test.go cal.go -v
benchmark
Similar to unit testing, golang's benchmark is also out of the box. In CAL_ test. Add a benchmark add method based on go
package unit

import (
   "github.com/stretchr/testify/assert"
   "testing"
)

func TestAdd(t *testing.T) {
   assert.Equal(t, 10, add(5, 5))
}

func TestSub(t *testing.T) {
   assert.Equal(t, 0, sub(5, 5))
}

func BenchmarkAdd(b *testing.B) {
   for i:= 0; i < b.N; i++ {
      add(5, 5)
   }
}
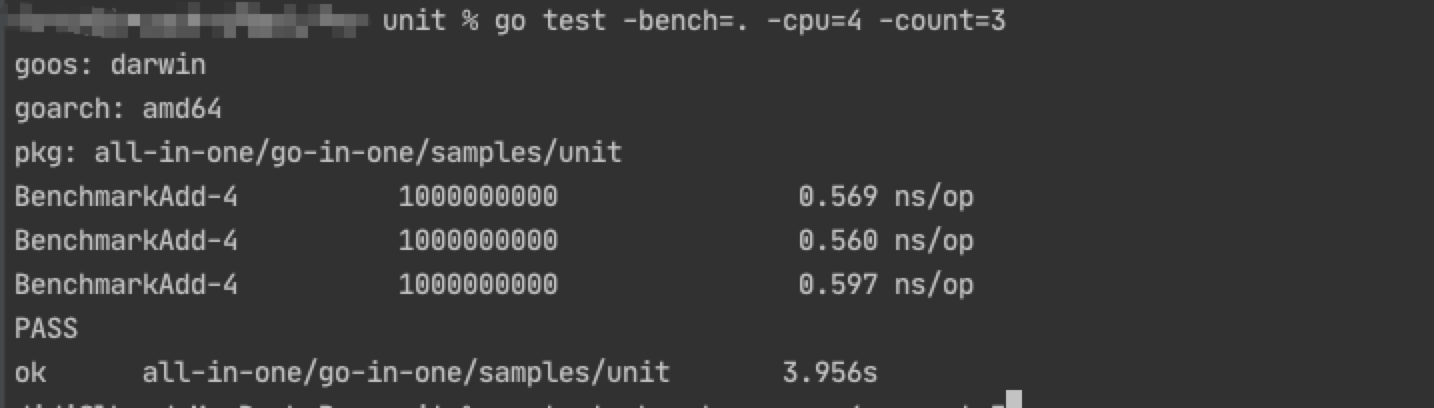
Just execute it (refer to go help test for more usage)
go test -bench=. -cpu=4 -count=3
pprof
pprof is a tool that comes with golang and can be used for cpu, memory and lock analysis. It is very similar to java async profiler.
It is very simple to use one port in the HTTP / ROF / ROF package.
A simple example is as follows:
package main

import (
    "fmt"
    "log"
    "net/http"
    "time"
    _ "net/http/pprof"
)

func main() {
    go func() {
        //example: visit http://127.0.0.1:6060/debug/pprof in browser.
        err := http.ListenAndServe("0.0.0.0:6060", nil)
        if err != nil {
            fmt.Println("failed to start pprof goroutine:", err)
        }
    }()

    http.HandleFunc("/", handler)
    log.Fatal(http.ListenAndServe("localhost:8000", nil))
}

func handler(w http.ResponseWriter, r *http.Request) {
    time.Sleep(1 * time.Second)
    eat()
    time := time.Now().Unix() * 2 + 1000000
    fmt.Fprintf(w, "URL.Path = %q; time = %d\n", r.URL.Path, time)
}

func eat() {
    loop := 10000000000
    for i := 0; i < loop; i++ {
        // do nothing
    }
}
On the command line, enter
go tool pprof http://127.0.0.1:6060/debug/pprof/profile
At the same time, I keep asking for pprof to collect data. Here is my request
curl http://127.0.0.1:8000/hello
After waiting for 30 seconds, the address of the acquisition file will be displayed when the acquisition is completed
Saved profile in /Users/roshi/pprof/pprof.samples.cpu.003.pb.gz
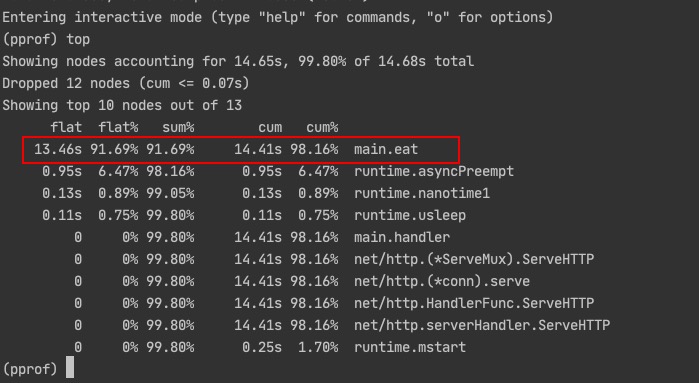
At this time, you can use commands such as top to directly view functions that consume too much cpu. For more commands, you can use help to view.
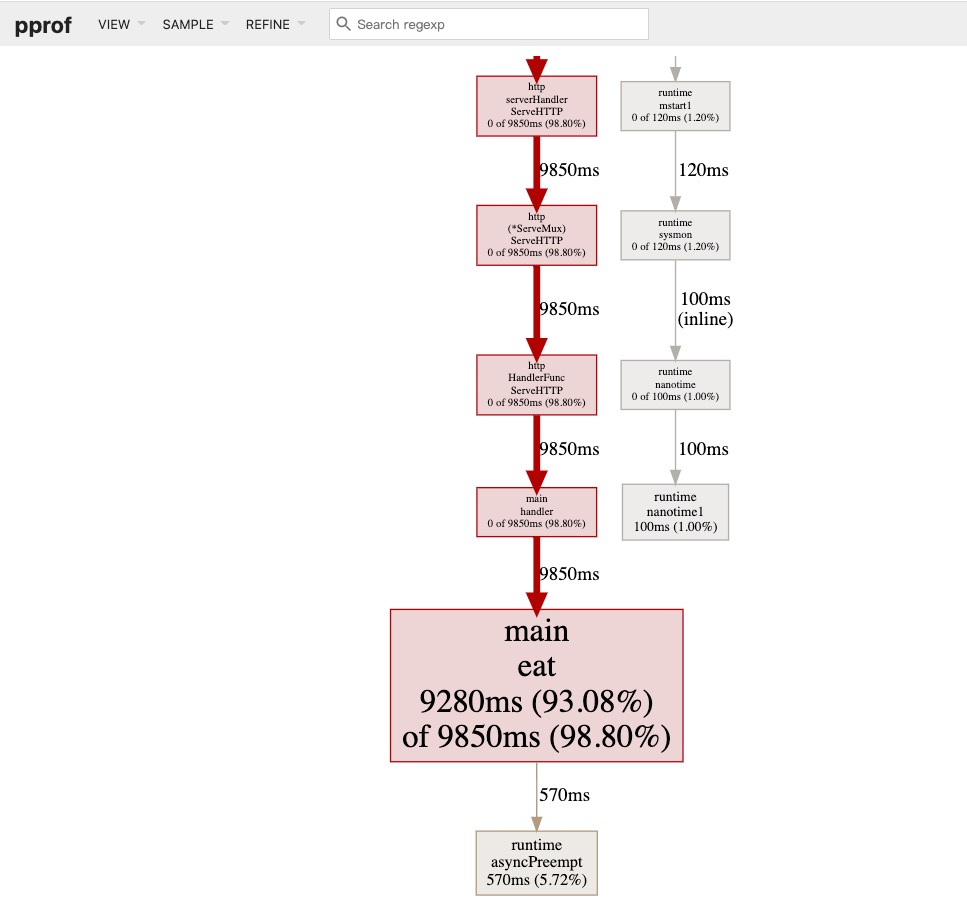
Or download the file and analyze it with a visual interface. You can use
go tool pprof -http=":8080" /User/roshi/pprof/pprof.samples.cpu.003.pb.gz
To open a visual page and view it. If an error is reported and graphviz needs to be installed, the installation documents can be found here: https://graphviz.gitlab.io/download/
visit http://localhost:8080/ui/ You can see the following figure. The block with the largest area represents the one that consumes the most cpu
Here is an article that introduces pprof very carefully. You can refer to: https://blog.wolfogre.com/posts/go-ppof-practice/
dlv
Pprof is easy to use, but one disadvantage is that it must be opened in the code in advance. If there is a problem online and pprof is not opened, tools such as jstack, jmap, arthas and so on may be needed for troubleshooting. Here we recommend dlv, a very useful tool for troubleshooting golang problems, which has been used recently. See for the project address
https://github.com/go-delve/delve
One of its useful functions is attach. You can attach to the running golang program and view the goroutine. This can be a good way to troubleshoot online problems.
The installation of each platform is clearly written on github. It should be noted that the golang version of dlv installed should be consistent with the golang version of the process to be checked.
First write a test program and start two goroutine s, one running and one blocking
package main

import (
   "fmt"
   "sync"
)

func main()  {
   go count()
   go wait()
   wait()
}

func count()  {
   count := 0
   for {
      count = count + 1
      if count % 1000000000 == 0 {
         fmt.Println("I'm a running routine")
      }
   }
}

func wait()  {
   wg := sync.WaitGroup{}
   wg.Add(1)
   wg.Wait()
}
Run it, and then use dlv to attach, as shown in the following figure (for specific commands, use help after attaching)
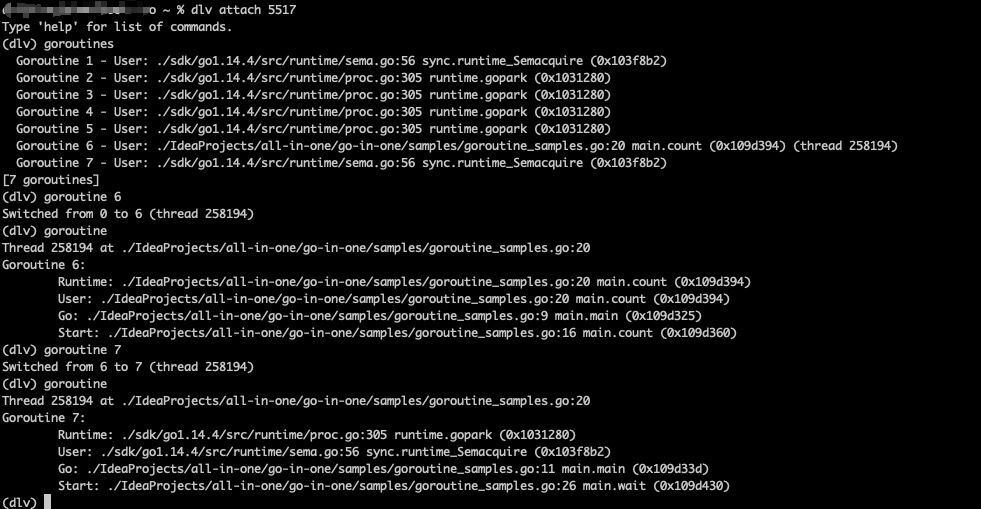
This makes it easy to see what each goroutine is doing
Write at the end
As a relatively new programming language, golang takes the essence of existing languages and brings the necessary tools to further reduce the threshold, which is very friendly to novice learning.
Search focuses on official account of WeChat public, bug catch, technology sharing, architecture design, performance optimization, source code reading, problem checking, and paging practice.