Zhao Huabing, senior engineer of Tencent cloud, Istio Member, management member of ServiceMesher, contributor of Istio project, is keen on open source, network and cloud computing. At present, it is mainly engaged in open source and R & D of service grid.
introduction
TCM (Tencent Cloud Mesh) is a Service Mesh hosting service based on Istio and fully compatible with Istio API provided by Tencent cloud. It can help users quickly take advantage of the traffic management and service governance capabilities provided by Service Mesh with less migration cost and maintenance cost. This series of articles will introduce best practices on TCM. This article will introduce how to use Spring and OpenTracing to simplify the Tracing context passing of applications, and how to realize fine-grained call Tracing at the method level based on the inter process call Tracing provided by Istio.
Distributed call tracing and OpenTracing specification
What is distributed call tracing?
Compared with the traditional "boulder" application, a major change of microservice is to split different modules in the application into independent processes. Under the original RPC framework, the method is called across the micro process. Compared with the method call of a single process, the debugging and fault analysis of cross process call is very difficult. It is difficult to view and analyze the distributed call with the traditional debugger or log printing.
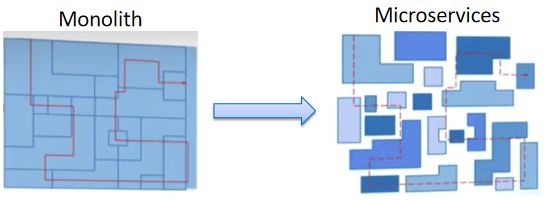
As shown in the figure above, a request from the client goes through multiple microservice processes. If you want to analyze the request, you must collect and correlate the relevant information of all services that the request passes through, which is called "distributed call tracking".
What is OpenTracing?
CNCF OpenTracing project
OpenTracing yes CNCF A project under the cloud native Computing Foundation, which includes a set of standard specifications for distributed call tracking, API s in various languages, programming frameworks and function libraries. The purpose of OpenTracing is to define a set of standards for distributed call tracing to unify the implementation of various distributed call tracing. At present, there is a lot of support Tracer implementation of OpenTracing specification , including Jager,Skywalking,LightStep, etc. Using OpenTracing API to realize distributed call tracing in microservice applications can avoid vendor locking and connect with any OpenTracing compatible infrastructure at the least cost.
OpenTracing conceptual model
See the conceptual model of OpenTracing in the figure below:
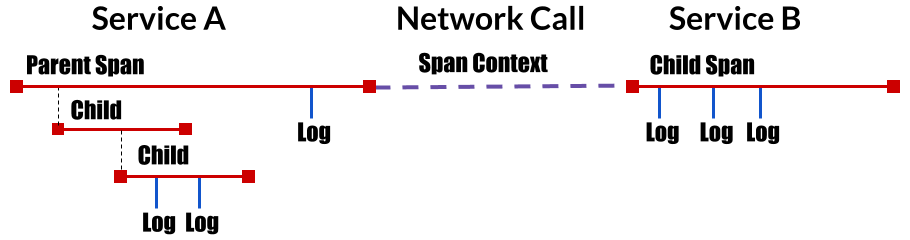 Figure from https://opentracing.io/
As shown in the figure, OpenTracing mainly includes the following concepts:
- Trace: describes an end-to-end transaction in a distributed system, such as a request from a client.
- Span: an operation with name and time length, such as a REST call or database operation. Span is the smallest tracking unit of distributed call tracking. A Trace consists of multiple spans.
- Span context: context information of distributed call tracking, including Trace id, Span id and other contents that need to be passed to downstream services. An OpenTracing implementation needs to pass the span context on the process boundary through some kind of serialization mechanism (Wire Protocol), so as to associate the spans in different processes to the same Trace. These wire protocols can be text-based, such as HTTP header s, or binary protocols.
OpenTracing data model
A Trace can be regarded as a directed acyclic graph (DAG graph) composed of multiple interrelated spans. The following figure shows a Trace composed of 8 spans:
        [Span A]  ←←←(the root span)
            |
     +------+------+
     |                |
 [Span B]      [Span C] ←←←(Span C is a `ChildOf` Span A)
     |                  |
 [Span D]      +---+-------+
                   |              |
               [Span E]    [Span F] >>> [Span G] >>> [Span H]
                                                    ↑
                                                    ↑
                                                    ↑
                            (Span G `FollowsFrom` Span F)
The trace in the above figure can also be expressed in chronological order as follows:
––|–––––––|–––––––|–––––––|–––––––|–––––––|–––––––|–––––––|–> time
 [Span A···················································]
   [Span B··············································]
      [Span D··········································]
    [Span C········································]
         [Span E·······]        [Span F··] [Span G··] [Span H··]
The data structure of Span includes the following contents:
- Name: the name of the operation represented by span, such as the resource name corresponding to the REST interface.
- Start timestamp: the start time of the operation represented by span
- Finish timestamp: the end time of the operation represented by span
- Tags: a series of tags. Each tag consists of a key value pair. The tag can be any information conducive to call analysis, such as method name, URL, etc.
- SpanContext: used to transfer Span related information across process boundaries. It needs to be used in combination with a Wire Protocol.
- References: other related spans referenced by this Span. There are mainly two kinds of reference relationships, Childof and FollowsFrom.
- Childof: the most commonly used reference relationship, which indicates that there is a direct dependency between Parent Span and Child Span. For example, the relationship between RPC server Span and RPC client Span, or database SQL insert Span and ORM Save action Span.
- FollowsFrom: if the Parent Span does not depend on the execution result of the Child Span, it can be represented by FollowsFrom. For example, an email notification will be sent to the user after online store shopping payment, but whether the email notification is sent successfully or not will not affect the status of successful payment. This situation is applicable to follow from.
Cross process call information propagation
SpanContext is a confusing concept in OpenTracing. In the conceptual model of OpenTracing, SpanContext is mentioned to transfer the context of distributed calls across process boundaries. But in fact, OpenTracing only defines an abstract interface of SpanContext, which encapsulates the relevant context content of a Span in the distributed call, including the Trace id, Span id and other information that needs to be passed to the downstream service. SpanContext itself cannot realize cross process context transfer. Tracer (tracer is an implementation following OpenTracing protocol, such as Jaeger and Skywalking tracer) needs to serialize SpanContext and transfer it to the next process through Wire Protocol, and then deserialize SpanContext in the next process to obtain relevant context information, To generate a Child Span.
In order to provide maximum flexibility for various specific implementations, OpenTracing only puts forward the requirement of transmitting SpanContext across processes, and does not specify the specific implementation method of serializing SpanContext and transmitting it in the network. Different tracers can use different wire protocols to transfer SpanContext according to their own situation.
In distributed calls based on HTTP protocol, HTTP Header is usually used to transfer the content of SpanContext. Common wire protocols include those used by Zipkin b3 HTTP header , used by Jaeger uber-trace-id HTTP Header , the "x-ot-span-context" HTTP Header used by LightStep. Istio/Envoy supports b3 header and x-ot-span-context header, and can interface with Zipkin,Jaeger and LightStep. Examples of B3 HTTP headers are as follows:
X-B3-TraceId: 80f198ee56343ba864fe8b2a57d3eff7
X-B3-ParentSpanId: 05e3ac9a4f6e3b90
X-B3-SpanId: e457b5a2e4d86bd1
X-B3-Sampled: 1
Istio support for distributed call tracing
Istio/Envoy provides distributed call tracking for microservices out of the box. In the micro service system with istio and Envoy installed, Envoy will intercept the incoming and outgoing requests of the service and automatically generate call tracking data for each call request of the micro service. By accessing a distributed tracking back-end system in the service grid, such as zipkin or Jaeger, you can view the details of a distributed request, such as which services the request passes through, which REST interface is called, and the time spent on each REST interface.
It should be noted that although Istio/Envoy has completed most of the work in this process, it still requires a small amount of modification to the application code: in the application code, it needs to copy the b3 header in the upstream HTTP request received to the header of the HTTP request initiated to the downstream, so as to pass the call tracking context to the downstream service. This part of the code cannot be done by Envoy because Envoy is not aware of the business logic in the service it represents and cannot associate the incoming and outgoing requests according to the business logic. Although the amount of code in this part is small, it needs to modify the code of each HTTP request, which is very cumbersome and easy to be omitted. Of course, the code that initiates the HTTP request can be encapsulated into a code base for use by the business module to simplify the work.
Here is a simple online store example program to show how Istio provides distributed call tracing. The sample program is composed of eshop,inventory, billing and delivery microservices. The structure is shown in the following figure:
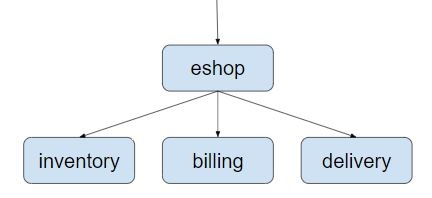
eshop micro service receives requests from clients, then calls inventory, billing, delivery REST interfaces of these back-end micro services to achieve checkout business logic for users to purchase goods. The code of this example can be downloaded from github: https://github.com/aeraki-framework/method-level-tracing-with-istio
As shown in the following code, we need to pass b3 HTTP Header in the application code of eshop microservice.
 @RequestMapping(value = "/checkout")
public String checkout(@RequestHeader HttpHeaders headers) {
    String result = "";
    // Use HTTP GET in this demo. In a real world use case,We should use HTTP POST
    // instead.
    // The three services are bundled in one jar for simplicity. To make it work,
    // define three services in Kubernets.
    result += restTemplate.exchange("http://inventory:8080/createOrder", HttpMethod.GET,
            new HttpEntity<>(passTracingHeader(headers)), String.class).getBody();
    result += "<BR>";
    result += restTemplate.exchange("http://billing:8080/payment", HttpMethod.GET,
            new HttpEntity<>(passTracingHeader(headers)), String.class).getBody();
    result += "<BR>";
    result += restTemplate.exchange("http://delivery:8080/arrangeDelivery", HttpMethod.GET,
            new HttpEntity<>(passTracingHeader(headers)), String.class).getBody();
    return result;
}
private HttpHeaders passTracingHeader(HttpHeaders headers) {
    HttpHeaders tracingHeaders = new HttpHeaders();
    extractHeader(headers, tracingHeaders, "x-request-id");
    extractHeader(headers, tracingHeaders, "x-b3-traceid");
    extractHeader(headers, tracingHeaders, "x-b3-spanid");
    extractHeader(headers, tracingHeaders, "x-b3-parentspanid");
    extractHeader(headers, tracingHeaders, "x-b3-sampled");
    extractHeader(headers, tracingHeaders, "x-b3-flags");
    extractHeader(headers, tracingHeaders, "x-ot-span-context");
    return tracingHeaders;
}
Let's test the eshop example program. We can build a Kubernetes cluster and install Istio for testing. For convenience, you can directly use the fully hosted service grid provided by Tencent cloud TCM And add a container service to the created Mesh TKE Cluster to test.
Deploy the program in the TKE cluster to see the effect of Istio distributed call tracking.
git clone git@github.com:aeraki-framework/method-level-tracing-with-istio.git
cd method-level-tracing-with-istio
git checkout without-opentracing
kubectl apply -f k8s/eshop.yaml
- Open address in browser: http://${INGRESS_EXTERNAL_IP}/checkout To trigger a call to the REST interface of the eshop sample program.
- Open the interface of TCM in the browser to view the generated distributed call tracking information.
The TCM graphical interface visually shows the detailed information of the call. You can see that the client request has entered from the Ingressgateway to the system, and then invoked the checkout interface of the eshop micro service. The checkout call has three child span, corresponding to the REST interface of inventory, billing and delivery three micro services, respectively. 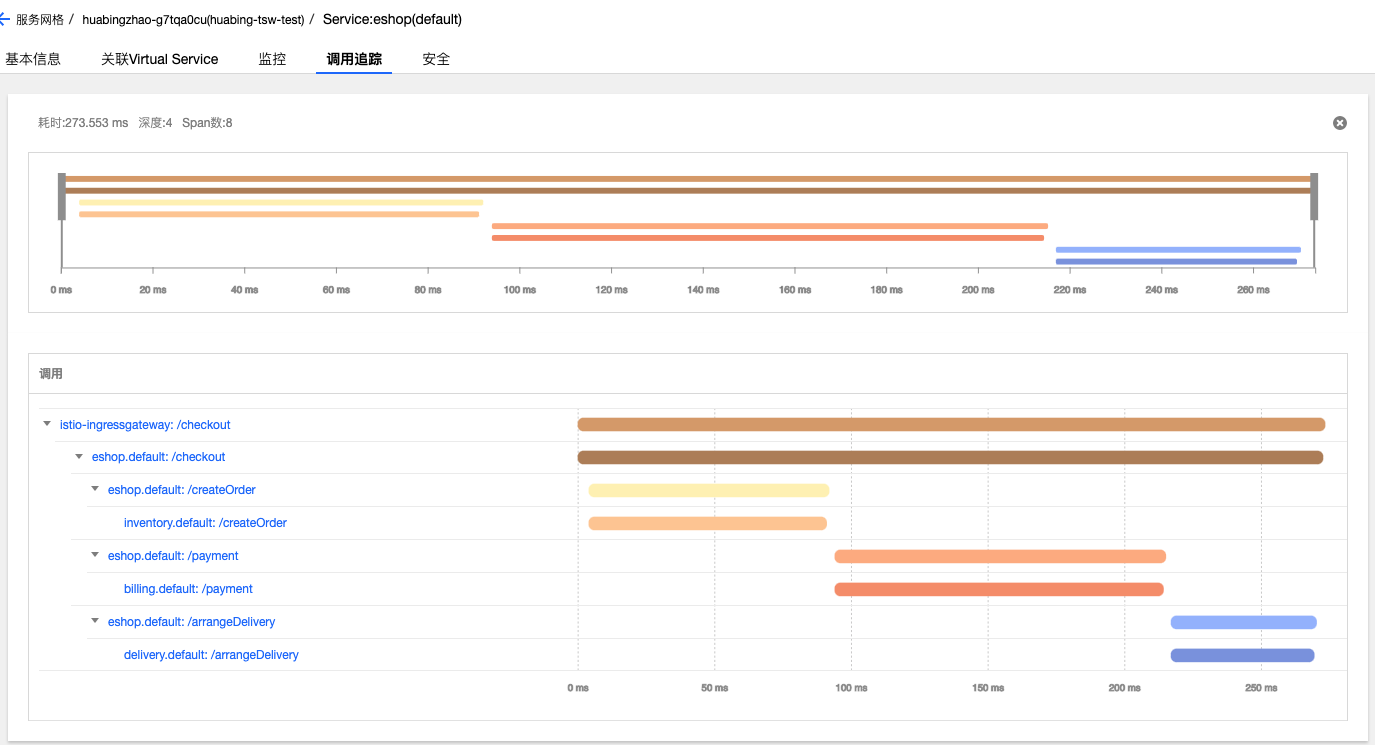
Use OpenTracing to pass distributed trace context
OpenTracing provides Spring based code embedding points, so we can use the OpenTracing Spring framework to provide HTTP header delivery to avoid this part of hard coding. Using OpenTracing in Spring to transfer the distributed tracking context is very simple. It only needs the following two steps:
- Declare relevant dependencies in Maven POM file. One is the dependency on OpenTracing SPring Cloud Starter; In addition, since Istio adopts Zipkin's reporting interface, we also need to introduce Zipkin's related dependencies.
- Declare a Tracer bean in the Spring Application. As shown below, note that we need to set the zpkin reporting address in Istio to OKHttpSernder.
@Bean
    public io.opentracing.Tracer zipkinTracer() {
        String zipkinEndpoint = System.getenv("ZIPKIN_ENDPOINT");
        if (zipkinEndpoint == null || zipkinEndpoint == ""){
            zipkinEndpoint = "http://zipkin.istio-system:9411/api/v2/spans";
        }
        OkHttpSender sender = OkHttpSender.create(zipkinEndpoint);
        Reporter spanReporter = AsyncReporter.create(sender);
        Tracing braveTracing = Tracing.newBuilder()
                .localServiceName("my-service")
                .propagationFactory(B3Propagation.FACTORY)
                .spanReporter(spanReporter)
                .build();
        Tracing braveTracer = Tracing.newBuilder()
                .localServiceName("spring-boot")
                .spanReporter(spanReporter)
                .propagationFactory(B3Propagation.FACTORY)
                .traceId128Bit(true)
                .sampler(Sampler.ALWAYS_SAMPLE)
                .build();
        return BraveTracer.create(braveTracer);
    }
Deploy the program version that uses OpenTracing for HTTP header transmission, and its call tracking information is as follows: 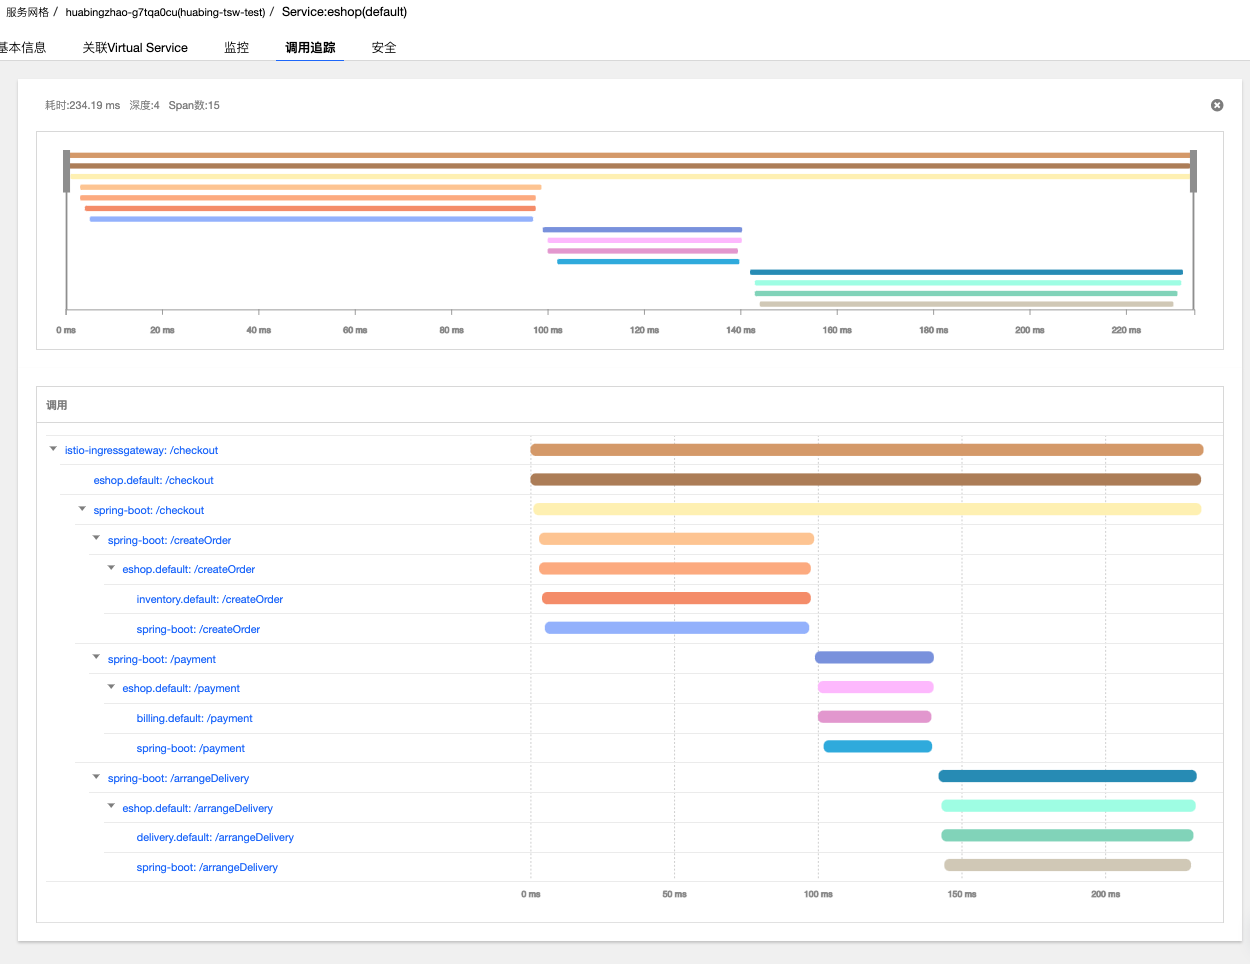 As can be seen from the above figure, compared with the method of directly passing HTTP header in the application code, after using OpenTracing for code embedding, seven spans with spring boot prefix are added to the same call, which are generated by the tracker of OpenTracing. Although we do not show the creation of these spans in the code, the code embedding point of OpenTracing will automatically generate a Span for each REST request and associate it according to the call relationship.
These spans generated by OpenTracing provide us with more detailed distributed call tracking information. From this information, we can analyze the time-consuming situation of each step of an HTTP call from the request initiated by the client application code, to the Envoy through the client, to the Envoy on the server, and finally to the request received by the service terminal. As can be seen from the figure, Envoy forwarding takes about 1 millisecond, which is very short compared with the processing time of business code. For this application, Envoy processing and forwarding basically have no impact on the processing efficiency of business requests.
Add method level call tracking information to Istio call tracking chain
Istio/Envoy provides call chain information across service boundaries. In most cases, service granularity call chain information is sufficient for system performance and fault analysis. However, for some services, more fine-grained call information needs to be used for analysis, such as the time-consuming situation of internal business logic and database access in a REST request. In this case, we need to bury points in the service code and associate the call tracking data reported in the service code with the call tracking data generated by Envoy to uniformly present the call data generated in Envoy and service code.
The code of adding call trace in the method is similar, so we implement it in the way of AOP + Annotation to simplify the code. First, define a tracked annotation and the corresponding AOP implementation logic:
@Retention(RetentionPolicy.RUNTIME)
@Target(ElementType.METHOD)
@Documented
public @interface Traced {
}
@Aspect
@Component
public class TracingAspect {
    @Autowired
    Tracer tracer;
    @Around("@annotation(com.zhaohuabing.demo.instrument.Traced)")
    public Object aroundAdvice(ProceedingJoinPoint jp) throws Throwable {
        String class_name = jp.getTarget().getClass().getName();
        String method_name = jp.getSignature().getName();
        Span span = tracer.buildSpan(class_name + "." + method_name).withTag("class", class_name)
                .withTag("method", method_name).start();
        Object result = jp.proceed();
        span.finish();
        return result;
    }
}
Then add the Traced annotation to the method that needs call tracing:
@Component
public class DBAccess {
    @Traced
    public void save2db() {
        try {
            Thread.sleep((long) (Math.random() * 100));
        } catch (InterruptedException e) {
            e.printStackTrace();
        }
    }
}
@Component
public class BankTransaction {
    @Traced
    public void transfer() {
        try {
            Thread.sleep((long) (Math.random() * 100));
        } catch (InterruptedException e) {
            e.printStackTrace();
        }
    }
}
The master branch of the demo program has been added with method level code tracking, which can be deployed directly.
git checkout master
kubectl apply -f k8s/eshop.yaml
The effect is shown in the figure below. You can see that two method level spans, transfer and save2db, are added to trace. 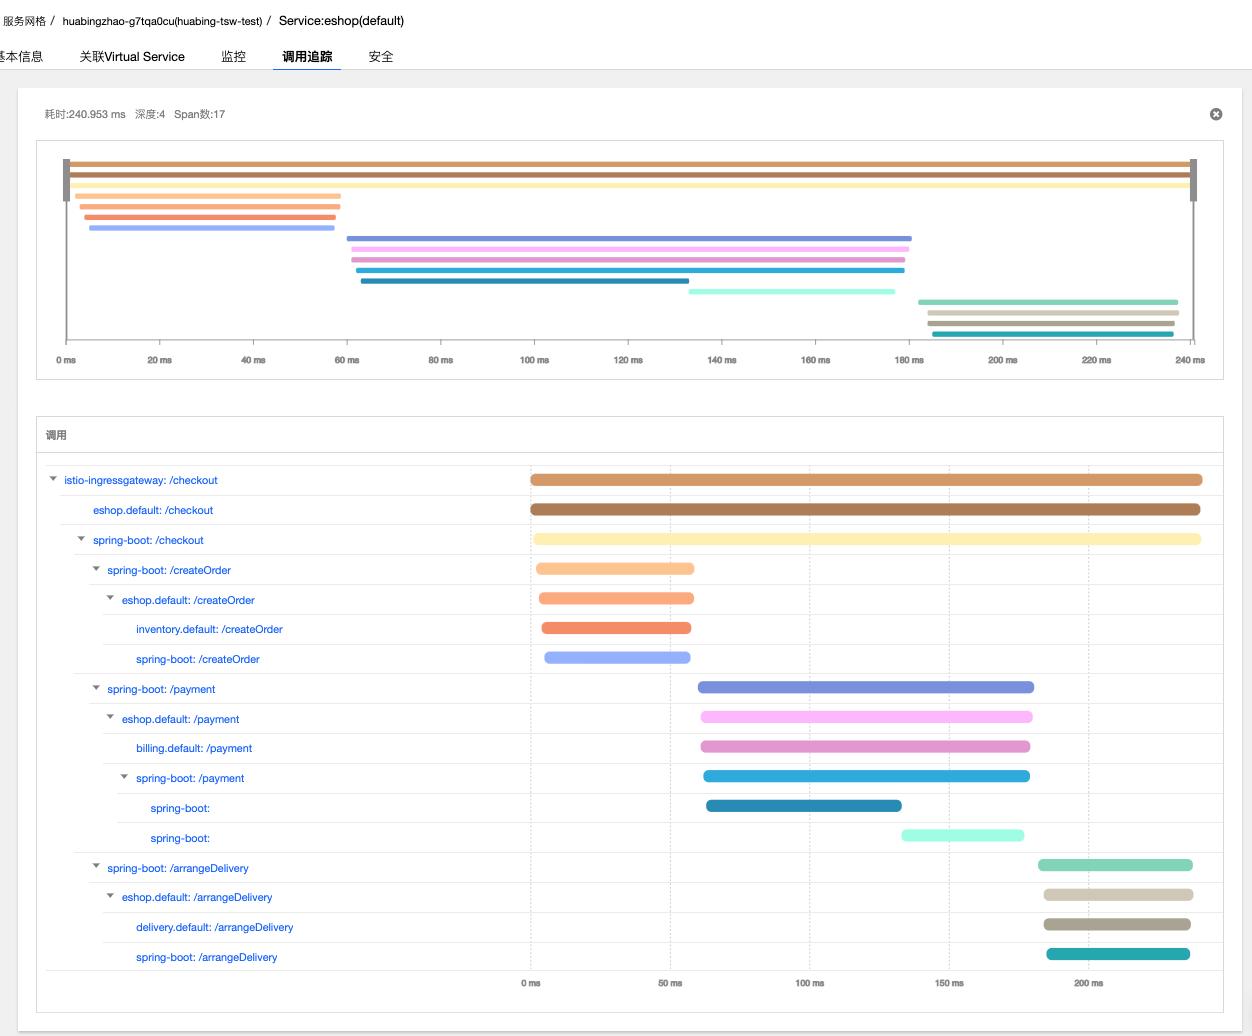 You can open the Span of a method and view the details, including the Java class name and the called method name. In the AOP code, you can also add the exception stack and other information when an exception occurs as needed.
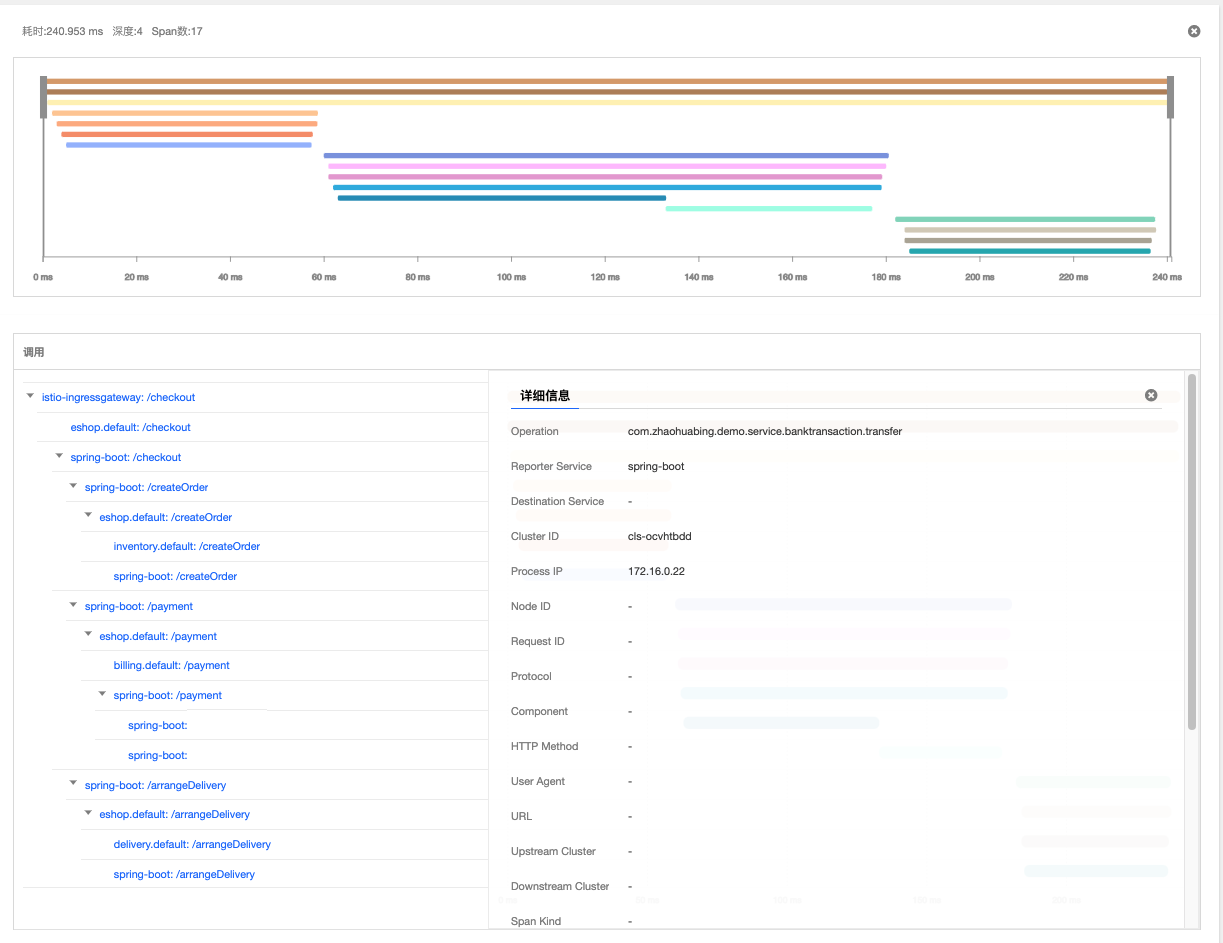
summary
Istio/Envoy provides distributed call tracking function for microservice applications and improves the visibility of service calls. We can use OpenTracing instead of application hard coding to pass the relevant HTTP headers of distributed tracking; You can also add method level call information to the call chain trace information provided by Istio/Envoy by default through OpenTracing to provide more fine-grained call trace information.
next step
In addition to synchronous invocation, asynchronous message is also a common communication mode in microservice architecture. In the next article, I will continue to use the eshop demo program to explore how to integrate Kafka asynchronous messages into Istio's distributed call tracing through OpenTracing.
reference material
- The source code of eshop sample program in this paper
- Opentracing docs
- Opentracing specification
- Opentracing wire protocols
- Istio Trace context propagation
- Zipkin-b3-propagation
- OpenTracing Project Deep Dive
[Tencent cloud native] cloud says new products, Yunyan new technology, cloud tours, new cloud and cloud reward information, scanning code concern about the same official account number, and get more dry cargo in time!! 