Understanding GC Log is not easy, at least for most technicians. After all, for this thing, we need to have an in-depth understanding of the working principle of the Java virtual machine and the memory usage of the application. In this article, we will skip the analysis of the application because it is different from the application of the application and requires knowledge of the code. We will discuss what tools can be used to enable us to read and analyze the garbage collection logs obtained from the JVM in order to correctly locate the problem.
In the actual business scenario, there are different JVM vendors and versions and multiple garbage collector implementations based on different characteristics. Probably, Java 7, 8, 11 or even 15 can be encountered in most environments. Of course, due to various historical reasons, some traditional enterprises may still use Java 6. Each version may run different garbage collectors - serial, parallel, concurrent tag scanning, G1, and even the upcoming ZGC.
So, since GC Log is so important, what "hard cores" can it answer? From the perspective of general type, it mainly involves the following:
1. When to use the younger generation garbage collector?
2. When to use the old garbage collector?
3. How much garbage has been recycled?
4. How long has the garbage collector been running?
5. What is the memory utilization before and after garbage collection?
Now let's look at an example taken from the JVM garbage collector log and analyze each fragment to highlight its key parts. Next, we will show a standard G1 based garbage collection log example, as follows:
[2021-04-26T14:19:14.307+0000][info][gc,heap] Heap region size: 1M
[2021-04-26T14:19:14.317+0000][info][gc     ] Using G1
[2021-04-26T14:19:14.318+0000][info][gc,heap,coops] Heap address: 0x00000007e0000000, size: 512 MB, Compressed Oops mode: Zero based, Oop shift amou
nt: 3
[2021-04-26T14:19:15.011+0000][info][gc,start     ] GC(0) Pause Young (Normal) (G1 Evacuation Pause)
[2021-04-26T14:19:15.011+0000][info][gc,task      ] GC(0) Using 4 workers of 4 for evacuation
[2021-04-26T14:19:15.014+0000][info][gc,phases    ] GC(0)   Pre Evacuate Collection Set: 0.1ms
[2021-04-26T14:19:15.014+0000][info][gc,phases    ] GC(0)   Evacuate Collection Set: 2.3ms
[2021-04-26T14:19:15.014+0000][info][gc,phases    ] GC(0)   Post Evacuate Collection Set: 0.4ms
[2021-04-26T14:19:15.015+0000][info][gc,phases    ] GC(0)   Other: 0.9ms
[2021-04-26T14:19:15.015+0000][info][gc,heap      ] GC(0) Eden regions: 25->0(306)
[2021-04-26T14:19:15.015+0000][info][gc,heap      ] GC(0) Survivor regions: 0->1(4)
[2021-04-26T14:19:15.015+0000][info][gc,heap      ] GC(0) Old regions: 0->0
[2021-04-26T14:19:15.015+0000][info][gc,heap      ] GC(0) Humongous regions: 0->0
[2021-04-26T14:19:15.015+0000][info][gc,metaspace ] GC(0) Metaspace: 5775K->5775K(1056768K)
[2021-04-26T14:19:15.015+0000][info][gc           ] GC(0) Pause Young (Normal) (G1 Evacuation Pause) 25M->0M(512M) 3.965ms
[2021-04-26T14:19:15.015+0000][info][gc,cpu       ] GC(0) User=0.01s Sys=0.00s Real=0.00s
[2021-04-26T14:19:17.216+0000][info][gc,start     ] GC(1) Pause Young (Normal) (G1 Evacuation Pause)
[2021-04-26T14:19:17.216+0000][info][gc,task      ] GC(1) Using 4 workers of 4 for evacuation
[2021-04-26T14:19:17.232+0000][info][gc,phases    ] GC(1)   Pre Evacuate Collection Set: 0.0ms
[2021-04-26T14:19:17.233+0000][info][gc,phases    ] GC(1)   Evacuate Collection Set: 12.7ms
[2021-04-26T14:19:17.233+0000][info][gc,phases    ] GC(1)   Post Evacuate Collection Set: 3.0ms
[2021-04-26T14:19:17.233+0000][info][gc,phases    ] GC(1)   Other: 0.7ms
[2021-04-26T14:19:17.233+0000][info][gc,heap      ] GC(1) Eden regions: 306->0(306)
[2021-04-26T14:19:17.233+0000][info][gc,heap      ] GC(1) Survivor regions: 1->1(39)
[2021-04-26T14:19:17.233+0000][info][gc,heap      ] GC(1) Old regions: 0->0
[2021-04-26T14:19:17.233+0000][info][gc,heap      ] GC(1) Humongous regions: 0->0
[2021-04-26T14:19:17.233+0000][info][gc,metaspace ] GC(1) Metaspace: 5863K->5863K(1056768K)
[2021-04-26T14:19:17.233+0000][info][gc           ] GC(1) Pause Young (Normal) (G1 Evacuation Pause) 306M->0M(512M) 16.875ms
[2021-04-26T14:19:17.233+0000][info][gc,cpu       ] GC(1) User=0.01s Sys=0.00s Real=0.02s
[2021-04-26T14:19:19.855+0000][info][gc,start     ] GC(2) Pause Young (Normal) (G1 Evacuation Pause)
[2021-04-26T14:19:19.859+0000][info][gc,task      ] GC(2) Using 4 workers of 4 for evacuation
[2021-04-26T14:19:19.889+0000][info][gc,phases    ] GC(2)   Pre Evacuate Collection Set: 0.0ms
[2021-04-26T14:19:19.889+0000][info][gc,phases    ] GC(2)   Evacuate Collection Set: 28.1ms
[2021-04-26T14:19:19.889+0000][info][gc,phases    ] GC(2)   Post Evacuate Collection Set: 0.5ms
It is well known that Java garbage collector (GC) logs are used for memory management and object allocation and recycling. GC Log includes many key information, such as the duration of GC process, the number of upgraded objects, etc. in addition, the details of the whole GC process and the resources it uses are displayed one by one. Analysis based on these logs can effectively detect problems and improve the overall performance of JVM applications.
So how does it work?
Unlike the manual processes that developers need to mark and delete objects, the Java garbage collector automatically identifies and clears objects or components that are no longer used by Java programs. Throughout the process of freeing up space, it helps developers save time and be more efficient.
Based on the complex and cumbersome characteristics of application performance adjustment, in its original design concept, Java GC log provides us with a unique method to gain an in-depth understanding of Java based applications. GC logs show object allocation patterns, diagnose disk, CPU, and memory related problems, and enhance the performance of Java based applications.
Why use the Java GC log analysis tool?
Limited visualization of GC logs can lead to time-consuming searches and unrecognized obsolete objects. It can also lead to memory leaks, long GC pauses, slow analysis and monitoring. It can also increase the average resolution time and affect Java based Application performance. In addition, in a distributed environment using multiple frameworks, servers, and applications, manually analyzing Java GC logs for large volumes will become a challenge.
Therefore, the emergence of a centralized log management tool or platform enables IT to automatically perform Java GC log analysis. These tools help IT teams correlate different infrastructure and application logs to provide a perfect logging experience.
Next, the author will briefly summarize some common GC Log analysis tools based on his own experience, which are used to analyze, monitor and manage Java GC logs based on different business environments.
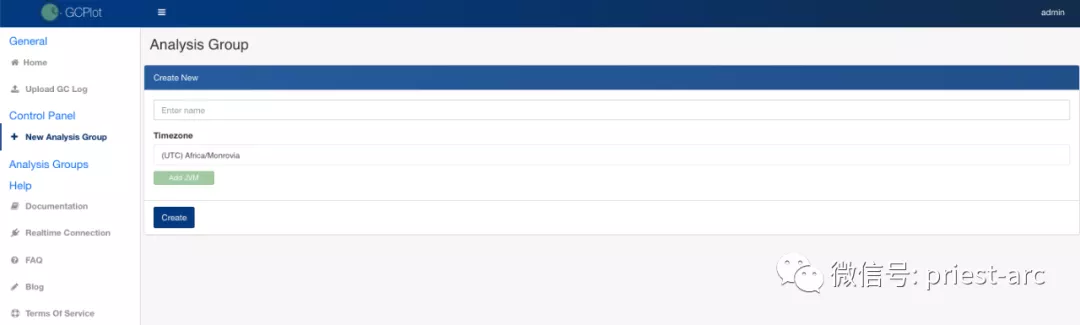
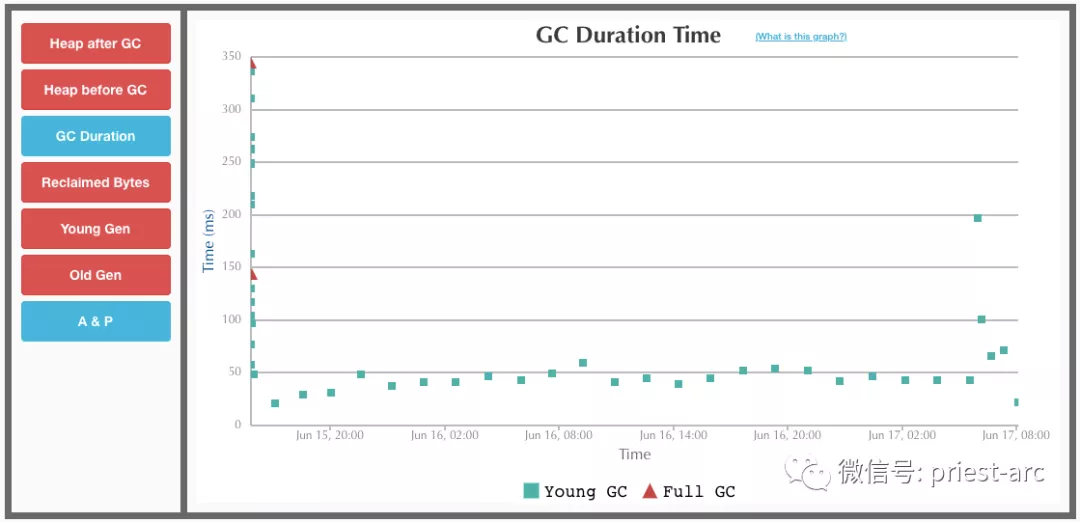
GC PLOT
GCplot is an open source log analysis designed to collect Java GC logs on the fly. It enables log analysis to work with root cause analysis, easy to understand graphics and statistics. The tool uses high-end technologies such as end-to-end SSL encryption and powerful visualization to ensure secure traffic. We can use the database backup, health check and clustering functions of the tool to protect business critical information, and visualize Java GC logs and key information in detailed reports and charts. GCplot can run on the Docker container without external configuration.
[administrator@JavaLangOutOfMemory MyDemo] % docker ps
CONTAINER ID   IMAGE           COMMAND       CREATED       STATUS       PORTS                                              NAMES
b13d6ff910fd   gcplot/gcplot   "/start.sh"   4 hours ago   Up 4 hours   2424/tcp, 2480/tcp, 0.0.0.0:80->80/tcp, 9042/tcp   gcplot_lee
GC Easy
Gc Easy is a logging tool for analyzing Java GC logs. It uses machine learning and automatic detection capabilities to track problems on the Java virtual machine. Using its machine learning algorithm, the IT team can easily detect different organizations, solve memory leakage problems, GC log problems, and save developers' time.
Based on this tool, you can also generate detailed reports with metrics such as key performance indicators and GC statistics to help the team solve GC logging problems. In addition, Gc Easy uses the REST API to quickly monitor and analyze all logs of simple code. Simply enable GC logs, upload all Java GC logs, use the REST API to immediately monitor large-scale logs, and visualize reports to identify areas for improvement.
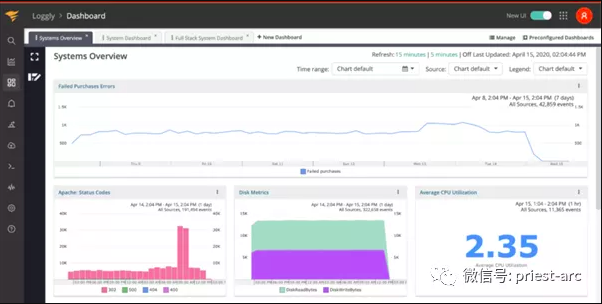
SOLARWINDS Loggly
SolarWinds ® Loggly ® Is a powerful log analysis tool with a unique method of managing and monitoring Java GC logs. With its agentless architecture, the tool collects information quickly without installing proprietary agents. Summarize, centralize and import logs through rsyslog. Developers use these logs to correlate data and resolve GC issues such as memory leaks and premature object allocation.
In addition, this tool can be based on Lucene query syntax automatically detects GC logs from the distributed stack. With its enhanced search and analysis capabilities, the tool can detect and troubleshoot problems faster. In addition, we can use Loggly to archive old GC logs on AWS S3 buckets to meet compliance requirements. In addition, based on its intuitive and customizable dashboard, it can reflect charts, graphs and tables designed to simplify the tracking of GC activities, so that the entire technical team can share the dashboard in their organization.
GC Viewer
GC Viewer Is a free log viewer and analyzer that helps teams detect and visualize Java GC logs generated by the virtual machine. The tool plays an important role in detecting the reasons behind the slowdown of Java applications. To use this tool, developers need to summarize useful GC log files and upload them to GCViewer. The tool displays charts and graphs that contain information about GC events, memory pool size, heap consumption, frequency and duration of GC pauses, memory usage, and so on. To sum up, GC log analysis is one of the best ways to identify problems, fix bottlenecks and run Java based applications seamlessly. In the actual business scenario, based on the tools shared above, we can have a more comprehensive and in-depth understanding of the analysis of GC logs, so as to support us to solve the problems of Java virtual machine.
The above is based on Java GC Log analysis tool. This article ends here. If you have any questions or suggestions, you can leave messages and communicate at any time.