1. Runtime data area
1. General
-
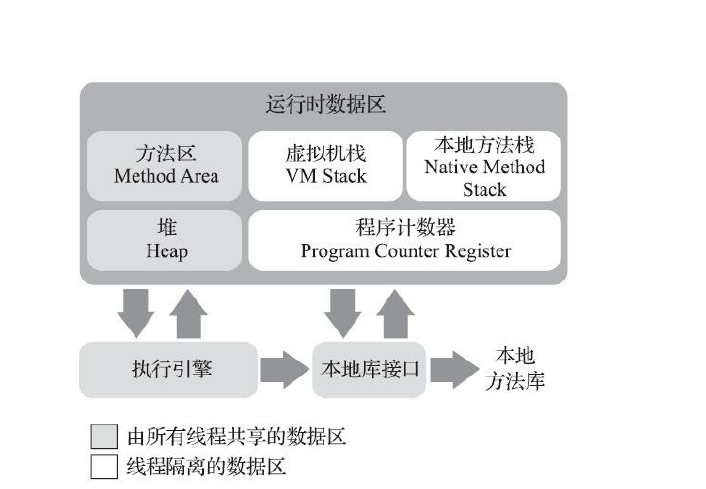
In the process of executing Java programs, Java virtual machine will divide the memory it manages into several
Different data areas. -
These areas have their own purposes and the time of creation and destruction,
-
Some areas always exist with the start of the virtual machine process, while others are established and destroyed depending on the start and end of the user thread.
2. Program counter
-
Program Counter Register is a small memory space, which can be regarded as the program executed by the current thread
Line number indicator for bytecode. -
Bytecode interpreter works by changing this counter
To select the next bytecode instruction to be executed. It is an indicator of program control flow, such as branch, loop, jump and exception
Management, thread recovery and other basic functions need to rely on this counter to complete. -
'thread private: because the multithreading of Java virtual machine is realized by switching threads in turn and allocating processor execution time, at any given time, a processor (a kernel for a multi-core processor) will only execute the instructions in one thread. Therefore, in order to recover to the correct execution position after thread switching, each thread needs to have an independent program counter. The counters between threads do not affect each other and are stored independently. We call this kind of memory area "thread private"
There is no memory available. -
If the thread is executing a Java method, this counter records the location of the virtual machine bytecode instruction being executed
Address; If you are executing a Native method, this counter value should be empty (Undefined)
3.Java virtual machine stack
1. Definitions
Like the program counter, the Java virtual machine stack is also thread private, and its life cycle is the same as that of the thread
2. Thread memory model of Java method execution
- When each method is executed, the Java virtual machine will synchronously create a Stack Frame [1] (Stack Frame) to store local variable table, operand stack, dynamic connection, method exit and other information.
- Each method is called until it is executed, which corresponds to the process of a stack frame from entering the stack to leaving the stack in the virtual machine stack.
3. Local variable table
- The local variable table stores various basic data types of Java virtual machine known during compilation (boolean, byte, char, short, int, float, long, double) Object reference (reference type, which is not equivalent to the object itself. It may be a reference pointer to the starting address of the object, or a handle representing the object or other locations related to the object) and returnAddress type (pointing to the address of a byte instruction).
- The storage space of these data types in the local variable table is represented by the local variable Slot, where the 64 bit length of long and
The data of double type will occupy two variable slots, and the other data types only occupy one. - The memory space required by the local variable table is allocated during compilation. When entering a method, this method needs to allocate more memory space in the stack frame
The large local variable space is completely determined, and the size of the local variable table will not be changed during the operation of the method. The "size" here refers to the number of variable slots and how much memory space the virtual machine really uses (for example, one variable slot occupies 32 bits, 64 bits, or more) to implement a variable slot, which is completely determined by the specific virtual machine implementation.
4. Two types of abnormalities
- If the stack depth requested by the thread is greater than the depth allowed by the virtual machine, a StackOverflowError exception will be thrown
- If the stack capacity of Java virtual machine can be expanded dynamically, when the stack is expanded
If enough memory cannot be requested during exhibition, an OutOfMemoryError exception will be thrown.
4. Local method stack
- The role of native method stacks is very similar to that of virtual machine stacks. The only difference is the virtual machine
The stack executes Java method (i.e. bytecode) services for the virtual machine, while the local method stack is Native for the virtual machine - Like the virtual machine stack, the local method stack will throw StackOverflowError and OutOfMemoryError exceptions respectively when the stack depth overflows or the stack expansion fails.
5. Java heap
-
Java Heap is the memory managed by the virtual machine
The largest piece in the. -
The Java heap is a memory area shared by all threads and is created when the virtual machine starts.
-
The only purpose of this memory area is to store object instances, Java
Almost all object instances in the world allocate memory here. -
The Java heap is an area of memory managed by the garbage collector
-
Reclaim memory angle
Because most modern garbage collectors are based on
It is designed according to the generation collection theory, so "new generation", "old age", "permanent generation", "Eden space" and "From Survivor" spaces often appear in the Java heap
"To Survivor space" and other nouns, -
Memory allocation angle:
The Java heap shared by all threads can be divided into multiple threads
Thread Local Allocation Buffer (TLAB) is a thread private allocation buffer to enhance the efficiency of object allocation
Efficiency.
-
-
No matter from any angle or division, the commonness of the stored contents in the Java heap will not be changed. No matter which area, only instances of objects can be stored. The purpose of subdividing the Java heap is to better reclaim memory or allocate memory faster.
6. Method area
1. Definitions
The method area is a memory area shared by each thread. It is used to store type information, constants, static variables, code cache compiled by the instant compiler and other data that have been loaded by the virtual machine.
2. Throw an exception
If the method area cannot meet the new memory allocation requirements, an OutOfM emoryError exception will be thrown.
7. Runtime constant pool
- The Runtime Constant Pool is part of the method area.
- Constant Pool Table is used to store various literal quantities and symbol references generated during compilation. This part will be stored in the runtime constant pool of the method area after the class is loaded.
- Another important feature of runtime constant pool relative to Class file constant pool is that it is dynamic. Java language does not require constants
It must be generated only at the compile time, that is, the contents of the constant pool not preset in the Class file can enter the method area for operation
During operation, new constants can also be put into the pool. This feature is used more by developers, which is the String class
intern() method. - An OutOfM emoryError exception is thrown when the constant pool can no longer apply to memory
8. Direct memory
- Direct memory is not a part of the runtime data area of the virtual machine, nor is it in the Java virtual machine specification
Defined memory area. - This part of memory is also used frequently, and may also lead to
OutOfM emoryError exception occurred - In JDK 1.4, NIO (New Input/Output) class is added, and a method based on Channel and buffer is introduced
(Buffer), which can directly allocate out of heap memory using the Native function library, and then operate through a DirectByteBuffer object stored in the Java heap as a reference to this memory.
2. HotSpot virtual machine object exploration
1. Object creation
1. Language level
At the language level, creating objects (exceptions: copy, deserialization) is usually just a new keyword
2. Virtual machine level
1. Create steps
- When the Java virtual machine encounters a bytecode new instruction, it will first check whether the parameters of the instruction can be located in the constant pool
A symbolic reference to a class, and check whether the class represented by this symbolic reference has been loaded, parsed and initialized. If not, then
The corresponding class loading process must be performed first - After the class load check passes, the virtual machine will allocate memory for the new object. The amount of memory required by the object is after the class is loaded
After that, it can be completely determined (how to determine it will be described in section 2.3.2), and the task of allocating space to objects is actually equivalent to determining a block
Memory blocks of size are divided from the Java heap. - After the memory allocation is completed, the virtual machine must initialize the allocated memory space (but excluding the object header) to zero. If TLAB is used, this work can also be carried out in advance at the time of TLAB allocation.
- So far, from the perspective of virtual machine, a new object has been produced
Yes. However, from the perspective of Java programs, object creation has just begun - constructors, that is, in Class files
() method has not been executed, all fields are default zero values, and other resources and state information required by the object have not been constructed according to the predetermined intention. Generally speaking (depending on whether the invokespecial instruction is followed by the new instruction in the bytecode stream, the Java compiler will generate these two bytecode instructions at the same time where the new keyword is encountered, but not necessarily if they are generated directly by other methods). After the new instruction, the () method will be executed to initialize the object according to the programmer's wishes, Such a truly usable object is fully constructed.
2. Distribution method
1. Pointer collision
Assuming that the memory in the Java heap is absolutely regular, all used memory is placed on one side, the free memory is placed on the other side, and a pointer is placed in the middle as the indicator of the dividing point, the allocated memory is only to move the pointer to the free space for a distance equal to the size of the object. This allocation method is called "pointer collision"
2. Free list
If the memory in the Java heap is not regular, and the used memory and free memory are staggered with each other, then
There is no simple pointer collision, and the virtual machine must maintain a list and remember
Record which memory blocks are available. When allocating, find a large enough space in the list, allocate it to the object instance, and update the records on the list. This allocation method is called "free list"
3. Service conditions
- Which allocation method to choose is determined by whether the Java heap is regular or not
- Whether the Java heap is regular or not depends on whether the garbage collector adopted has the ability of space compression.
- When using Serial, ParNew and other collectors with compression process, the allocation algorithm adopted by the system is pointer collision, which is simple and efficient;
- When CMS is used as a collector based on the Sweep algorithm, theoretically [1] can only allocate memory using a more complex free list
4. Considerations
- Problem: object creation is A very frequent behavior in the virtual machine. Even if only modifying the position pointed to by A pointer is not thread safe in the case of concurrency. It may occur that object A is allocating memory, the pointer has not been modified, and object B uses the original pointer to allocate memory at the same time.
- Solution:
- Synchronize the action of allocating memory space - in fact, the virtual machine adopts CAS with failure retry to ensure the atomicity of update operation;
- The other is to allocate memory in different spaces according to threads, that is, each thread pre allocates a small piece of memory in the Java heap, which is called thread local allocation buffer (TLAB). Which thread needs to allocate memory is allocated in the local buffer of which thread, and only the local buffer is used up, Synchronous locking is required only when a new cache is allocated
3.HotSpot interpreter code snippet
// Ensure that interpreted classes are stored in the constant pool
if (!constants->tag_at(index).is_unresolved_klass()) {
// Assertions ensure that they are klassOop and instanceKlassOop (described in the next section of this section)
oop entry = (klassOop) *constants->obj_at_addr(index);
assert(entry->is_klass(), "Should be resolved klass");
klassOop k_entry = (klassOop) entry;
assert(k_entry->klass_part()->oop_is_instance(), "Should be
instanceKlass");
instanceKlass* ik = (instanceKlass*) k_entry->klass_part();
// Ensure that the type of object has passed the initialization phase
if ( ik->is_initialized() && ik->can_be_fastpath_allocated()
) {
// Take object length
size_t obj_size = ik->size_helper();
oop result = NULL;
// Record whether all fields of the object need to be set to zero
bool need_zero = !ZeroTLAB;
// Allocate objects in TLAB
if (UseTLAB) {
result = (oop) THREAD->tlab().allocate(obj_size);
}
if (result == NULL) {
need_zero = true;
// Assign objects directly in eden
retry:
HeapWord* compare_to = *Universe::heap()->top_addr();
HeapWord* new_top = compare_to + obj_size;
// cmpxchg is the CAS instruction in x86. Here is a C + + method, which is divided by CAS
 Space allocation, concurrency failure
 If so, go to retry Retry until the assignment is successful
if (new_top <= *Universe::heap()->end_addr()) {
if (Atomic::cmpxchg_ptr(new_top, Universe::heap()-
>top_addr(), compare_to) != compare_to) {
goto retry;
}
result = (oop) compare_to;
}
}
if (result != NULL) {
// If necessary, initialize the object with a zero value
if (need_zero ) {
HeapWord* to_zero = (HeapWord*) result + sizeof(oopDesc) /
oopSize;
obj_size -= sizeof(oopDesc) / oopSize;
if (obj_size > 0 ) {
memset(to_zero, 0, obj_size * HeapWordSize);
}
}
// Set the object header information according to whether the bias lock is enabled
if (UseBiasedLocking) {
result->set_mark(ik->prototype_header());
} else {
result->set_mark(markOopDesc::prototype());
}
result->set_klass_gap(0);
result->set_klass(k_entry);
// Put the object reference on the stack and continue to execute the next instruction
SET_STACK_OBJECT(result, 0);
UPDATE_PC_AND_TOS_AND_CONTINUE(3, 1);
}
}
}
2. Memory layout of objects
1. Classification
- Object Header
- Instance Data
- Align Padding‘
2. Object header
- Class I: used to store the runtime data of the object itself, such as ha
HashCode, GC generation age, lock status flag, lock held by thread, biased thread ID, biased timestamp, etc
The length of sub data is 32 bits and 64 bits in 32-bit and 64 bit virtual machines (compression pointer is not turned on), which are officially called
Mark Word - Another part of the object header is the type pointer, that is, the pointer of the object to its type metadata, which is used by the Java virtual machine
To determine which class the object is an instance of. Not all virtual machine implementations must retain type pointers on object data, in other words
That is to say, finding the metadata information of an object does not necessarily go through the object itself
3. Instance data
Object really stores valid information
4. Object filling
It only serves as a placeholder. Because the automatic memory management system of HotSpot virtual machine requires that the starting address of the object must be
An integer multiple of 8 bytes, in other words, the size of any object must be an integer multiple of 8 bytes. The object header has been carefully designed to be exactly a multiple of 8 bytes (1 or 2 times). Therefore, if the object instance data part is not aligned, it needs to be filled by alignment filling.
5. Storage layout of 32-bit virtual machine M ark Word:
// Bit-format of an object header (most significant first,
big endian layout below):
//
// 32 bits:
// --------
// hash:25 ------------>| age:4 biased_lock:1 lock:2 (normal
object)
// JavaThread*:23 epoch:2 age:4 biased_lock:1 lock:2 (biased
object)
// size:32 ------------------------------------------>| (CMS
free block)
// PromotedObject*:29 ---------->| promo_bits:3 ----->| (CMS
promoted object)
3. Access location
1. Access method
Java programs will manipulate specific objects on the heap through the reference data on the stack.
2. Mainstream access
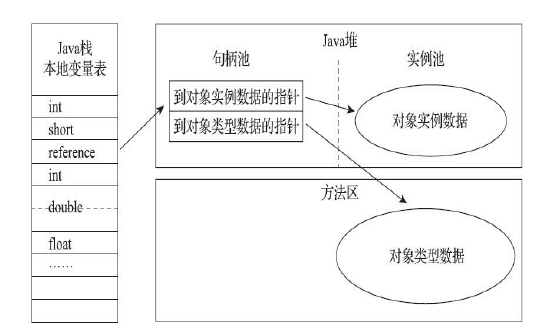
1. Handle access
If handle access is used, a piece of memory may be divided in the Java heap as a handle pool. The reference stores the handle address of the object, and the handle contains the specific address information of the object instance data and type data
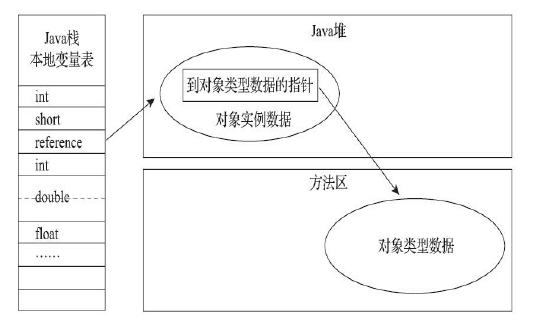
2. Direct access
If direct pointer access is used, the memory layout of the objects in the Java heap must consider how to place the related data of the access type
Information. The direct address stored in reference is the object address. If you only access the object itself, you don't need another indirect access
3. Advantages and disadvantages
- The biggest advantage of using a handle to access is that the reference stores a stable handle address. When the object is moved (moving the object during garbage collection is a very common behavior), it will only change the instance data pointer in the handle, and the reference itself does not need to be modified.
- The biggest advantage of using direct pointer to access is faster, which saves one pointer setting
Bit time overhead. Because object access is very frequent in Java, this kind of overhead adds up to a lot, which is also an extremely considerable execution cost
3.OutOfMemoryError exception
1. Heap overflow
definition
As the number of objects increases, a memory overflow exception will occur when the total capacity reaches the maximum heap capacity limit
Test code
The - XX: + heapdumponoutof memorierror parameter allows the virtual machine to Dump the current memory heap Dump snapshot in case of memory overflow exception for post analysis
/**
* VM Args: -Xms20m -Xmx20m -XX:+HeapDumpOnOutOfMemoryError
* @author zzm
*/
public class HeapOOM {
static class OOMObject {
}
public static void main(String[] args) {
List<OOMObject> list = new ArrayList<OOMObject>();
while (true) {
list.add(new OOMObject());
}
}
}

//Operation results:
java.lang.OutOfMemoryError: Java heap space
Dumping heap to java_pid3404.hprof ...
Heap dump file created [22045981 bytes in 0.663 secs]
Treatment method
Analyze the heap Dump snapshot from Dump through the memory image analysis tool (such as Eclipse Memory Analyzer).
- It is necessary to confirm whether the object causing OOM in memory is necessary, that is, to distinguish whether there is a memory leak or a memory overflow.
-
- If it is a memory leak, you can further view the reference chain from the leak object to GC Roots through the tool to find out how the leak object is passed
What reference paths and GC Roots are associated with, so that the garbage collector cannot recycle them. According to the type information of the leaked object
As well as its information to the GC Roots reference chain, you can generally accurately locate the location where these objects are created, and then find out the internal information generated
The specific location of the leaked code. - If it is not a memory leak, in other words, all objects in memory must survive, you should check the heap parameter (- Xmx and - Xms) settings of the Java virtual machine and compare them with the memory of the machine to see if there is room for upward adjustment. Then check from the code
Are there some objects with long life cycle, long holding state time and storage structure design
Unreasonable and other situations, and minimize program operation
Memory consumption of row period.
- If it is a memory leak, you can further view the reference chain from the leak object to GC Roots through the tool to find out how the leak object is passed
2. Virtual machine stack and local method stack overflow
set up
Since the virtual machine stack and local method stack are not distinguished in the HotSpot virtual machine, for HotSpot, the - Xoss parameter (set)
Although the local method stack size) exists, it actually has no effect. The stack capacity can only be set by the - Xss parameter
Throw exception
- If the stack depth requested by the thread is greater than the maximum depth allowed by the virtual machine, a StackOverflowError exception will be thrown.
- If the stack memory of the virtual machine allows dynamic expansion, it will be thrown when the extended stack capacity cannot apply for enough memory
OutOfMemoryError exception.
Test code
/** VM Args:-Xss128k */public class JavaVMStackSOF {

    private int stackLength = 1;

    public void stackLeak(){
        stackLength++;
        stackLeak();
    }

    public static void main(String[] args) {
        JavaVMStackSOF oom = new JavaVMStackSOF();
        try{
            oom.stackLeak();
        }catch(Throwable e){
            e.printStackTrace();
            System.out.println("stack length:" + oom.stackLength);
        }


    }

}

//Operation results:
java.lang.StackOverflowError

at aaa.JavaVMStackSOF.stackLeak(JavaVMStackSOF.java:9)

stack length:9430
3. Method area and runtime constant overflow
set up
-
Runtime constant overflow: limit the size of the persistent generation by - XX: PermSize and - XX: M axPermSize, which can indirectly limit the capacity of the constant pool
-
Method area overflow: the main responsibility of the method area is to store
Information about the type, such as class name, access modifier, constant pool, field description, method description, etc. For the testing of this part of the area, the basic idea is to generate a large number of classes at runtime to fill the method area until it overflows.
Test code
/**
* VM Args: -XX:PermSize=6M -XX:MaxPermSize=6M
* @author zzm
*/
public class RuntimeConstantPoolOOM {
public static void main(String[] args) {
// Use Set to maintain constant pool reference and avoid Full GC reclaiming constant pool
Set<String> set = new HashSet<String>();
// In the short range, it is enough for 6MB PermSize to generate OOM
short i = 0;
while (true) {
set.add(String.valueOf(i++).intern());
}
}
}

//Operation results:
Exception in thread "main" java.lang.OutOfMemoryError:
PermGen space
at java.lang.String.intern(Native Method)
at
org.fenixsoft.oom.RuntimeConstantPoolOOM.main(RuntimeConstant
PoolOOM.java: 18)
Defensive measures
·-XX: M axM etaspaceSize: Set the maximum value of meta space. The default value is-1,That is, unlimited
 System, or only limited to local memory
 size.
·-XX: M etaspaceSize: Specifies the initial space size of the meta space, in bytes
 Bit, which triggers garbage collection
 Unload the type, and the collector will adjust the value: if a large number of empty
 Reduce the value appropriately; If released
 A little space, then no more than-XX: M axM etaspaceSize(If set
 If so), appropriately improve the
 Value.
·-XX: M inM etaspaceFreeRatio: The function is to control the minimum after garbage collection
 Percentage of the remaining capacity of the meta space, which can be
 Reduce the frequency of garbage collection due to insufficient meta space. Similarly, there are-XX: M ax-M
etaspaceFreeRatio,Used to control the most
 Percentage of large meta space remaining.
4. Local direct memory overflow
set up
The capacity of direct memory can be specified by the - XX: M axDirectMemorySize parameter. If it is not specified, it defaults to the maximum value of Java heap (specified by - Xmx)
Test code
/**
* VM Args: -Xmx20M -XX:MaxDirectMemorySize=10M
* @author zzm
*/
public class DirectMemoryOOM {
private static final int _1MB = 1024 * 1024;
public static void main(String[] args) throws Exception {
Field unsafeField = Unsafe.class.getDeclaredFields()[0];
unsafeField.setAccessible(true);
Unsafe unsafe = (Unsafe) unsafeField.get(null);
while (true) {
unsafe.allocateMemory(_1MB);
}
}
}
Operation results:
Exception in thread "main" java.lang.OutOfMemoryError
at sun.misc.Unsafe.allocateMemory(Native Method)
at org.fenixsoft.oom.DMOOM.main(DMOOM.java:20)
Obvious features
- You will not see any obvious exceptions in the Heap Dump file
situation - If it is found that the Dump file generated after memory overflow is very small, and directm memory is used directly or indirectly in the program (the typical indirect use is NIO), you can consider checking the reasons for direct memory.