Recently, we were looking for an out-of-heap memory leak problem. Through - XX: MaxDirectMemory Size, we still couldn't control the increase of out-of-heap memory until the machine's physical memory was full and oom killer.
Last article Settings for MaxDirectMemorySize MaxDirectMemorySize restricts the memory application of DirectByteBuffer, but it is only calculated by reservedMemory and total Capacity in java.nio.Bits class. The real application for out-of-heap memory space is sun.misc.Unsafe class. That is to say, users can leak memory in other ways.
Here we encountered a memory leak problem caused by a handle leak.

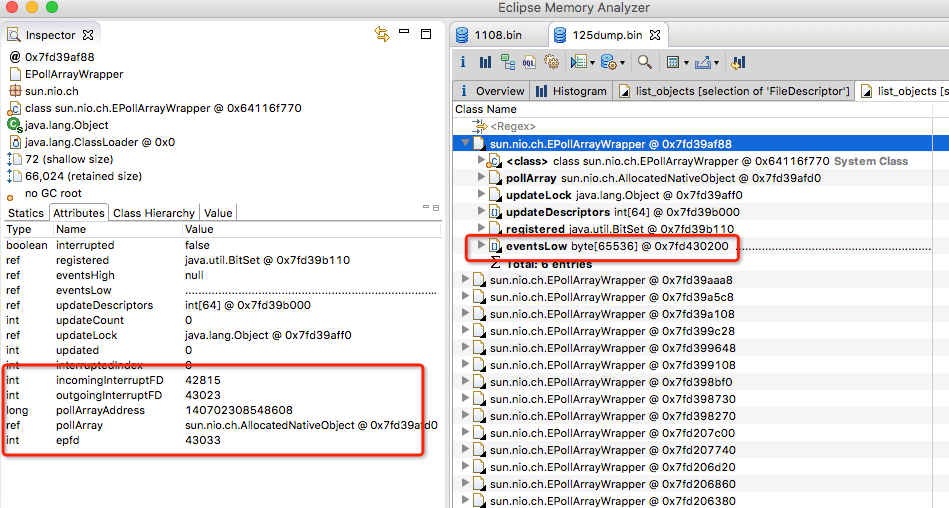
View dump files through mat.
A large number of EPollArray Wrapper objects are generated due to handle leaks.
How much memory does this object occupy? Let's look at the constructor:
...Omit a lot of code

static final int SIZE_EPOLLEVENT  = sizeofEPollEvent();
static final int NUM_EPOLLEVENTS  = Math.min(fdLimit(), 8192);

private static native int sizeofEPollEvent();
private static native int fdLimit();

EPollArrayWrapper() {
        // creates the epoll file descriptor
        epfd = epollCreate();

        // the epoll_event array passed to epoll_wait
        int allocationSize = NUM_EPOLLEVENTS * SIZE_EPOLLEVENT;
        pollArray = new AllocatedNativeObject(allocationSize, true);
        pollArrayAddress = pollArray.address();

        for (int i=0; i<NUM_EPOLLEVENTS; i++) {
            putEventOps(i, 0);
            putData(i, 0L);
        }

        // create idle set
        idleSet = new HashSet<SelChImpl>();
}
...
class NativeObject {
  ...
  protected NativeObject(int var1, boolean var2) {
        if(!var2) {
            this.allocationAddress = unsafe.allocateMemory((long)var1);
            this.address = this.allocationAddress;
        } else {
            int var3 = pageSize();
            long var4 = unsafe.allocateMemory((long)(var1 + var3));
            this.allocationAddress = var4;
            this.address = var4 + (long)var3 - (var4 & (long)(var3 - 1));
        }
  }
  ...
}
EPoll Array Wrapper created a NativeObject when it was newly built.
NativeObject applies for out-of-heap memory through unsafe.allocateMemory.
Where allocationSize = NUM_EPOLLEVENTS * SIZE_EPOLLEVENT
- NUM_EPOLLEVENTS
Min (maximum number of handles, 8192), generally the number of server handles are set relatively large, here choose 8192 - SIZE_EPOLLEVENT
native function, look at its structure
epoll_data: union max, 64-bit shaping, 8 bytestypedef union epoll_data { void *ptr; int fd; __uint32_t u32; __uint64_t u64; } epoll_data_t;//Save data related to a file descriptor that triggers an event struct epoll_event { __uint32_t events; /* epoll event */ epoll_data_t data; /* User data variable */ };
epoll_event: 4 bytes (32-bit shaping) +4 bytes (completion) +8 bytes = 16 bytes
16*8192 = 128k
As you can see, an Epoll Selector takes up about 128k of out-of-heap memory, and when the handle leaks, out-of-heap memory rises with the handle.
summary
When encountering memory leak, the first thing to do is to determine whether the leak is in the heap or out of the heap. The most direct way is to set Xmx to check whether the physical memory occupancy exceeds the peak value of JVM. If the total amount of memory keeps at the peak value and does not decrease after full GC, it can be guessed that the leak is in the heap, and the object can be analyzed by dump file.
If the total amount of memory exceeds Xmx, you can set - XX:MaxDirectMemorySize to see if the total amount of memory is equal to in-heap + MaxDirectMemorySize. If you can limit the increase of memory through MaxDirectMemorySize, you can guess that the use of DirectByteBuffer caused by unreasonable recycling. If it can't be limited, then it's possible to use Unsafe, and you need to see if third-party tools or middleware are used improperly.