JIT just in time compiler
JIT (Just In Time) Just In Time compiler
- server compiler and layered compilation should be used for all applications
- As long as the code cache is large enough, the compiler can provide perfect performance
Code cache
Generally, you only need to set the maximum value of the code cache: - XX: reservedcodachesize. The JVM will automatically set the initial size of the code cache (- XX:InitialCodeCacheSize). The size of the cache will be automatically adjusted in the background.
java -jar -XX:ReservedCodeCacheSize=240m yeti-apiapp-1.0.jar
Compilation threshold
The default value of client compiler is 1500, and the default value of server compiler is 10000. Changing CompileThreshold will make the compiler compile ahead of time or later, so it must be set according to requirements.
java -jar -XX:CompileThreshold=10000 yeti-apiapp-1.0.jar
Detect compilation process
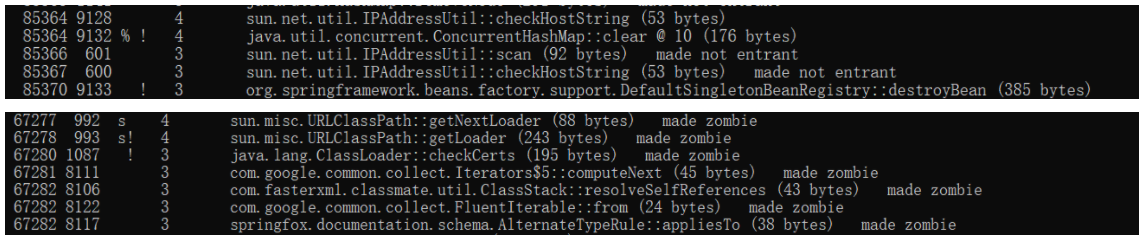
Turn on PrintCompilation. Each time a method or loop is compiled, the JVM will print a line of compiled content information
java -jar -XX:+PrintCompilation yeti-apiapp-1.0.jar
jstat -compiler 5040
jstat -printcompilation 5040 1000
Compilation thread
java -jar -XX:CICompilerCount=4 yeti-apiapp-1.0.jar
Getting started with garbage collection
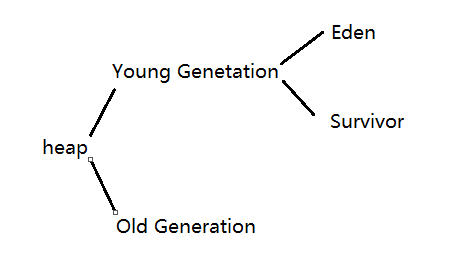
**Principle of Minor GC: * * when the new generation is full, the garbage collector will pause all application threads and recycle the Young Generation space. Objects that are no longer used will be recycled, and objects still in use will be moved to Survivor or old generator. This operation is called Minor GC.
Serial GC
Clinet virtual machine, Serial uses a single thread to clean up the contents of the heap. When performing Minor GC and Full GC, all application threads will be suspended.
Enable: - XX:+UseSerialGC, which is enabled by default.
Shutdown: shutdown can be achieved by specifying another garbage collector.
Throughput GC
The default collector of Server virtual machine. Throughput uses multithreading to clean up the heap content. When performing Minor GC and Full GC, all application threads will be suspended.
During Full GC, the space of the older generation will be compressed and sorted.
On: on by default, - XX:+UseParallelGC, - XX:+UseParallelOldGC
CMS GC
In the Minor GC stage, pause the application thread, use multithreading for recycling, and use a new algorithm (- XX:+UseParNewGC).
For the recycling of Old Generation, multiple threads are used to scan the Old Generation space regularly to recycle the unused space in time.
The total duration of application thread pauses is much shorter than Throughput.
Disadvantages:
- Use more CPU.
- Failure to do compression and defragmentation results in heap fragmentation, and excessive fragmentation degenerates into Serial collector behavior.
G1 GC
It is suitable for super large piles and reduce stop the world.
G1 divides the heap into several regions.
The G1 collector implements partial compression and sorting of the heap, which is less prone to Full GC than CMS.
On:
java -jar -Xms6144m -Xmx6144m -XX:+UseG1GC yeti-apiapp-1.0.jar
java -jar -XX:+UseG1GC yeti-apiapp-1.0.jar
Resize heap
- The JVM tries to estimate the minimum and maximum heap based on the running machine.
- Try not to resize the heap unless you need a heap larger than the default.
- If you determine how large a heap your application needs, you can set the initial value and maximum value of the heap to the same size (- Xms1024m -Xmx1024m). This method does not need to estimate whether the heap needs to be resized, so it can slightly improve the GC operation efficiency.
java -jar -Xms1024m -Xmx1024m yeti-apiapp-1.0.jar
Resize generation space
All the signs of adjusting the generation space are to adjust the Young Generation space, and the rest is the Old Generation space.
Set the space occupation ratio of the new generation, which is 2 by default. After calculation, the space size of the new generation is 33% of the initial heap size%
-XX:NewRatio=N
Initial Young Gen Size = Initial Heap Size / (1 + NewRatio)
Set initial size of Cenozoic space-XX:NewSize=N
Set the maximum size of Cenozoic space-XX:MaxNewSize=N
Set initial and maximum size shortcuts-Xmn100m
If the size of the heap is determined, you can specify the maximum and minimum values of the generation space. Otherwise, you'd better use - XX:NewRatio to adjust according to the ratio.
Resize meta space
When the JVM loads a class, the metadata of the class will be saved to the Metaspace.
-XX:MetaspaceSize=N-XX:MaxMetaspaceSize=N
Adjust the number of concurrent threads
-XX:ParallelGCTheads=N
Enable GC log function
Explicit output
java -jar -XX:+PrintGCDetails yeti-apiapp-1.0.jar
Output in log form
java -jar -XX:+PrintGCTimeStamps yeti-apiapp-1.0.jarjava -jar -XX:+PrintGCDateStamps yeti-apiapp-1.0.jar
Output GC detailed log to / usr/log mode
java -jar -Xloggc:/usr/log -XX:+PrintGCTimeStamps -XX:+UseGCLogFileRotation -XX:NumberOfGCLogFiles=10 -XX:GCLogFileSize=1024 yeti-apiapp-1.0.jar
Get GC data by script
jstat -gcutil 13668 1000
Garbage collection algorithm
Understanding the Throughput garbage collector
Understanding CMS garbage collector
Understanding G1 garbage collector
Heap memory best practices
View heap histogram
jcmd 13668 GC.class_histogram
Native memory best practices
Native memory trace
Native Memory Tracking
From Java 8, you can view the original memory usage
-20: Nativememorytracking = off | summary | detail summary = summary mode detail = detail mode
Get native memory information through jcmd command jcmd process_id VM.native_memory sumary
java -XX:NativeMemoryTracking=summary -jar yeti-apiapp-1.0.jarjcmd 16768 VM.native_memory summary
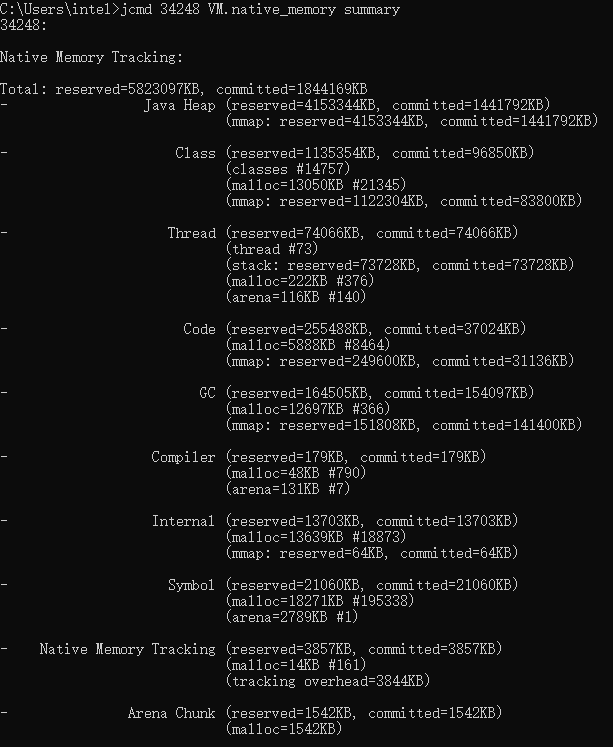
Class - save class metadata
Thread - 66 threads, each with about 1M space
Code - code cache for JIT
Native Memory Tracking - NMT itself consumes some memory
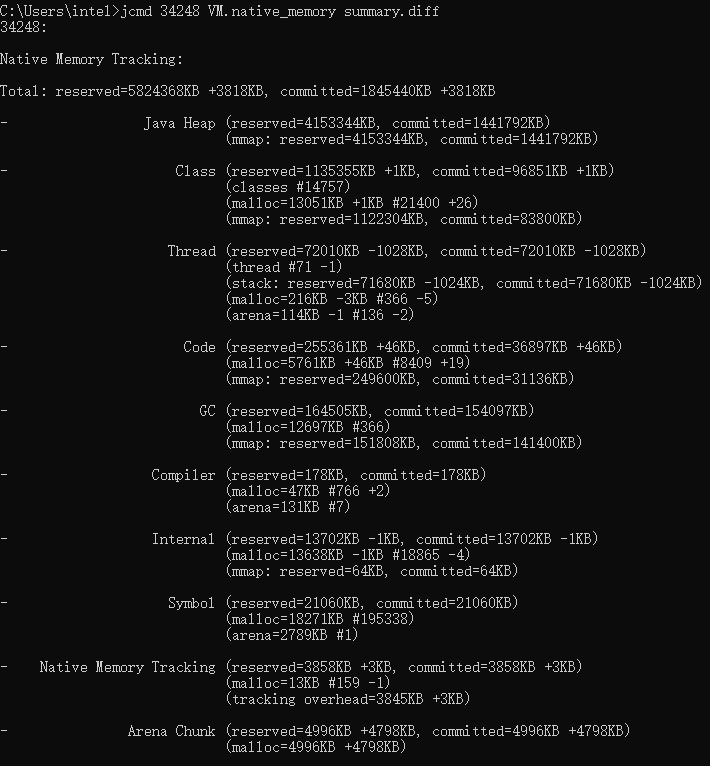
Use of baseline
jcmd 16768 VM.native_memory baselinejcmd 16768 VM.native_memory summary.diff
Thread and synchronization performance
For thread performance, there is not much to tune. There are very few JVM flags that can be set, and the role of these flags is also very small. For example, thread stack size adjustment, bias lock setting, spin lock mode configuration and thread priority adjustment are completely unnecessary. Even after adjustment, they have a great impact on the operation of the program.
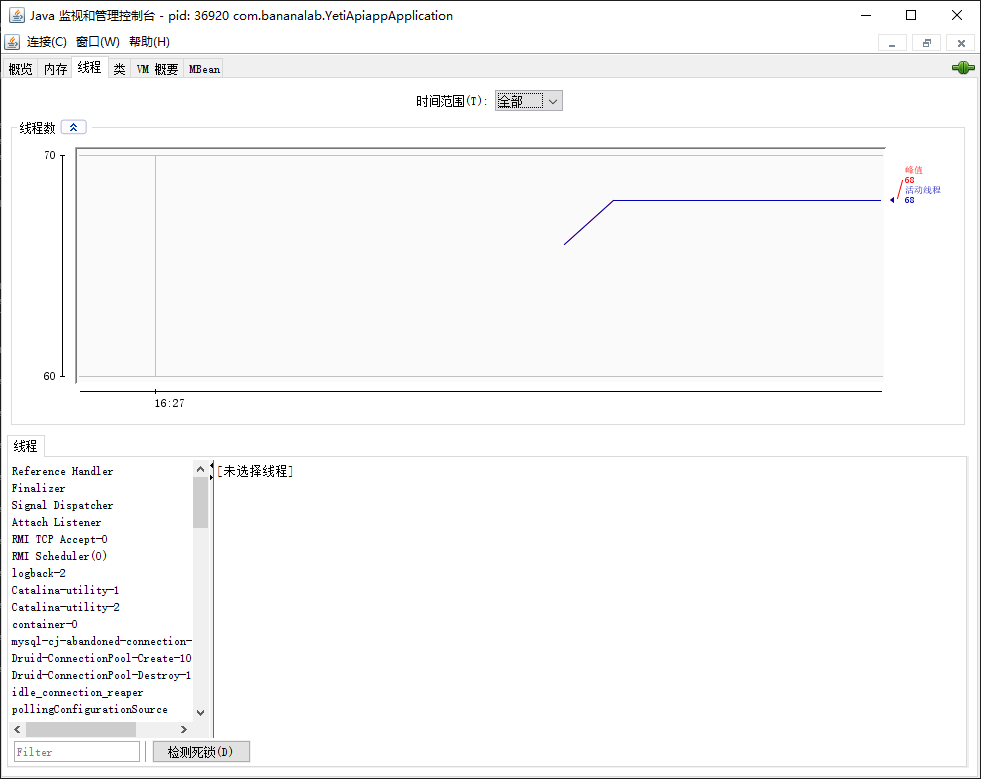
View Thread
jconsole 15784
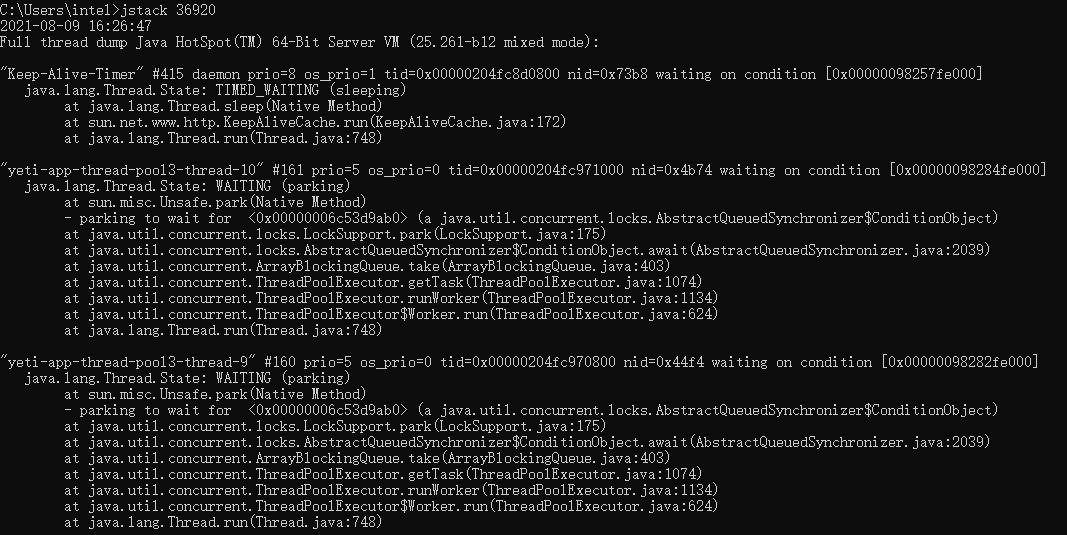
View blocked threads
jstack 15784
.