Brief introduction to Canvas

Canvas Is a new tag provided by HTML5.
<canvas id="canvas" width="400" height="300"></canvas>
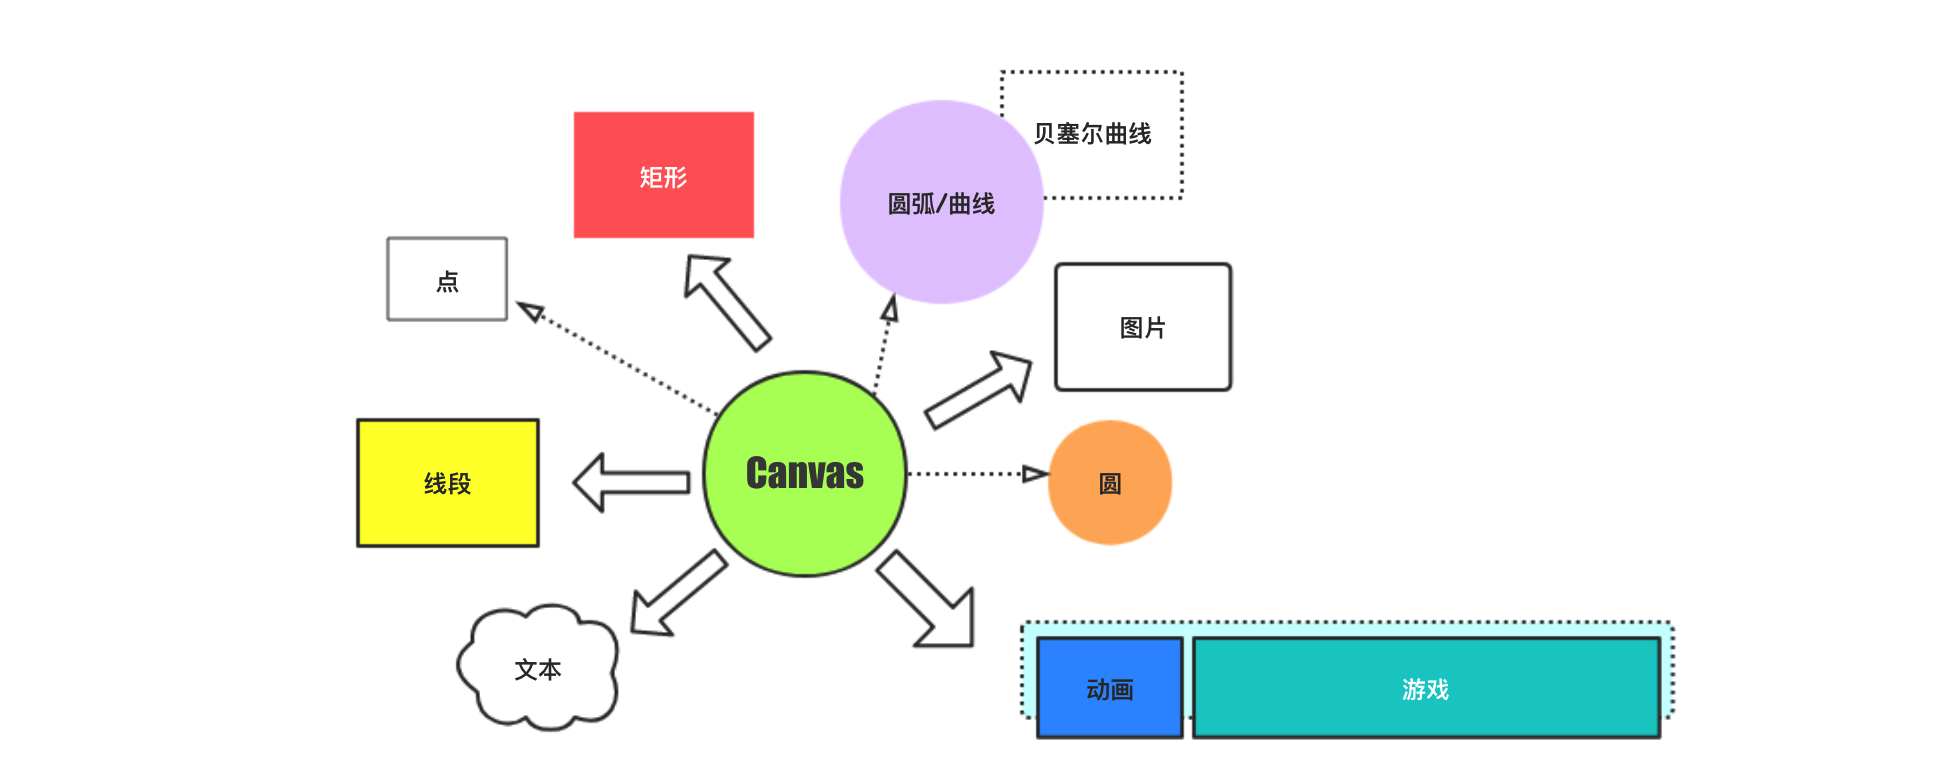
Canvas It is a rectangular canvas. On the canvas, we can control each pixel through javaScript to draw graphics.
Canvas Tags use javaScript to draw images on Web pages, which itself does not have drawing function. By using canvas and calling related API s, you can draw paths, rectangles, circles, characters and images in a variety of ways.
The first extension [Canvas] () was introduced into the WebKit kernel by the 'Apple' company for the 'Mac OSX' Dashboard, and later implemented in Safari and Google Chrome. [Canvas] () tag is the content of 'WhatWG Web applications 1.0 specification', which is also included in HTML5.
Application fields and trends
① Cool scene show: realize dynamic advertising effect with Canvas, and can run cross platform harmoniously.
② Data visualization: various statistical charts (trend chart, pie chart, line chart, etc.) have a mature open source framework.
③ In the field of game development: Canvas is the first choice for HTML5 game development. It is more three-dimensional and exquisite than Flash in terms of Web-based images.
[1] Web graphics editor: Photoshop graphics editor will be able to be 100% web-based.
[2] Remote visual control: Canvas can better realize Web-based data transmission to gous visual control interface.
[3] Various types of simulators: in terms of visual effects and core functions, simulators can be completely implemented by JavaScript.
reference material W3school , MDN_Canvas_API
HTML Canvas 2D Context
Canvas By default, the label has a width of 300 * 150, which can be viewed by setting the border.
Canvas The label supports the operation of right mouse button · (copy picture) · and (save picture as), which is consistent with the picture.

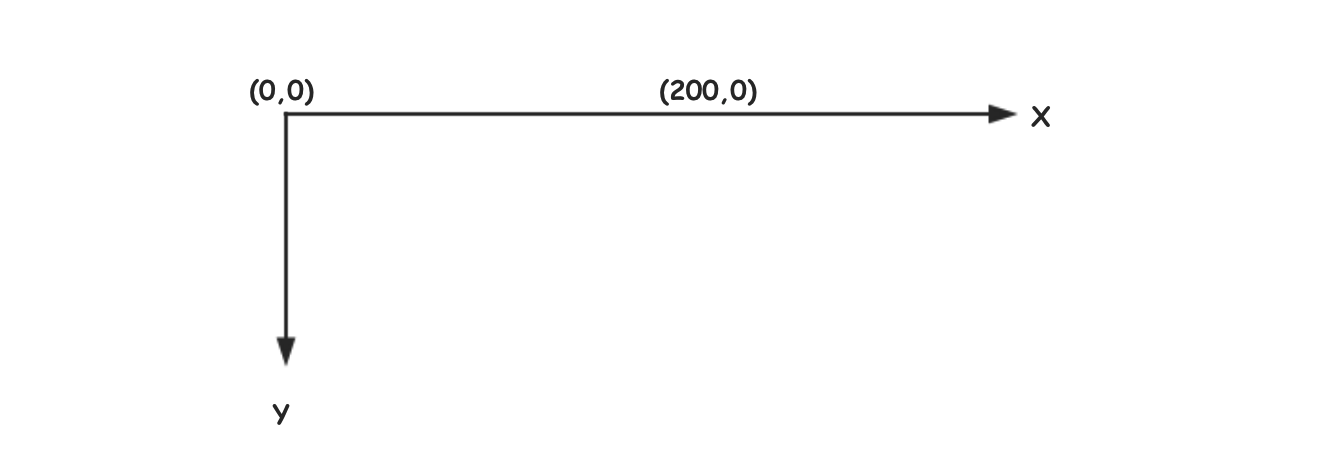
Canvas The reference coordinate system of the label is shown in the figure above, and the direction of its Y axis is different from the common mathematical coordinate system.
Canvas The browser compatibility of the tag is very good (IE9 +). If the browser is not compatible, it is recommended to set a friendly prompt for the tag content.
Canvas The label itself can't draw graphics, it's just a Canvas. The specific drawing work is mainly completed by the Canvas context object.
Canvas Label context object is the interface for javaScript to operate Canvas. The common type is CanvasRenderingContext2D.
Canvas When setting the canvas width and height of the label, it is recommended to implement it directly through the width and height attribute nodes in the label.
<canvas id="canvas" width="400px" height="300px">The current browser does not support canvas,Please upgrade your browser</canvas>
<script>
    //01 get canvas
    var canvas = document.getElementById("canvas");
    //02 get canvas context object
    var ctx = canvas.getContext("2d");
    //03 setting path
    //Open path (can be omitted)
    ctx.beginPath();
    //Sets the start point of the path
    ctx.moveTo(20,50);
    //Set path corresponding value
    ctx.lineTo(100,50);
    //Set line (stroke) color
    ctx.strokeStyle = "red";
    //04 draw line (stroke)
    ctx.stroke();
</script>
Code description the code above will draw a red line on the canvas.
Note: please do not use 'CSS' to control the width and height of the [Canvas] () label, which will cause the internal picture to stretch and deform. If you reset the width and height attribute of the [Canvas] () label, all existing contents in the Canvas will be erased.
Basic use of Canvas

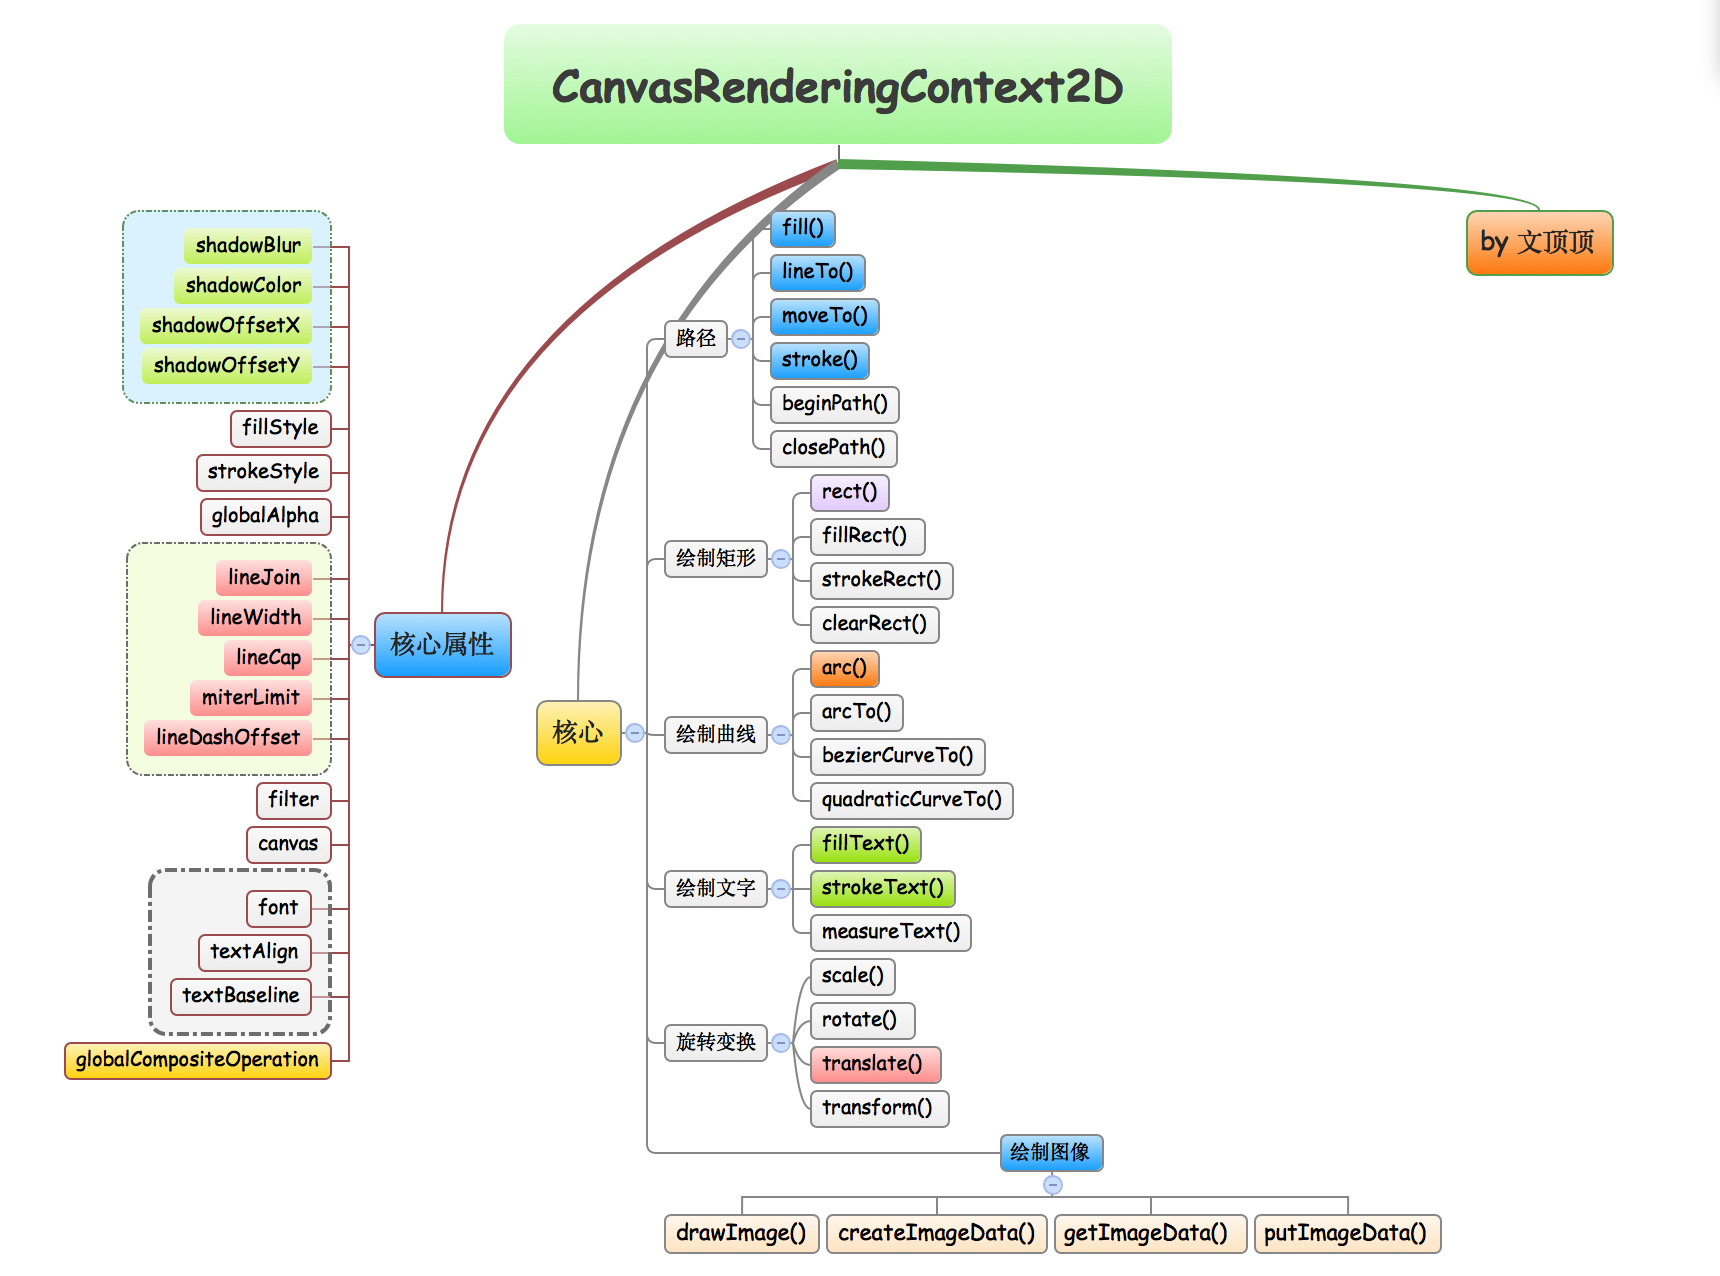
Almost all the core members of the canvas renderingcontext2d prototype object are listed here for reference.
    canvas                      //Current canvas object
    filter                      //Set filtering effects such as blur and grayscale
    globalAlpha                 //Set transparency (0 ~ 1)
    shadowBlur                  //The blur level of the shadow
    shadowColor                 //The color of the shadow
    shadowOffsetX               //The horizontal distance of the shadow from the shape
    shadowOffsetY               //The vertical distance of the shadow from the shape
    fillStyle                   //Sets the style (color) of the rectangular fill
    strokeStyle                 //Set stroke style
    lineCap                     //Type of line end round but (default) square
    lineJoin                    //Inflection point type of intersection line round miter (default) bevel
    lineWidth                   //Sets the width of the line
    miterLimit                  //Maximum miter length (the distance between the inner and outer corners of the intersection of two lines)
    lineDashOffset              //Set dashed line offset
    font                        //Set font drawing parameters (font size, font, bold, etc.)
    textAlign                   //Sets the horizontal alignment of text
    textBaseline                //Set text baseline (vertical alignment)
    globalCompositeOperation    //Sets how to draw a source (New) image onto a target (old) image
    imageSmoothingEnabled       //Set whether the picture is smooth (unstable)
    imageSmoothingQuality       //Set the attribute of image smoothness (unstable)

    moveTo()                    //Set path (starting point)
    lineTo()                    //set up path
    beginPath()                 //Open path
    closePath()                 //Close path
    setLineDash()               //Set dashed line width data
    getLineDash()               //Gets the collection of dashed line widths

    rect()                      //draw rectangle
    fillRect()                  //Rectangle fill
    strokeRect()                //Set stroke (rectangle)
    clearRect()                 //Erase rectangular area content

    stroke()                    //Set stroke
    fill()                      //Set fill
    clip()                      //Cuts an area of the specified shape and size
    arc()                       //Draw an arc (circle)
    arcTo()                     //draw a curve
    ellipse()                   //Add elliptical path (unstable)
    bezierCurveTo()             //Draw Bezier curve (3)
    quadraticCurveTo()          //Draw Bezier curve (2)
    isPointInPath()             //Checks whether a point is in the specified path
    isPointInStroke()           //Check whether a point is within the specified (range)
    createLinearGradient()      //Create a linear gradient
    createRadialGradient()      //Creates a radial / circular gradient

    fillText()                  //Rectangle fill (draw text)
    strokeText()                //Set stroke (text drawing)
    measureText()               //Gets and calculates the text width

    drawImage()                 //Draw picture
    createImageData()           //Create a new ImageData object
    getImageData()              //Get ImageData object (pixel data of rectangular area)
    putImageData()              //Place the image on the canvas from the specified ImageData object
    createPattern()             //Repeats the specified element in the specified direction
    drawFocusIfNeeded()         //Draw the focus if necessary

    save()                      //Save status
    scale()                     //Set zoom
    rotate()                    //Set rotation
    restore()                   //Returns previously saved path States and properties
    translate()                 //Pan (remap (0,0) position on canvas)
    transform()                 //Replace the current conversion matrix of the drawing
    setTransform()              //Reset the current transformation to the identity matrix, and then run transform()
    resetTransform()            //Resets the current deformation (unstable) using the identity matrix
The canvas context CanvasRenderingContext2D object provides rich interfaces for drawing graphics. We can directly call relevant API s to draw paths, arcs, rectangles and other patterns. In addition, there are many ways to get the target pattern. There is not only one way to Rome, but all complex patterns are inseparable from points, lines and surfaces, and they should be gradual.
Here, first provide a 400 * 300 canvas in the page to obtain the context object of the canvas.
<canvas id="canvas" width="400px" height="200px"></canvas>
var ctx = document.getElementById("canvas").getContext("2d");
Drawing of rectangular and circular points
ctx.fillRect(10,10,5,5); //Rectangular point
ctx.arc(11.5,40,3,0,2 * Math.PI);   //Circular point
ctx.fill();                         //Set fill
Drawing of lines
    //Method (1) draw lines by drawing continuous rectangles
    //Example: (solid line)
    for(var i = 0 ; i < 80 ; i++)
    {
        ctx.fillRect(40 + (i * 1),25,1,1);
    }

    //Example: (dotted line)
    for(var i = 0 ; i < 20 ; i++)
    {
        ctx.fillRect(40 + (i * 4),40,2,2);
    }

    /*********************************************/

    //Mode (2) draw lines by path
    //Example: (chroma diluted line)
    ctx.moveTo(40,60);
    ctx.lineTo(320,60);

    //Example: (lines with normal chromaticity)
    ctx.moveTo(40,70.5);
    ctx.lineTo(320,70.5);

    //Set stroke
    ctx.stroke();
Drawing of faces (rectangles)
    //Method (1) draw a rectangle in the way of "rectangular point" + cycle
    for(var i = 0 ; i < 40 ; i++)
    {
        ctx.fillRect(20 + (i * 3),100,3,50);
    }

    //Method (2) draw rectangle directly
    ctx.fillStyle = "red";
    ctx.fillRect(200,100,50,50);
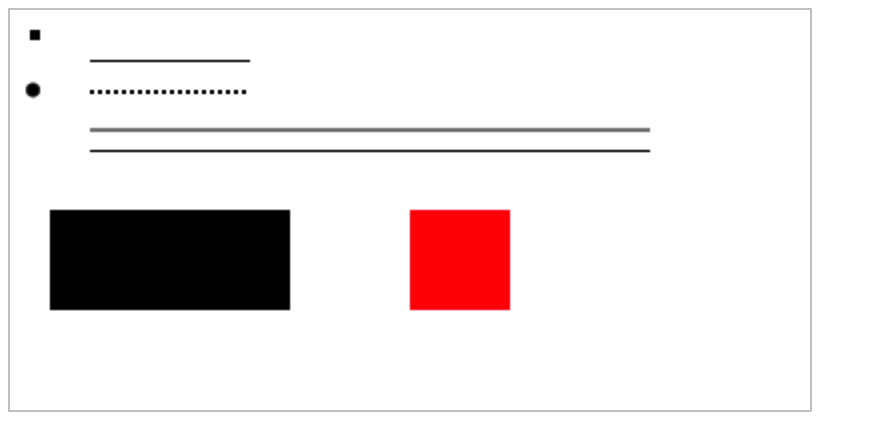
The result diagram of the above code running is posted here.

Note: when drawing lines in canvas context, we will find that the final color of the lines does not look black, which feels lighter. In addition, the width of the lines does not look '1px' but '2px'. In fact, the main reason is that when canvas is drawing, the aligned point is the center of the line, so the line will be divided into two 0.5px up and down, which will be supplemented when displaying, so its chromaticity is naturally unsaturated. When drawing, you can consider setting an offset of '0.5px' for the drawing coordinates.