
OpenTelemetry (also known as OTel) is an open source observable capability framework, which is composed of a series of tools, API s and SDK s, enabling IT teams to detect, generate, collect and export remote monitoring data for analysis and understanding software performance and behavior.
Popular ones include Zipkin from Spring Cloud, CAT from comments, skywalking from Huawei, Jaeger from Uber and Pinpoint from naver. So far, the opentelemetry project has been supported by many well-known middleware such as Zipkin, Jaeger, skywalking, Prometheus and so on.
The promise of OpenTelemetry is that it can help you avoid vendor lock-in, allowing you to test your application once and then send the data to any backend you choose. This article shows you how to do this using code samples that configure your application to send telemetry data to Honeycomb and New Relic.
What is supplier lock-in?
As application architectures become more and more complex, the tools we use to manage and maintain them also need to be developed. Traditional monitoring solutions detect your application externally, which is very suitable to remind you of problems, but where do you start? In large complex systems, these tools cannot provide enough context to actually track and solve problems.
Application tools are the backbone of APM tools. To provide richer diagnostic data than traditional monitoring tools, application maintainers add vendor specific agents or libraries to their projects. Although each vendor provides some preconfigured baselines, maintainers still need to manually add their own tools to ensure that the insights reported to the vendor dashboard are relevant to their specific use cases. The tool will be added to the vendor's specific terminology so that it cannot be transferred to other implementations. The result is that you save up front time at the beginning, but if you decide to change the tool supplier, these time will inevitably be recovered in the order of accumulated interest.
What happens when another vendor offers some compelling differentiation or killer features that need to be investigated? That's when the pain begins.
You must first remove all old tools from the code base, and then reuse the tools with a whole new set of code and dependencies. If the new tool turns out to be unqualified? Then it's time to roll back everything and start over.
Organizations are trapped using the tools they happen to encounter first! After completing the readjustment and the pit that may lose historical data, you are more likely to give up and learn to accept the status quo.
This is the trap of supplier locking.
OpenTelemetry unlock vendor lock
If you've ever found that the tools you use don't work for you, but the cost of implementing (or even evaluating) alternatives is too high to consider switching, you'll understand why vendor lock-in is unacceptable. OpenTelemetry aims to break this problem by providing a standardized instrument framework.
Out of a common frustration with the state of proprietary telemetry transactions, the standard began to appear in the form of two parallel open source projects: OpenCensus and OpenTracing. Finally, the community merged the two standards into the OpenTelemetry project. Although it is still a relatively new project, OpenTelemetry (or OTel) is growing rapidly and has recently been accepted as CNCF incubation project.
OpenTelemetry provides an open standard for generating, collecting, and exporting application telemetry data across any number of back-end systems. It is an open source and vendor neutral testing framework that frees you from the pitfalls of using proprietary libraries to understand how your code behaves. Now, you only need to test your application once, and then take the test to any other back-end system of your choice.
Suppliers should compete for your favor based on how they please you and solve your problems, not based on how difficult it is to get rid of them. With OTel, this is finally possible.
Let's take a look at switching vendors using OTel in practice.
How to switch vendors using OpenTelemetry
We will start with a simple node JS express application starts. We have only one route, and we get a to-do to keep things interesting.
// app.js
const express = require("express");
const https = require("https");
const app = express();
app.get("/", async(req, res) = >{
    https.get("https://jsonplaceholder.typicode.com/todos/1", (incoming) = >{
        incoming.on("data", (data) = >{
            console.log(JSON.parse(data))
        });
        incoming.on("end", () = >{
            res.send("OK")
        });
    });
});
app.listen(3000, () = >{
    console.log(`Listening
    for requests on http: //localhost:3000`);
});
Now let's sprinkle some OTel on it. We'll add some dependencies and introduce a tracking.sdk for initializing the OTel SDK JS file.
"dependencies": {
    "@grpc/grpc-js": "1.3.7",
    "@opentelemetry/api": "1.0.3",
    "@opentelemetry/auto-instrumentations-node": "0.25.0",
    "@opentelemetry/exporter-collector-grpc": "0.25.0",
    "@opentelemetry/sdk-node": "0.25.0",
    "express": "~4.16.1"
}``````js
// tracing.js
const opentelemetry = require('@opentelemetry/sdk-node');
const {
    getNodeAutoInstrumentations
} = require('@opentelemetry/auto-instrumentations-node');
const {
    CollectorTraceExporter
} = require("@opentelemetry/exporter-collector-grpc");
const {
    credentials
} = require("@grpc/grpc-js");
const traceExporter = new CollectorTraceExporter({
    credentials: credentials.createSsl(),
});
let sdk = new opentelemetry.NodeSDK({
    traceExporter,
    instrumentations: [getNodeAutoInstrumentations()]
});
sdk.start()
We will configure the rest of the OTel pipeline through the environment variable. First, let's point it at Honeycomb.
export OTEL_EXPORTER_OTLP_ENDPOINT="https://api.honeycomb.io"
export OTEL_EXPORTER_OTLP_HEADERS="x-honeycomb-team=MY_HNY_KEY,x-honeycomb-dataset=otel-node"
export OTEL_SERVICE_NAME="express-backend"
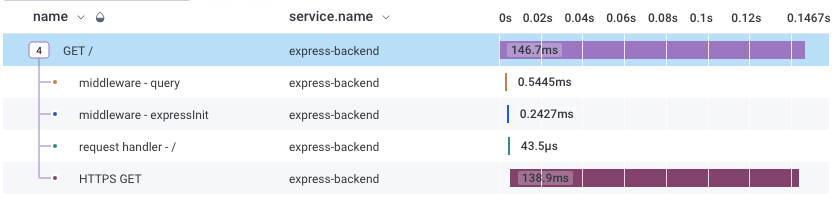
Now, when we run our tracking application and click on our endpoint, we will see some tracking data in the Honeycomb UI.
node -r tracing.js app.js
Of course, it's more than that. We want to know what to-do items we have obtained. Let's add a span with todo title as attribute.
// app.js
const otel = require("@opentelemetry/api");
let tracer = otel.trace.getTracer("my-tracer");
app.get("/", async(req, res) = >{
    https.get("https://jsonplaceholder.typicode.com/todos/1", (incoming) = >{
        let span = tracer.startSpan("reading-todo");
        incoming.on("data", (data) = >{
            span.setAttribute("title", JSON.parse(data).title)
        });
        incoming.on("end", () = >{
            span.end();
            res.send("OK")
        });
    });
});
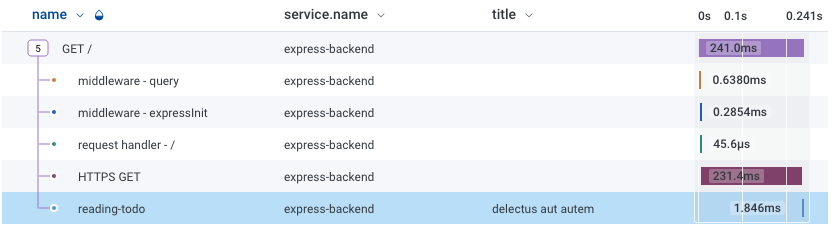
Oh, hey, there's another span in our tracking, which shows the title of the to-do list!
Now, suppose you want to send data to a place other than Honeycomb. Simple - just replace your endpoint and header. Let's take New Relic as an example.
export OTEL_EXPORTER_OTLP_ENDPOINT="https://otlp.nr-data.net:4317/"
export OTEL_EXPORTER_OTLP_HEADERS="api-key=MY_NR_KEY"
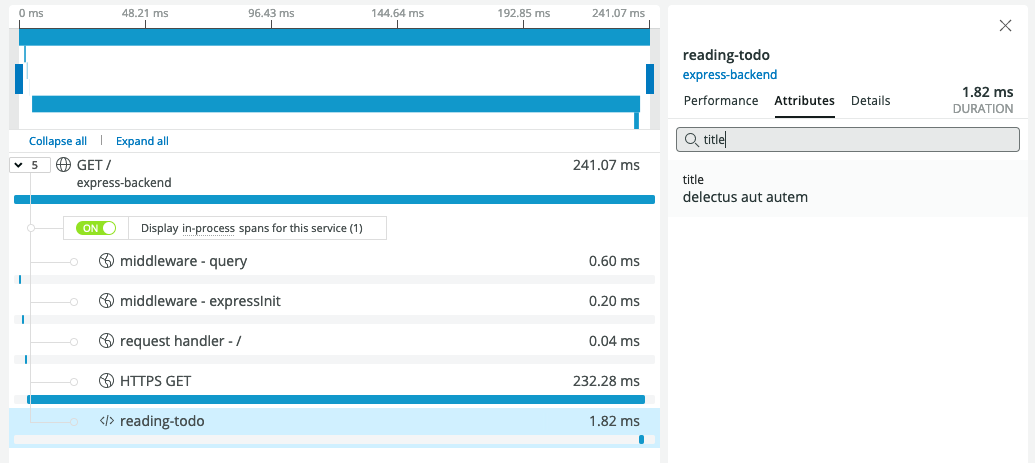
Now, after re running the application and clicking on the endpoint, we can see the trace in New Relic, including the very useful to-do title.
But what if you're not fully ready for conversion and want to buy your data from multiple vendors? OpenTelemetry Collector Is an OTel component that allows you to ingest, process, and export telemetry data by configuring the data pipeline. It is not a required component, but in this case, we can use it to send the trace to Honeycomb and New Relic. We first run the collector locally in the Docker container.
docker run -p 4317:4317 -v /collector-config.yaml:/etc/collector-config.yaml otel/opentelemetry-collector —config=/etc/collector-config.yaml
This is the collector config that we exported to two vendors Yaml file.
receivers:
otlp:
protocols:
grpc:
exporters:
otlp/hny:
endpoint: api-dogfood.honeycomb.io:443
headers:
"x-honeycomb-team": "MY_HNY_KEY"
"x-honeycomb-dataset": "otel-node"
otlp/nr:
endpoint: otlp.nr-data.net:4317
headers:
"api-key": "MY_NR_KEY"
service:
pipelines:
traces:
receivers: [otlp]
exporters: [otlp/hny,otlp/nr]
Because now our node JS application will send data to the collector on the local host, so we need to update our gRPC credentials to make it unsafe.
// tracing.js
const traceExporter = new CollectorTraceExporter({
    credentials: credentials.createInsecure(),
});
Finally, we swap the endpoints for collector addresses.
export OTEL_EXPORTER_OTLP_ENDPOINT=localhost:4317
Now, after we run the application and click our endpoint, the trace appears in Honeycomb and New Relic.
Get rid of the cycle of supplier lock-in
The example in this blog is a trivial example, but think of dozens or hundreds of microservice endpoints and code paths that may not know your tracking backend at all. With OpenTelemetry, you don't need to hard code vendor specific logic into your application.
When you choose more telemetry providers, you can choose more telemetry providers.
Can be in OpenTelemetry official website Learn more about the project at.
Translated from
Original text: https://thenewstack.io/opentelemetry-otel-is-key-to-avoiding-vendor-lock-in/
follow
This article starts with WeChat official account. We will pay attention to the left side code, learn more about consultation, and have more free resources for you to learn.