catalogue
Evolution of permanent generation
Method area and permanent generation / meta space
Trigger conditions for Minor GC and Full GC
Common configuration parameters of JVM heap
Reference articles
Java GC type and trigger timing_ u011833033 blog - CSDN blog_ gc trigger timing
jvm (VI) common parameters of jvm optimization _jwang blog CSDN blog _commontuning parameters of jvm
Three JVM s
1.Sun HotSpot
We study and use the HotSpot virtual machine of Sun company, which can be seen in the java version through cmd
java -version
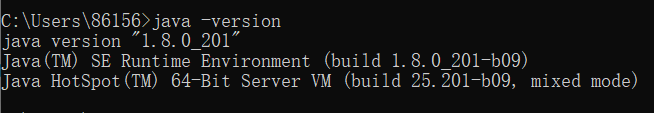
Java HotSpot(TM) 64-Bit Server VM (build 25.201-b09, mixed mode)
2.BEA JRockit
3.IBM J9 VM
What we learn is: HotSpot
Heap
In the JVM, both the java virtual machine stack and the local method stack are thread level, that is, each thread has a corresponding local method stack and java virtual machine stack
However, there is only one heap and method area in the JVM, and the size of heap memory can be adjusted.
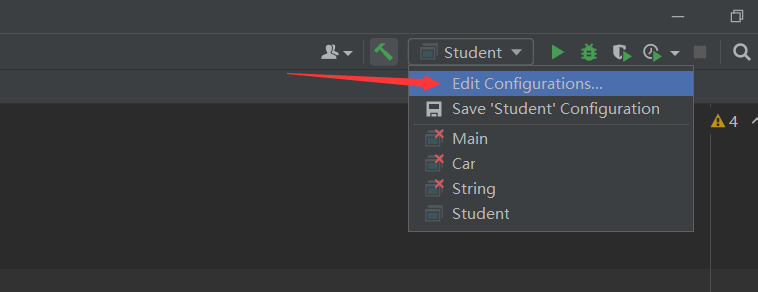
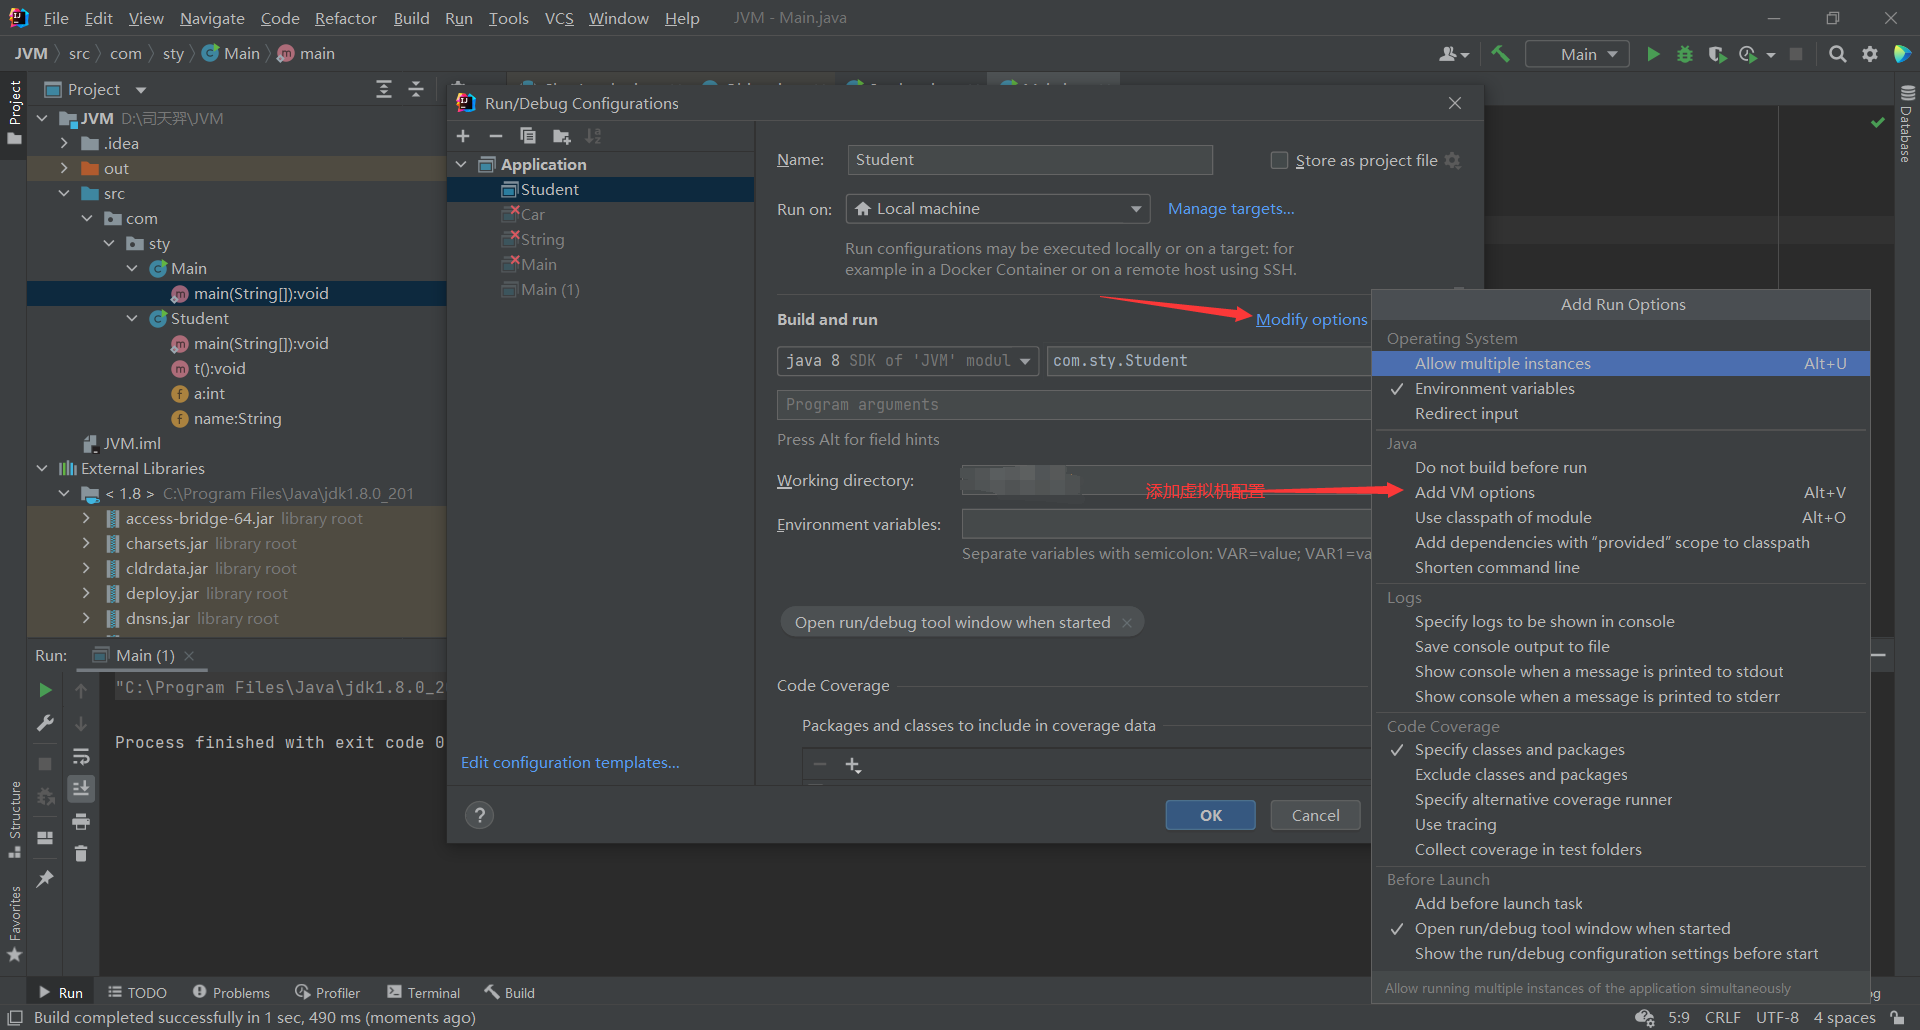
You can configure virtual machine parameters and configurator parameters in IDEA run settings
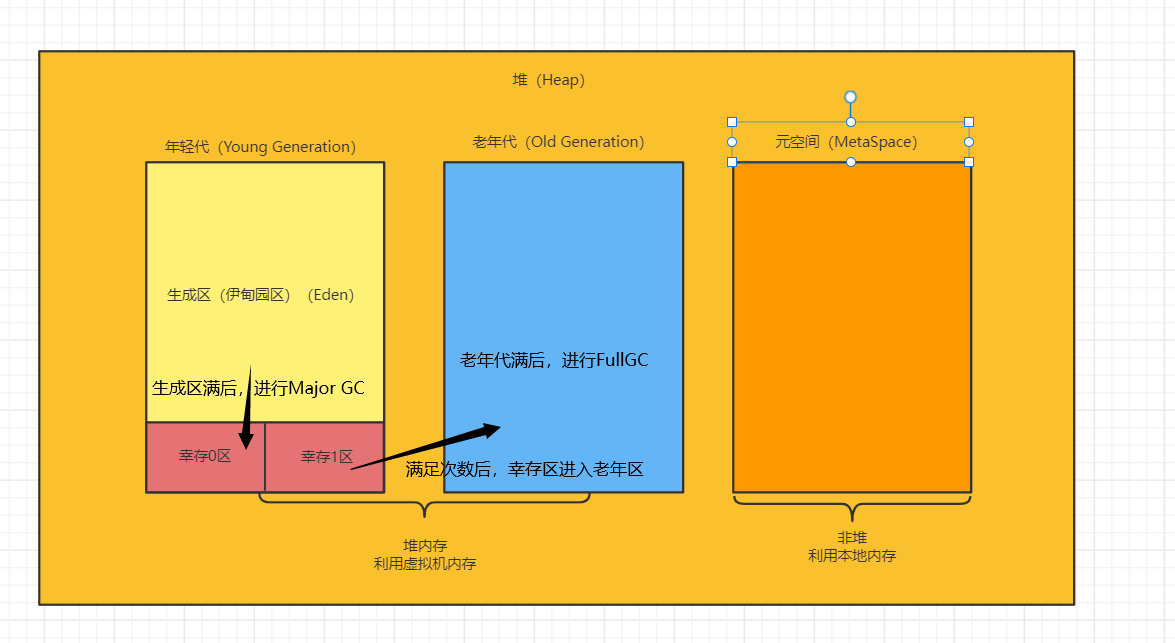
Partition of heap memory
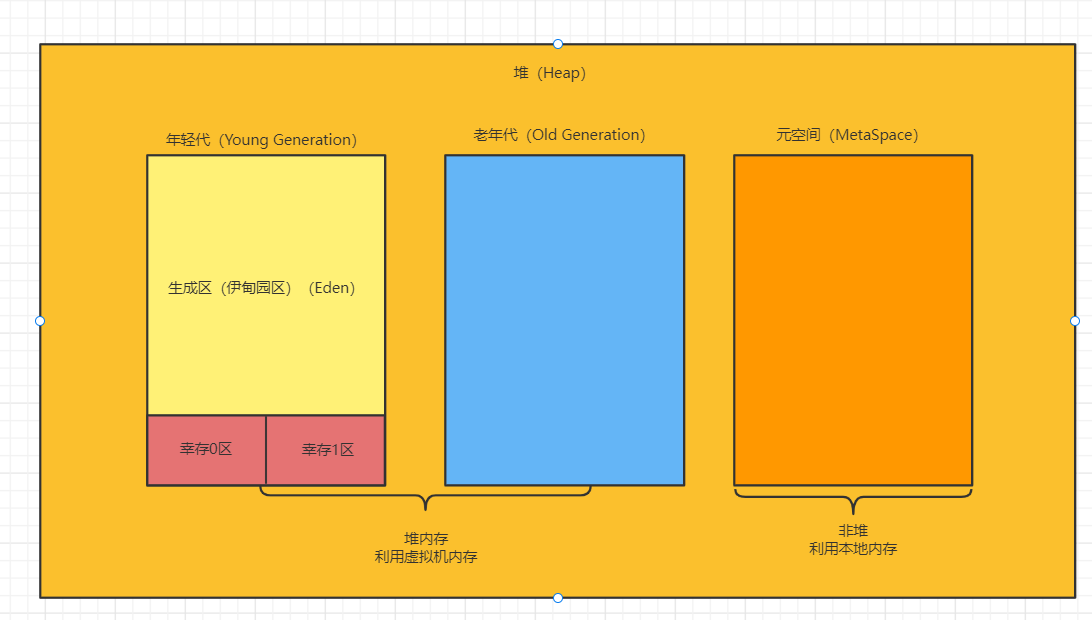
The heap memory is subdivided into three regions:
1. The Young Generation can be divided, in which the capacity of the generation area and the surviving area is 8:1:1
1. Generation area (Eden Park) (Eden)
2. Survivor, which can be divided into
1. Surviving 0 zone (FromSpace)
2. Surviving zone 1 (ToSpace)
2. Old Generation
3. Permanent Generation/MetaSpace
Here, the permanent generation and meta space cannot be completely equated
Evolution of permanent generation
jdk1. Before 6: it is a permanent generation, and the constant pool is in the method area
jdk1.7: it is a permanent generation, but it gradually degenerates. The constant pool is in the non heap
jdk1. After 8: there is no permanent generation, instead of meta space, and the constant pool is in the non heap
The biggest difference between the meta space and the permanent generation is that the meta space is not in the memory set by the virtual machine, but uses the local memory
This can also be seen in the simulation
When we configure the JVM memory, we set the maximum memory and initial memory to 1M, and output the GC process
-Xms1m -Xmx1m -XX:+PrintGCDetails
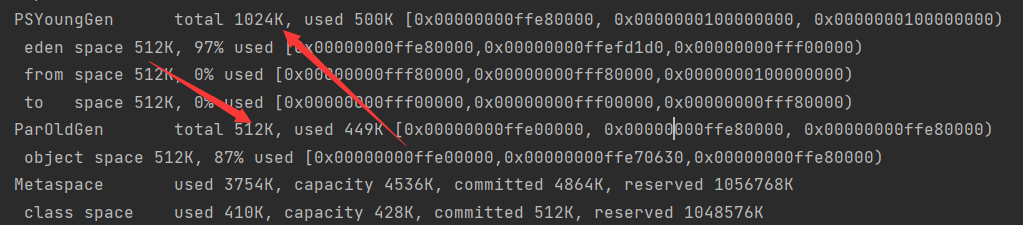 We can see that the total proportion of the younger generation and the older generation in the virtual machine is 1.5M
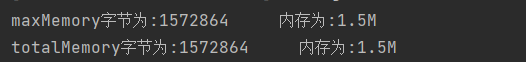
At this time, the memory of the virtual machine is also 1.5M, which indicates that it is in jdk1 In 8, the meta space does not occupy jvm memory
Method area and permanent generation / meta space
The relationship between the method area and the meta space is very vague. The method area and the permanent generation are not equivalent, but it can be explained far fetched that they are equivalent, but they are still different. The method area is more similar to a standard, and the permanent generation / meta space implements this standard, which is equivalent to the interface and interface implementation in java. The two will be equivalent in some cases below
Trigger conditions for Minor GC and Full GC
1. When the generation area (Eden Park) (Eden) is full, Minor GC will be triggered, and then those that cannot be deleted will be placed in the surviving area
As for how the surviving areas enter the old generation, This article An explanation is given
2. The article points out that when the object has experienced Minor CG for 15 times in the surviving area, it will be promoted to the old age, and this 15 can also be configured
3. When the old generation is full, the Full GC will be triggered to clean up the old generation
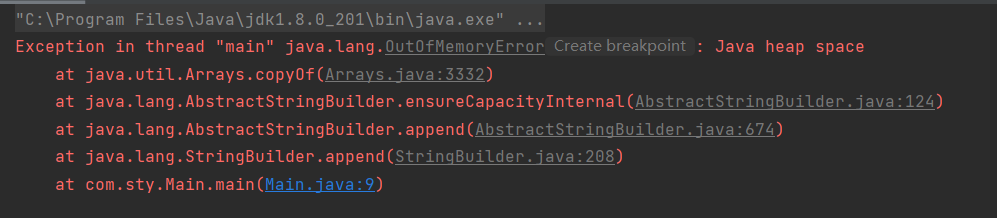
4. When the old age cannot be cleaned up, an OOM exception will be thrown
OOM(Out Of Memory)
According to the name, it can be clearly seen that the memory of the java program exceeds the limit at runtime and cannot be stored in the heap
We can manually simulate heap overflow (OOM). Because the real memory overflow is difficult to implement for ordinary programs, we can manually reduce the memory allocated by the JVM
First, set the initial allocated memory and the maximum allocated memory of the JVM to 2m

Then run the following code
public class Main {
    public static void main(String[] args) {
        String str="123";
        while(true){
            str+=new Random().nextInt(12345678)+new Random().nextInt(999999999)+new Random().nextInt(999999999);
        }
    }
}
The function of the code is to randomly splice data to str infinitely until the program cannot continue to run, and finally it will report OOM
Common configuration parameters of JVM heap
1.Java Heap parameters

-Xms: Indicates the initial heap size (common)

For example:-Xms1024m This means that the initial heap size is 1024 m

-Xmx: Indicates the maximum heap size (common)

-Xmn: Represents the size of the younger generation

-XX:NewRatio: Set the ratio of the younger generation to the older generation

For example:-XX:NewRatio=3,Young generation: old age = 1: 3,The younger generation accounts for 1/4

-XX:SurvivorRatio: set up Egen Area and two Survivor Area ratio

For example:-XX:SurvivorRatio=3,express Egen Zone: two Survivor area = 3 : 2,One Survivor Area 1/5

-XX:PermSize: Set the initial size of the persistent area, JDK1.8 Invalid from

-XX:MaxPermSize: Set the maximum value of the persistent area, JDK1.8 Invalid from

-XX:MetaspaceSize: Initial meta space size, JDK1.8 Effective from

-XX:MaxMetaspaceSize: The maximum value of the meta space, JDK1.8 Effective from

2.Garbage collector parameters

-XX:+UseSerialGC: Virtual machine running on Client Default value in mode, Serial+Serial Old

-XX:+UseParNewGC: ParNew+Serial Old,stay JDK1.8 Abandoned

-XX:+UseConcMarkSweepGC: ParNew+CMS+Serial Old,Serial Old The collector will act as CMS Collector appears Concurrent Mode Failure Backup collector usage after failure

-XX:+UseParallelGC: Virtual machine running on Server Default value in mode, Parallel Scavenge+Serial Old(PS Mark Sweep)

-XX:+UseParallelOldGC: Parallel Scavenge+Parallel Old

-XX:+UseG1GC: G1+G1

3.Tracking parameters

-XX:+PrintGC: obtain GC Preliminary information

-XX:+PrintGCDetail: Print GC Details of

-XX:+PrintGCTimeStamps: Print GC Timestamp of occurrence
JVM heap initial memory size
package com.sty;

import java.util.Random;

public class Main {
    public static void main(String[] args) {
        //The maximum memory the jvm virtual machine is trying to call
        long maxMemory = Runtime.getRuntime().maxMemory();
        //Returns the total memory of the jvm
        long totalMemory = Runtime.getRuntime().totalMemory();
        System.out.println("maxMemory Byte is:"+maxMemory+"     Memory is:"+maxMemory/1024*1.0/1024*1.0+"M");
        System.out.println("totalMemory Byte is:"+totalMemory+"     Memory is:"+totalMemory/1024*1.0/1024*1.0+"M");
    }
}
Through the following code, you can get the maximum memory that the jvm virtual machine attempts to call and the total memory returned to the jvm
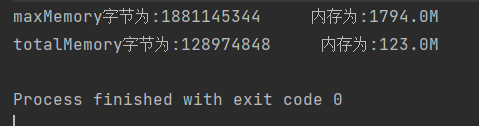
Generally speaking, the maximum memory attempted to call is 1 / 4 of the system memory, and the total memory returned by the jvm is 1 / 64 of the system maximum memory.