1, Foreword
How to learn if you can't use it?
Without scenes and demands, it seems that there is no need to learn these knowledge points.
In fact, the best way is to summarize, sort out, practice and output. After a set of combination boxing, you will master this series of knowledge.
However, it may not be used at the current stage. The JVM is a stable service, which can cause problems every day and which needs your constant troubleshooting. It's not like the code you wrote!
However, knowledge learning is to lay a foundation to a higher level before you have the opportunity to contact more interesting work and technological innovation. If you just learn a few instructions, it's not much fun. However, when you are asked to complete a set of full link monitoring, which needs to include the overall time-consuming of a method call, execution path, parameter information, abnormal results, GC times, stack data, generation content, etc., do you have enough knowledge to develop such a system?
OK, let's see what this article is about first, and then follow the steps of little brother Fu.
2, Interview questions
Thanks for the plane, notes!, I'm bored at home on weekends. I turn out the gray JVM virtual machine learning.
Xie: quack Quack, Hello, brother, what are you looking at this JVM virtual machine.
Interviewer: what are you looking at? I don't know where to start? Well, you start with the problem!
Xie: what's the problem? I just don't know what I can't do, and I don't know what to ask you.
Interviewer: ah! Let me ask you a question. How can I use the JVM fault handling tool to check what parameters are configured during JVM startup?
Xie: this!? No way!
Interviewer: what are the familiar monitoring instructions? If you ask how to count the heap memory statistics, do you know!?
Xie Fei: I don't know. Hahaha, I seem to know what to see!
Interviewer: go ahead, look at it with questions and sort it out after reading it!
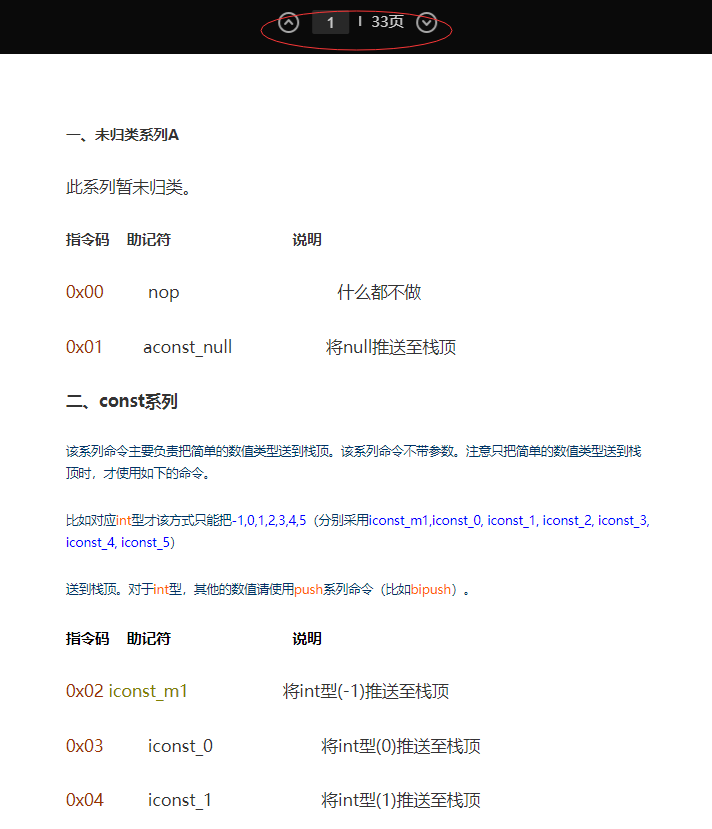
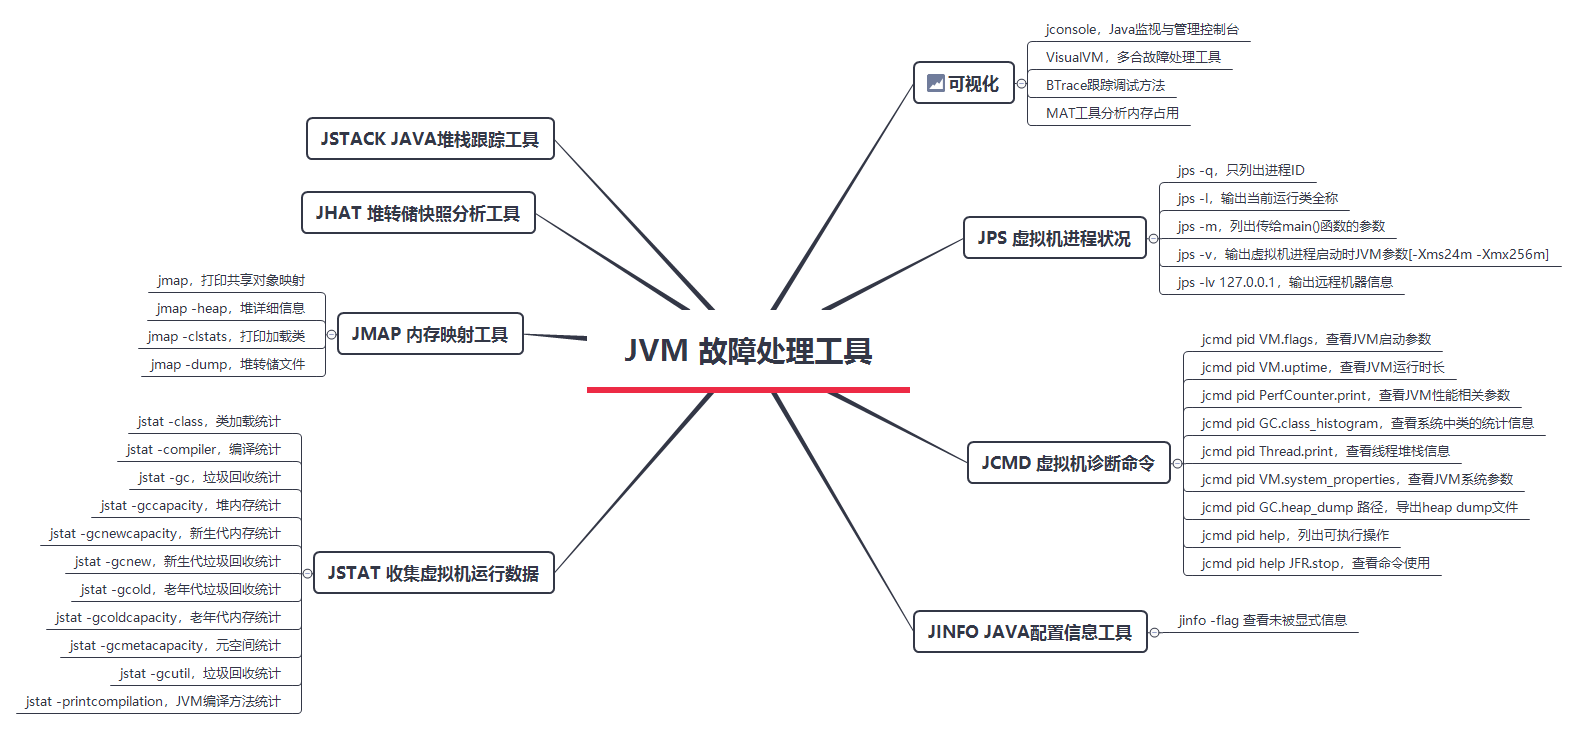
3, Basic fault handling tools
1. jps virtual machine process status
The function of jps (JVM Process Status Tool) is similar to that of ps command. It can list the running virtual machine processes and display the name of the virtual machine execution Main Class (the class where the main() function is located) and the local virtual machine unique ID (lvmid) of these processes, which is similar to the function of ps -ef | grep java.
Although the little guy is small, he has a single function. But it can be said that you basically have to use it first with other commands to query the LVMID to determine which virtual machine process to monitor.
Command format
jps [ options ] [ hostid ]
- Options: options and parameters. Different parameters can output the required information
- hostid: remote viewing
List of options
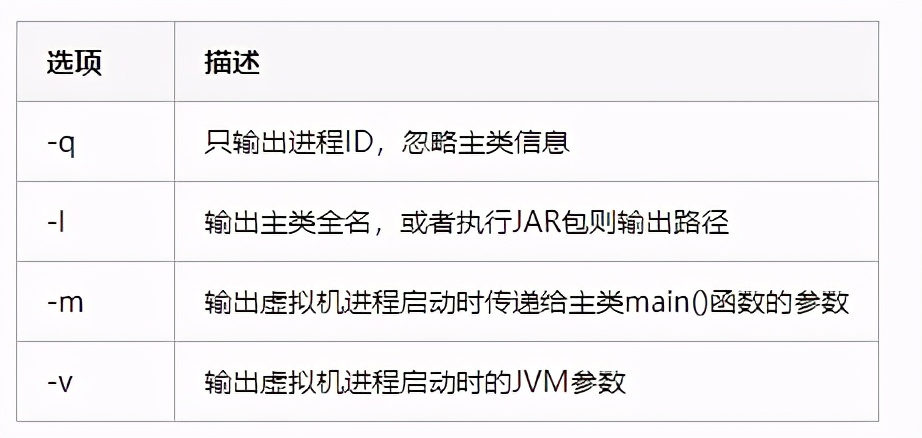
1.1 jps -q, only process ID s are listed
E:\itstack\git\github.com\interview>jps -q
104928
111552
26852
96276
59000
8460
76188
1.2 jps -l, output the full name of the current running class
E:\itstack\git\github.com\interview>jps -l
111552 org/netbeans/Main
26852
96276 org.jetbrains.jps.cmdline.Launcher
59000
62184 sun.tools.jps.Jps
8460 org/netbeans/Main
76188 sun.tools.jstatd.Jstatd
- The output of this command is much clearer, - l - is also a very common parameter option.
1.3 jps -m, list the parameters passed to the main() function
E:\itstack\git\github.com\interview>jps -m
111552 Main --branding visualvm --cachedir C:\Users\xiaofuge\AppData\Local\VisualVM\Cache/8u131 --openid 3041391569375200
26852
96276 Launcher C:/Program Files/JetBrains/IntelliJ IDEA 2019.3.1/plugins/java/lib/javac2.jar;C:/Program Files/JetBrains/IntelliJ IDEA 2019.3.1/plugins/java/lib/aether-api-1.1.0.jar;C:/Program Files/JetBrains/IntelliJ IDEA 2019.3.1/lib/jna-platform.jar;C:/Program Fi
les/JetBrains/IntelliJ IDEA 2019.3.1/lib/guava-27.1-jre.jar;C:/Program Files/JetBrains/IntelliJ IDEA 2019.3.1/lib/httpclient-4.5.10.jar;C:/Program Files/JetBrains/IntelliJ IDEA 2019.3.1/lib/forms-1.1-preview.jar;C:/Program Files/JetBrains/IntelliJ IDEA 2019.3.1/plu
gins/java/lib/aether-connector-basic-1.1.0.jar;C:/Program Files/JetBrains/IntelliJ IDEA 2019.3.1/plugins/java/lib/maven-model-builder-3.3.9.jar;C:/Program Files/JetBrains/IntelliJ IDEA 2019.3.1/lib/jps-model.jar;C:/Program Files/JetBrains/IntelliJ IDEA 2019.3.1/plu
gins/java/lib/maven-model-3.3.9.jar;C:/Program Files/JetBrains/IntelliJ IDEA 2019.3.1/plugins/java/lib/aether-impl-1.1.0.jar;C:/Program Files/JetBrains/IntelliJ IDEA 2019.3.1/lib/gson-2.8.5.jar;C:/Program File
59000
16844 Jps -m
8460 Main --branding visualvm --cachedir C:\Users\xiaofuge\AppData\Local\VisualVM\Cache/8u131 --openid 3041414336579200
76188 Jstatd
1.4 jps -v, output JVM parameters [- Xms24m -Xmx256m] when virtual machine process starts
E:\itstack\git\github.com\interview>jps -v
111552 Main -Xms24m -Xmx256m -Dsun.jvmstat.perdata.syncWaitMs=10000 -Dsun.java2d.noddraw=true -Dsun.java2d.d3d=false -Dnetbeans.keyring.no.master=true -Dplugin.manager.install.global=false --add-exports=java.desktop/sun.awt=ALL-UNNAMED --add-exports=jdk.jvmstat/sun
.jvmstat.monitor.event=ALL-UNNAMED --add-exports=jdk.jvmstat/sun.jvmstat.monitor=ALL-UNNAMED --add-exports=java.desktop/sun.swing=ALL-UNNAMED --add-exports=jdk.attach/sun.tools.attach=ALL-UNNAMED --add-modules=java.activation -XX:+IgnoreUnrecognizedVMOptions -Djdk.
home=C:/Program Files/Java/jdk1.8.0_161 -Dnetbeans.home=C:\Program Files\Java\jdk1.8.0_161\lib\visualvm\platform -Dnetbeans.user=C:\Users\xiaofuge1\AppData\Roaming\VisualVM\8u131 -Dnetbeans.default_userdir_root=C:\Users\xiaofuge1\AppData\Roaming\VisualVM -XX:+H
eapDumpOnOutOfMemoryError -XX:HeapDumpPath=C:\Users\xiaofuge1\AppData\Roaming\VisualVM\8u131\var\log\heapdump.hprof -Dsun.awt.keepWorkingSetOnMinimize=true -Dnetbeans.dirs=C:\Program Files\Java\jdk1.8.0_161\lib\visualvm\visualvm;C:\Program
59000  -Dfile.encoding=UTF-8 -Xms128m -Xmx1024m -XX:MaxPermSize=256m
76188 Jstatd -Denv.class.path=.;C:\Program Files\Java\jre1.8.0_161\lib;C:\Program Files\Java\jre1.8.0_161\lib\tool.jar; -Dapplication.home=C:\Program Files\Java\jdk1.8.0_161 -Xms8m -Djava.security.policy=jstatd.all.policy
1.5 jps -lv 127.0.0.1, output remote machine information
jps links to remote output JVM information. RMI registration is required, otherwise an error will be reported: RMI registry not available at 127.0 0.1.
Register RMI and open jstatd in your C: \ program files \ Java \ jdk1 8.0_ 161 \ bin , add jstatd all. Policy. No other suffixes
jstatd. all. The contents of the policy file are as follows:
grant codebase "file:${java.home}/../lib/tools.jar" {
   permission java.security.AllPermission;
};
After adding the configuration file, register the added jstatd. Jstatd in the bin directory all. Policy file: C: \ program files \ Java \ jdk1 8.0_ 161\bin>jstatd -J-Djava. security. policy=jstatd.all.policy
If successful, you can now view the JVM information of the original machine, as follows:
E:\itstack\git\github.com\interview>jps -l 127.0.0.1
111552 org/netbeans/Main
26852
96276 org.jetbrains.jps.cmdline.Launcher
36056 sun.tools.jps.Jps
59000
8460 org/netbeans/Main
76188 sun.tools.jstatd.Jstatd
- You can also combine jps option parameters, such as jps - LM 127.0 zero point one
2. jcmd virtual machine diagnosis command
jcmd is from jdk1 7 start the newly released JVM related information diagnosis tool, which can be used to export heap and thread information, view Java processes, execute GC, and conduct sampling analysis (flight recorder of jmc tool). Note that its use condition is that it can only be used on the same sever of the diagnosed JVM and has the same user and group
Command format
jcmd <pid | main class> <command ...|PerfCounter.print|-f file>
- pid, IDmain class of the process receiving the diagnostic command request, and main class of the process receiving the diagnostic command request.
- Command, the main class of the process that receives the diagnostic command request.
- PerfCounter.print, print the performance counters available on the target Java process.
- -f file, read the commands from the file file, and then call these commands on the target Java process.
- -l. View all process list information.
- -h. - help to view help information.
2.1 jcmd pid VM.flags to view the JVM startup parameters
E:\itstack\git\github.com\interview>jcmd 111552 VM.flags
111552:
-XX:CICompilerCount=4 -XX:+HeapDumpOnOutOfMemoryError -XX:HeapDumpPath=C:\Users\xiaofuge1\AppData\Roaming\VisualVM\8u131\var\log\heapdump.hprof -XX:+IgnoreUnrecognizedVMOptions -XX:InitialHeapSize=25165824 -XX:MaxHeapSize=268435456 -XX:MaxNewSize=89128960 -XX:Min
HeapDeltaBytes=524288 -XX:NewSize=8388608 -XX:OldSize=16777216 -XX:+UseCompressedClassPointers -XX:+UseCompressedOops -XX:+UseFastUnorderedTimeStamps -XX:-UseLargePagesIndividualAllocation -XX:+UseParallelGC
2.2 jcmd pid VM.uptime to view the JVM runtime
E:\itstack\git\github.com\interview>jcmd 111552 VM.uptime
111552:
583248.912 s
2.3 jcmd pid PerfCounter.print to view JVM performance related parameters
E:\itstack\git\github.com\interview>jcmd 111552 PerfCounter.print
111552:
java.ci.totalTime=56082522
java.cls.loadedClasses=5835
java.cls.sharedLoadedClasses=0
java.cls.sharedUnloadedClasses=0
java.cls.unloadedClasses=37
...
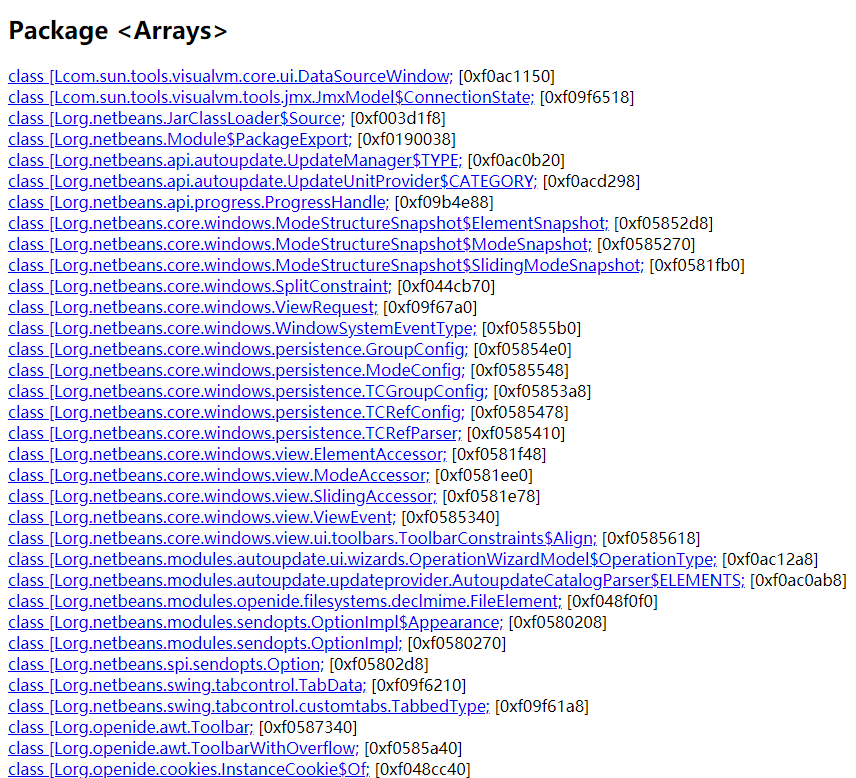
2.4 jcmd pid GC.class_histogram to view the statistics of classes in the system
E:\itstack\git\github.com\interview>jcmd 111552 GC.class_histogram
111552:

 num     #instances         #bytes  class name
----------------------------------------------
   1:         50543        3775720  [C
   2:          3443        2428248  [I
   3:         50138        1203312  java.lang.String
   4:         25351         811232  java.util.HashMap$Node
   5:          6263         712208  java.lang.Class
   6:          3134         674896  [B
   7:          6687         401056  [Ljava.lang.Object;
   8:          2468         335832  [Ljava.util.HashMap$Node;
2.5 jcmd pid Thread.print to view the thread stack information
E:\itstack\git\github.com\interview>jcmd 111552 Thread.print
111552:
2021-01-10 23:31:13
Full thread dump Java HotSpot(TM) 64-Bit Server VM (25.161-b12 mixed mode):

"Computes values in handlers" #52 daemon prio=5 os_prio=0 tid=0x0000000019839000 nid=0x16014 waiting for monitor entry [0x0000000026bce000]
   java.lang.Thread.State: BLOCKED (on object monitor)
        at com.sun.tools.visualvm.core.model.ModelFactory.getModel(ModelFactory.java:76)
        - waiting to lock <0x00000000f095bcf8> (a com.sun.tools.visualvm.jvmstat.application.JvmstatApplication)
        at com.sun.tools.visualvm.application.jvm.JvmFactory.getJVMFor(JvmFactory.java:45)
        at com.sun.tools.visualvm.application.options.Open.openApplication(Open.java:108)
        at com.sun.tools.visualvm.application.options.Open.process(Open.java:93)
        at org.netbeans.spi.sendopts.Option$1.process(Option.java:348)
        at org.netbeans.api.sendopts.CommandLine.process(CommandLine.java:278)
        at org.netbeans.modules.sendopts.HandlerImpl.execute(HandlerImpl.java:23)
        at org.netbeans.modules.sendopts.Handler.cli(Handler.java:30)
        at org.netbeans.CLIHandler.notifyHandlers(CLIHandler.java:195)
        at org.netbeans.core.startup.CLICoreBridge.cli(CLICoreBridge.java:43)
        at org.netbeans.CLIHandler.notifyHandlers(CLIHandler.java:195)
        at org.netbeans.CLIHandler$Server$1ComputingAndNotifying.run(CLIHandler.java:1176)
2.6 jcmd pid VM.system_properties to view the JVM system parameters
E:\itstack\git\github.com\interview>jcmd 111552 VM.system_properties
111552:
#Sun Jan 13 23:33:19 CST 2021
java.vendor=Oracle Corporation
netbeans.user=C\:\\Users\\xiaofuge1\\AppData\\Roaming\\VisualVM\\8u131
sun.java.launcher=SUN_STANDARD
sun.management.compiler=HotSpot 64-Bit Tiered Compilers
netbeans.autoupdate.version=1.23
os.name=Windows 10
2.7 jcmd pid GC.heap_dump path, export heap dump file
E:\itstack\git\github.com\interview>jcmd 111552 GC.heap_dump C:\Users\xiaofuge1\Desktop\_dump_0110
111552:
Heap dump file created
- The exported file needs to be viewed in conjunction with jvisualvm
2.8 jcmd pid help, listing executable operations
E:\itstack\git\github.com\interview>jcmd 111552 help
111552:
The following commands are available:
JFR.stop
JFR.start
JFR.dump
JFR.check
2.9 jcmd pid help JFR.stop, view command usage
E:\itstack\git\github.com\interview>jcmd 111552 help JFR.stop
111552:
JFR.stop
Stops a JFR recording

Impact: Low

Permission: java.lang.management.ManagementPermission(monitor)

Syntax : JFR.stop [options]

Options: (options must be specified using the <key> or <key>=<value> syntax)
        name : [optional] Recording name,.e.g \"My Recording\" (STRING, no default value)
        recording : [optional] Recording number, see JFR.check for a list of available recordings (JLONG, -1)
        discard : [optional] Skip writing data to previously specified file (if any) (BOOLEAN, false)
        filename : [optional] Copy recording data to file, e.g. \"C:\Users\user\My Recording.jfr\" (STRING, no default value)
        compress : [optional] GZip-compress "filename" destination (BOOLEAN, false)
3. jinfo Java configuration information tool
jinfo (Configuration Info for Java) to view and adjust various parameters of the JVM in real time.
When talking about the jps -v instruction above, you can see that it prints out the parameter list displayed when the virtual machine is started. However, if you want to see a specific parameter more clearly or want to know the parameters that are not explicitly specified, you can query it through jinfo -flag.
Command format
jinfo [ option ] pid
Mode of use
E:\itstack\git\github.com\interview>jinfo -flag MetaspaceSize 111552
-XX:MetaspaceSize=21807104

E:\itstack\git\github.com\interview>jinfo -flag MaxMetaspaceSize 111552
-XX:MaxMetaspaceSize=18446744073709486080

E:\itstack\git\github.com\interview>jinfo -flag HeapDumpPath 111552
-XX:HeapDumpPath=C:\Users\xiaofuge\AppData\Roaming\VisualVM\8u131\var\log\heapdump.hprof
- You can query all kinds of JVM parameters, which makes it easier to display only what you want.
4. jstat collects virtual machine operation data
jstat (JVM Statistics Monitoring Tool) is used to monitor various running status information of virtual machines. It can view runtime data such as class loading, memory, garbage collection, instant compilation, etc. in local or remote virtual machine processes.
Command format
jstat -<option> [-t] [-h<lines>] <vmid> [<interval> [<count>]]
- vmid: if you want to view a remote machine, you need to follow this format: [protocol:][//]lvmid[@hostname[:port]/servername]
- Interval and count indicate the query interval and times. For example, query the GC collection of process ID every 1000 milliseconds for 5 times each time. jstat -gc 111552 1000 5
List of options
Option description - class monitors the number of classes loaded and unloaded, the total space and the time spent on class loading - gc monitors the Java heap, including Eden area, two Survivor areas, old age, permanent generation or jdk1 8 yuan space, capacity, used space, total garbage collection time and other information - gccapacity monitoring content is basically the same as - gc, but the output mainly focuses on the maximum and minimum space used in each area of the Java heap - gcutil monitoring content is basically the same as - gc, but the output mainly focuses on the percentage of used space in the total space - gcpause has the same function as - gcutil, However, it will additionally output the causes of the last garbage collection - gcnew monitors the garbage collection of the new generation - gcnewcapacity monitors the content basically the same as - gcnew, the output mainly focuses on the maximum and minimum space used - gcold monitors the garbage collection of the old age - gcoldcapacity monitors the content basically the same as - gcold, and the output mainly focuses on the maximum and minimum space used Minimum space - compiler outputs information such as methods compiled by the real-time compiler and time-consuming - printcompilation outputs methods that have been compiled in real-time - gcpermcapacityjdk1 7 and below, permanent generation spatial statistics 8. Meta spatial statistics
- jstat has many monitoring options, but the most commonly used ones are the above.
4.01 jstat -class, class loading statistics
E:\itstack\git\github.com\interview>jps -q
104928
111552
26852
96276
59000
8460
76188
- Loaded, number of loaded class es
- Bytes: occupied space
- Unloaded: unloaded quantity
- Bytes: occupied space not loaded
- Time: time
4.02 jstat -compiler, compilation statistics
E:\itstack\git\github.com\interview>jps -l
111552 org/netbeans/Main
26852
96276 org.jetbrains.jps.cmdline.Launcher
59000
62184 sun.tools.jps.Jps
8460 org/netbeans/Main
76188 sun.tools.jstatd.Jstatd
- Compiled: compiled quantity
- Failed: number of failures
- Invalid: unavailable quantity
- Time: time
- FailedType: failure type
- FailedMethod: failed method
4.03 jstat -gc, garbage collection statistics
E:\itstack\git\github.com\interview>jps -m
111552 Main --branding visualvm --cachedir C:\Users\xiaofuge\AppData\Local\VisualVM\Cache/8u131 --openid 3041391569375200
26852
96276 Launcher C:/Program Files/JetBrains/IntelliJ IDEA 2019.3.1/plugins/java/lib/javac2.jar;C:/Program Files/JetBrains/IntelliJ IDEA 2019.3.1/plugins/java/lib/aether-api-1.1.0.jar;C:/Program Files/JetBrains/IntelliJ IDEA 2019.3.1/lib/jna-platform.jar;C:/Program Fi
les/JetBrains/IntelliJ IDEA 2019.3.1/lib/guava-27.1-jre.jar;C:/Program Files/JetBrains/IntelliJ IDEA 2019.3.1/lib/httpclient-4.5.10.jar;C:/Program Files/JetBrains/IntelliJ IDEA 2019.3.1/lib/forms-1.1-preview.jar;C:/Program Files/JetBrains/IntelliJ IDEA 2019.3.1/plu
gins/java/lib/aether-connector-basic-1.1.0.jar;C:/Program Files/JetBrains/IntelliJ IDEA 2019.3.1/plugins/java/lib/maven-model-builder-3.3.9.jar;C:/Program Files/JetBrains/IntelliJ IDEA 2019.3.1/lib/jps-model.jar;C:/Program Files/JetBrains/IntelliJ IDEA 2019.3.1/plu
gins/java/lib/maven-model-3.3.9.jar;C:/Program Files/JetBrains/IntelliJ IDEA 2019.3.1/plugins/java/lib/aether-impl-1.1.0.jar;C:/Program Files/JetBrains/IntelliJ IDEA 2019.3.1/lib/gson-2.8.5.jar;C:/Program File
59000
16844 Jps -m
8460 Main --branding visualvm --cachedir C:\Users\xiaofuge\AppData\Local\VisualVM\Cache/8u131 --openid 3041414336579200
76188 Jstatd
- S0C, S1C, size of the first and second surviving areas
- S0U, S1U, size of the first and second surviving areas
- EC, EU, size and use of Eden
- OC, OU, old age size and use
- MC, MU, size and use of method area
- CCSC, CCSU, compressed class space size and usage
- YGC, YGCT, garbage collection times and time-consuming of the younger generation
- FGC, FGCT, garbage collection times and time-consuming in old age
- GCT, total garbage collection time
4.04 jstat -gccapacity, heap memory statistics
E:\itstack\git\github.com\interview>jps -v
111552 Main -Xms24m -Xmx256m -Dsun.jvmstat.perdata.syncWaitMs=10000 -Dsun.java2d.noddraw=true -Dsun.java2d.d3d=false -Dnetbeans.keyring.no.master=true -Dplugin.manager.install.global=false --add-exports=java.desktop/sun.awt=ALL-UNNAMED --add-exports=jdk.jvmstat/sun
.jvmstat.monitor.event=ALL-UNNAMED --add-exports=jdk.jvmstat/sun.jvmstat.monitor=ALL-UNNAMED --add-exports=java.desktop/sun.swing=ALL-UNNAMED --add-exports=jdk.attach/sun.tools.attach=ALL-UNNAMED --add-modules=java.activation -XX:+IgnoreUnrecognizedVMOptions -Djdk.
home=C:/Program Files/Java/jdk1.8.0_161 -Dnetbeans.home=C:\Program Files\Java\jdk1.8.0_161\lib\visualvm\platform -Dnetbeans.user=C:\Users\xiaofuge1\AppData\Roaming\VisualVM\8u131 -Dnetbeans.default_userdir_root=C:\Users\xiaofuge1\AppData\Roaming\VisualVM -XX:+H
eapDumpOnOutOfMemoryError -XX:HeapDumpPath=C:\Users\xiaofuge1\AppData\Roaming\VisualVM\8u131\var\log\heapdump.hprof -Dsun.awt.keepWorkingSetOnMinimize=true -Dnetbeans.dirs=C:\Program Files\Java\jdk1.8.0_161\lib\visualvm\visualvm;C:\Program
59000  -Dfile.encoding=UTF-8 -Xms128m -Xmx1024m -XX:MaxPermSize=256m
76188 Jstatd -Denv.class.path=.;C:\Program Files\Java\jre1.8.0_161\lib;C:\Program Files\Java\jre1.8.0_161\lib\tool.jar; -Dapplication.home=C:\Program Files\Java\jdk1.8.0_161 -Xms8m -Djava.security.policy=jstatd.all.policy
- NGCMN, NGCMX, Cenozoic minimum and maximum capacity
- NGC, current Cenozoic capacity
- S0C, S1C, first and second survival area sizes
- EC, the size of Eden Park
- OGCMN, OGCMX, minimum and maximum capacity in old age
- OGC, OC, current generation size
- MCMN, MCMX, minimum and maximum capacity of metadata space
- MC, current meta space size
- CCSMN, CCSMX, minimum and maximum space of compression class
- YGC, number of young generation GC
- FGC, number of GC in elderly generation
4.05 jstat -gcnewcapacity, new generation memory statistics
E:\itstack\git\github.com\interview>jstat -gcnewcapacity 111552
  NGCMN      NGCMX       NGC      S0CMX     S0C     S1CMX     S1C       ECMX        EC      YGC   FGC
    8192.0    87040.0    80384.0  28672.0   1024.0  28672.0    512.0    86016.0    77312.0    60    52
- NGCMN, NGCMX, Cenozoic minimum and maximum capacity
- NGC, current Cenozoic capacity
- S0CMX, maximum surviving 0 area size
- S0C, current surviving 0 area size
- S1CMX, maximum surviving zone 1 Size
- S1C, current surviving zone 1 Size
- ECMX, the largest Eden Park size
- EC, current Eden Park size
- YGC, garbage collection times of young generation
- FGC, recovery times of elderly generation
4.06 jstat -gcnew, statistics of new generation garbage collection
E:\itstack\git\github.com\interview>jstat -gcnew 111552
 S0C    S1C    S0U    S1U   TT MTT  DSS      EC       EU     YGC     YGCT
1024.0  512.0    0.0    0.0  3  15  512.0  77312.0     70.2     60    0.649
- S0C, S1C, first and second survival area sizes
- S0U, S1U, used in the first and second survival areas
- TT, the number of times the object survived in the Cenozoic
- MTT, the maximum number of times an object survives in the Cenozoic
- DSS: expected survival area size
- EC, the size of Eden Park
- EU, use of Eden Park
- YGC, garbage collection times of young generation
- YGCT, waste collection time of young generation
4.07 jstat -gcold, garbage collection statistics in old age
E:\itstack\git\github.com\interview>jstat -gcold 111552
   MC       MU      CCSC     CCSU       OC          OU       YGC    FGC    FGCT     GCT
 37120.0  34423.3   5376.0   4579.4     39424.0     13622.9     60    52    3.130    3.779
- MC, MU, size and use of method area
- CCSC, CCSU, compressed class space size and usage
- OC, OU, old age size and use
- YGC, garbage collection times of young generation
- FGC, garbage collection times in old age
- FGCT, garbage collection in the old age takes time
- GCT, total garbage collection time
4.08 jstat -gcoldcapacity, old age memory statistics
E:\itstack\git\github.com\interview>jstat -gcoldcapacity 111552
   OGCMN       OGCMX        OGC         OC       YGC   FGC    FGCT     GCT
    16384.0    175104.0     39424.0     39424.0    60    52    3.130    3.779
- OGCMN, OGCMX, minimum and maximum capacity in old age
- OGC, current generation size
- OC, old age size
- YGC, garbage collection times of young generation
- FGC, garbage collection times in old age
- FGCT, garbage collection in the old age takes time
- GCT, total time consumption of garbage collection
4.09 jstat - gcmatacacity, meta spatial statistics
E:\itstack\git\github.com\interview>jstat -gcmetacapacity 111552
   MCMN       MCMX        MC       CCSMN      CCSMX       CCSC     YGC   FGC    FGCT     GCT
       0.0  1081344.0    37120.0        0.0  1048576.0     5376.0    60    52    3.130    3.779
- MCMN, MCMX, minimum and maximum capacity of meta space
- MC, current metadata space size
- CCSMN, CCSMX, minimum and maximum space of compression class
- CCSC, compressed class space size
- YGC, garbage collection times of young generation
- FGC, garbage collection times in old age
- FGCT, garbage collection in the old age takes time
- GCT, total time consumption of garbage collection
4.10 jstat -gcutil, garbage collection statistics
E:\itstack\git\github.com\interview>jstat -gcutil 111552
  S0     S1     E      O      M     CCS    YGC     YGCT    FGC    FGCT     GCT
  0.00   0.00   0.09  34.55  92.74  85.18     60    0.649    52    3.130    3.779
- S0, S1, surviving zones 1 and 2, current use proportion
- E. Proportion of Eden Park
- O. Proportion of elderly generation
- M. Usage proportion of metadata area
- CCS, proportion of compressed class
- YGC, garbage collection times of young generation
- FGC, garbage collection times in old age
- FGCT, garbage collection in the old age takes time
- GCT, total time consumption of garbage collection
4.11 jstat -printcompilation, JVM compilation method statistics
E:\itstack\git\github.com\interview>jstat -printcompilation 111552
Compiled  Size  Type Method
    3642      9    1 java/io/BufferedWriter min
- Compiled: number of recently compiled methods
- Size: the number of bytecodes of the most recently compiled method
- Type: the compilation type of the most recently compiled method
- Method: method name ID
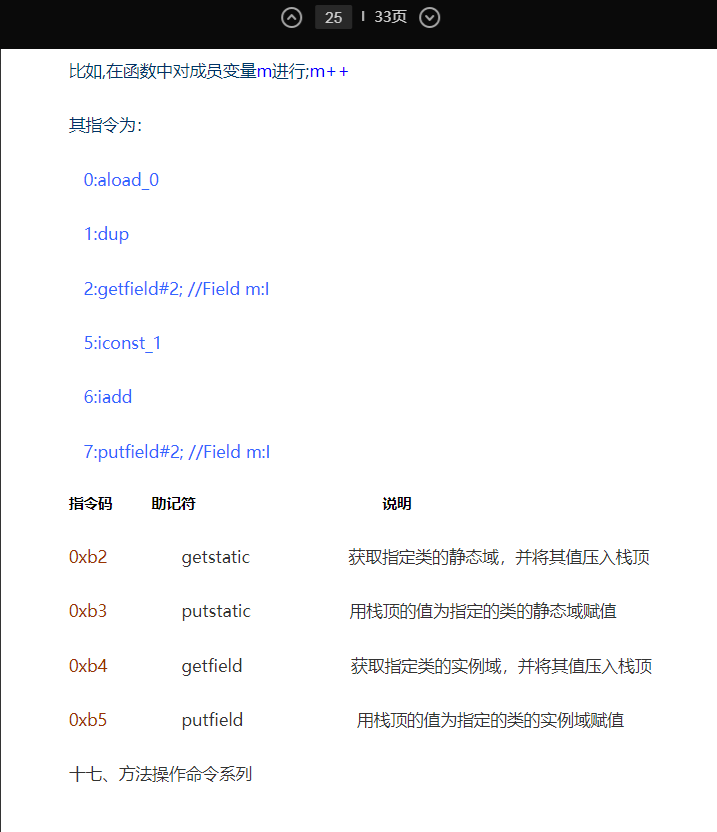
5. jmap memory mapping tool
jmap (Memory Map for Java) is used to generate heap dump snapshots (heapdump files).
In addition to obtaining a heap dump snapshot, jmap can also query the details of finalize execution queue, Java heap and method area.
Command format
jmap [ option ] pid
- Option: option parameter
- pid: process ID that needs to print configuration information
- Executable: the Java executable that generates the core dump
- Core: the core file that needs to print configuration information
- Server id: optional unique id. if multiple debugging servers are running on the same remote host, use this option parameter to identify the server
- remote server IP or hostname: the IP address or hostname of the remote debugging server
List of options
Option description - dump generates a snapshot of the Java heap dump- finalizerinfo displays the objects in the F-Queue waiting for the Finalizer thread to execute the finalize method. Linux platform heap displays Java heap details, such as what kind of collector is used, parameter configuration, and generation. Linux platform - histo displays the statistics of objects in the heap, including classes, number of instances and total capacity - permstat displays the permanent generation memory status, jdk1 7. Permanent generation - F when the virtual machine process has no response to the - dump option, you can force the snapshot to be generated. Linux platform
5.1 jmap, print shared object mapping
grant codebase "file:${java.home}/../lib/tools.jar" {
   permission java.security.AllPermission;
};
5.2 jmap -heap, heap details
E:\itstack\git\github.com\interview>jmap -heap 111552
Attaching to process ID 111552, please wait...
Debugger attached successfully.
Server compiler detected.
JVM version is 25.161-b12

using thread-local object allocation.
Parallel GC with 8 thread(s)

Heap Configuration:
   MinHeapFreeRatio         = 0
   MaxHeapFreeRatio         = 100
   MaxHeapSize              = 268435456 (256.0MB)
   NewSize                  = 8388608 (8.0MB)
   MaxNewSize               = 89128960 (85.0MB)
   OldSize                  = 16777216 (16.0MB)
   NewRatio                 = 2
   SurvivorRatio            = 8
   MetaspaceSize            = 21807104 (20.796875MB)
   CompressedClassSpaceSize = 1073741824 (1024.0MB)
   MaxMetaspaceSize         = 17592186044415 MB
   G1HeapRegionSize         = 0 (0.0MB)
5.3 jmap -clstats, print load class
E:\itstack\git\github.com\interview> jmap -clstats 111552
Attaching to process ID 111552, please wait...
Debugger attached successfully.
Server compiler detected.
JVM version is 25.161-b12
finding class loader instances ..done.
computing per loader stat ..done.
please wait.. computing liveness.................................................................liveness analysis may be inaccurate ...
class_loader    classes bytes   parent_loader   alive?  type

<bootstrap>     3779    6880779   null          live    <internal>
0x00000000f03853b8      57      132574  0x00000000f031aac8      live    org/netbeans/StandardModule$OneModuleClassLoader@0x00000001001684f0
0x00000000f01b9b98      0       0       0x00000000f031aac8      live    org/netbeans/StandardModule$OneModuleClassLoader@0x00000001001684f0
0x00000000f005b280      0       0       0x00000000f031aac8      live    java/util/ResourceBundle$RBClassLoader@0x00000001000c6ae0
0x00000000f01dfa98      0       0       0x00000000f031aac8      live    org/netbeans/StandardModule$OneModuleClassLoader@0x00000001001684f0
0x00000000f01ec518      79      252894  0x00000000f031aac8      live    org/netbeans/StandardModule$OneModuleClassLoader@0x00000001001684f0
5.4 jmap -dump, heap dump file
E:\itstack\git\github.com\interview>jmap -dump:live,format=b,file=C:/Users/xiaofuge/Desktop/heap.bin 111552
Dumping heap to C:\Users\xiaofuge\Desktop\heap.bin ...
Heap dump file created
6. jhat heap dump snapshot analysis tool
jhat (JVM Heap Analysis Tool), used in conjunction with jmap, is used to analyze heap dump snapshots generated by jmap.
jhat has built-in a small http/web server, which can display the results of heap dump snapshot analysis in the browser. However, it is not very useful. Basically, everyone will use other third-party tools.
Command format
jhat [-stack <bool>] [-refs <bool>] [-port <port>] [-baseline <file>] [-debug <int>] [-version] [-h|-help] <file>
Command use
E:\itstack\git\github.com\interview>jhat -port 8090 C:/Users/xiaofuge1/Desktop/heap.bin
Reading from C:/Users/xiaofuge1/Desktop/heap.bin...
Dump file created Wed Jan 13 16:53:47 CST 2021
Snapshot read, resolving...
Resolving 246455 objects...
Chasing references, expect 49 dots.................................................
Eliminating duplicate references.................................................
Snapshot resolved.
Started HTTP server on port 8090
Server is ready.
http://localhost:8090/
7. jstack Java stack trace tool
Jstag (Stack Trace for Java) is used to generate thread snapshots (threaddump, javacore) of the virtual machine at the current time.
Thread snapshot is a collection of method stacks being executed by each thread in the current virtual machine. The purpose of generating thread snapshot is usually to locate the causes of long-time pause of threads, such as thread deadlock, dead loop, hanging caused by long time consuming to request external resources, etc.
When a thread pauses, you can check the call stack of each thread through jstack to get what the unresponsive thread is doing.
Command format
jstack [ option ] vmid
Option parameters
Option description - F when the normal output request is not responded, force the output thread stack - l in addition to the stack, display additional information about the lock - m if the local method is called, the c/c + + stack can be displayed
Command use
E:\itstack\git\github.com\interview>jstack 111552
2021-01-10 23:15:03
Full thread dump Java HotSpot(TM) 64-Bit Server VM (25.161-b12 mixed mode):

"Inactive RequestProcessor thread [Was:StdErr Flush/org.netbeans.core.startup.logging.PrintStreamLogger]" #59 daemon prio=1 os_prio=-2 tid=0x000000001983a800 nid=0x688 in Object.wait() [0x0000000017fbf000]
   java.lang.Thread.State: TIMED_WAITING (on object monitor)
        at java.lang.Object.wait(Native Method)
        at org.openide.util.RequestProcessor$Processor.run(RequestProcessor.java:1939)
        - locked <0x00000000fab31d88> (a java.lang.Object)
- In the process of verifying the use, you can try to write an endless thread, and then view the thread information through jstack.
4, Visual fault handling tool
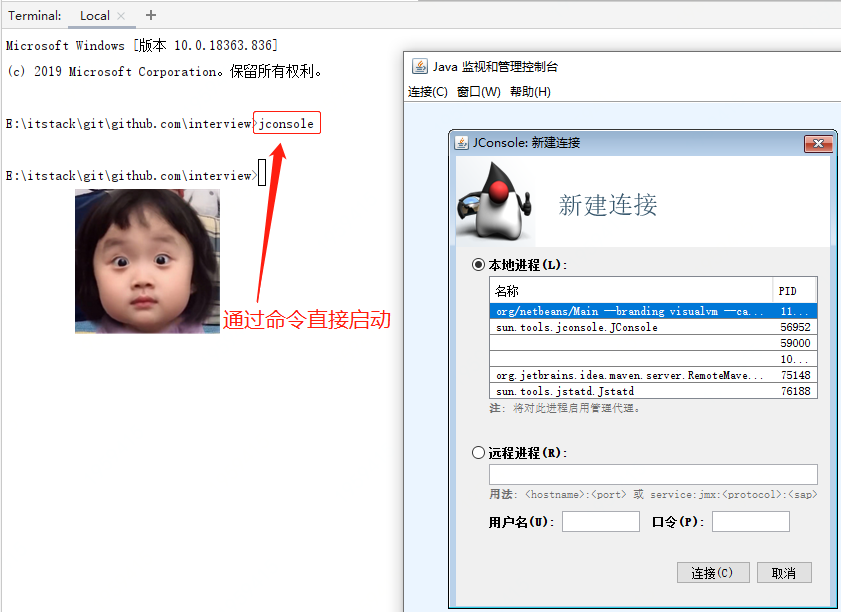
1. jconsole, Java monitoring and management console
JConsole (Java Monitoring and Management Console) is a Java management console based on JMX
Extensions).
Its function is mainly to collect and adjust the parameters of the system. It can not only be managed in the virtual machine itself, but also be developed in software. It is an open service with corresponding code API calls.
JConsole startup
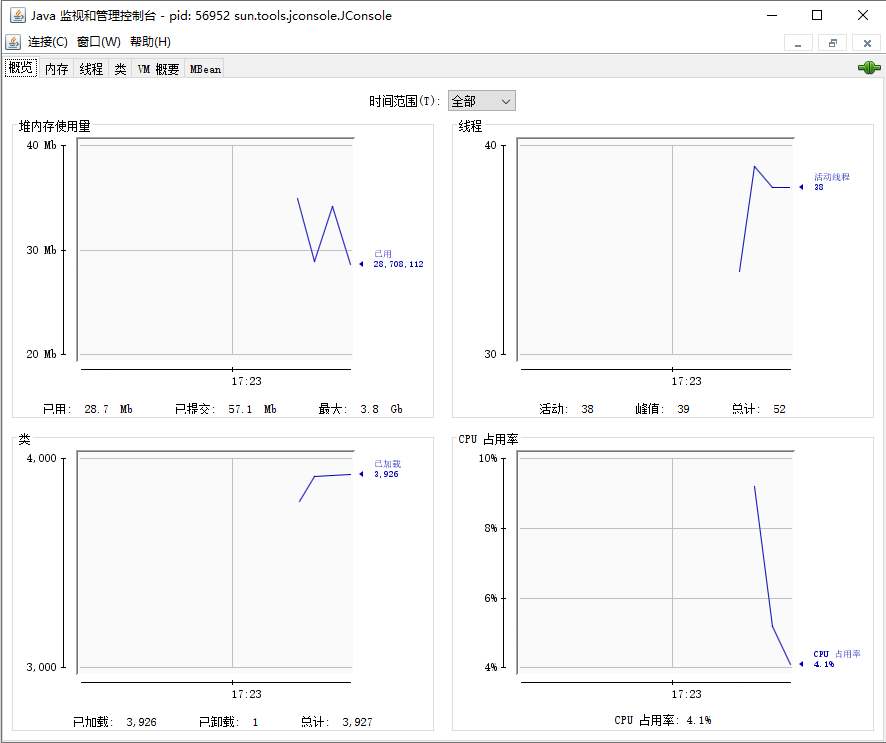
JConsole use
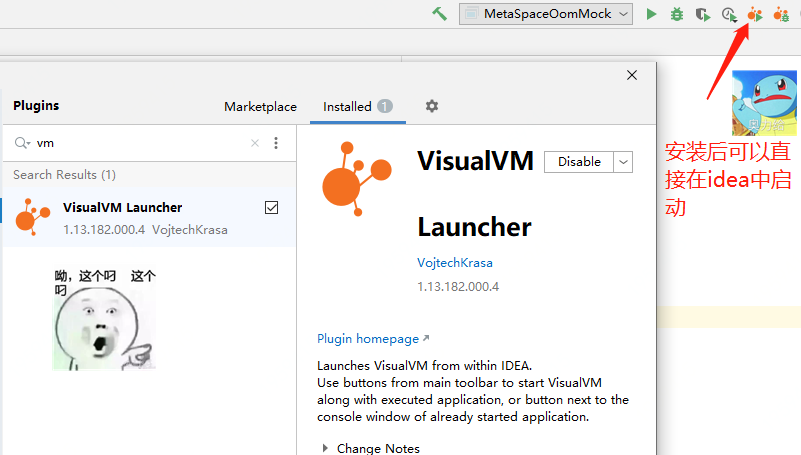
2. VisualVM, multi combination fault handling tool
VisualVM (all in one Java troubleshooting tool) is one of the most powerful tools for operation monitoring and troubleshooting.
In addition to routine operation monitoring and fault handling, it can also do performance analysis. Because of its strong universality and less impact on applications, it can be directly connected to the production environment.
VisualVM IDEA installation
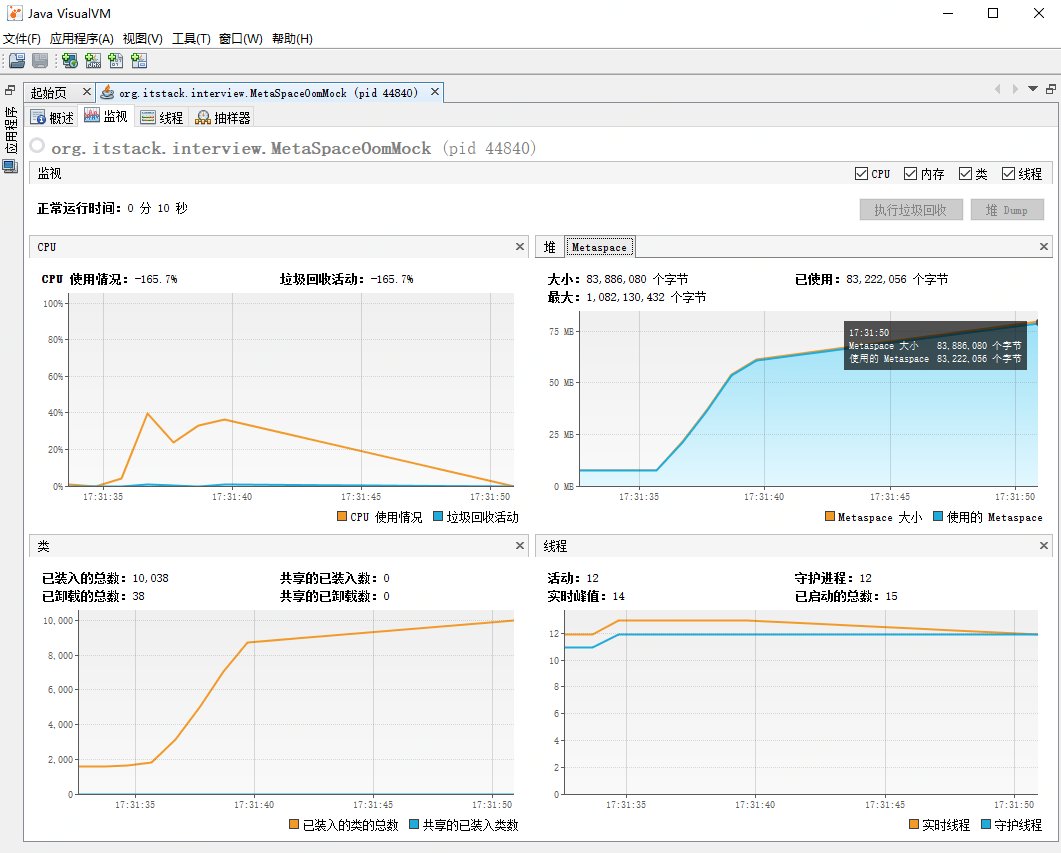
Visual VM usage
public static void main(String[] args) throws InterruptedException {

    Thread.sleep(5000);
    ClassLoadingMXBean loadingBean = ManagementFactory.getClassLoadingMXBean();
    while (true) {
        Enhancer enhancer = new Enhancer();
        enhancer.setSuperclass(MetaSpaceOomMock.class);
        enhancer.setCallbackTypes(new Class[]{Dispatcher.class, MethodInterceptor.class});
        enhancer.setCallbackFilter(new CallbackFilter() {
            @Override
            public int accept(Method method) {
                return 1;
            }
            @Override
            public boolean equals(Object obj) {
                return super.equals(obj);
            }
        });
        System.out.println(enhancer.createClass().getName() + loadingBean.getTotalLoadedClassCount() + loadingBean.getLoadedClassCount() + loadingBean.getUnloadedClassCount());
    }
}
Remember to resize the meta space
-XX:MetaspaceSize=8m
-XX:MaxMetaspaceSize=80m
-Djava.rmi.server.hostname=127.0.0.1
-Dcom.sun.management.jmxremote
-Dcom.sun.management.jmxremote.port=7397
-Dcom.sun.management.jmxremote.ssl=false
-Dcom.sun.management.jmxremote.authenticate=false
- Let's monitor this code that overflows the meta space, Java lang.OutOfMemoryError: Metaspace
Monitoring results
5, Summary
- This article is also a summary of little brother Fu's learning in-depth understanding of the Java virtual machine. It includes many commonly used instructions. Through the learning of these instructions, we will probably know what monitoring information the JVM provides us.
- In fact, in actual business use, the JVM is rarely monitored through instructions. Instead, there is a complete set of non-invasive full link monitoring. In the monitoring service, it is monitored together with the JVM during method call, which can enable R & D personnel to troubleshoot problems more quickly. However, the realization of these tools still needs these foundations. After mastering the basic knowledge, you can use tools more.
- The learning of programming technology knowledge must be verified by practice, otherwise it is easy to forget and difficult to master. When you knock your hand several times, you will have a completely different understanding. All right, come on! I hope this article can encourage your salary!
Finally, Xiaobian has prepared a complete set of JVM instruction manual, 33 page PDF document and detailed JVM instruction notes for you. If you feel you need it, you can get it by private letter to me "JVM"!!